Zip Codes with the Highest Percentage of Population Employed in Real Estate, Rental & Leasing in Henderson, NV
RELATED REPORTS & OPTIONS
Real Estate, Rental & Leasing
Henderson
Compare Zip Codes
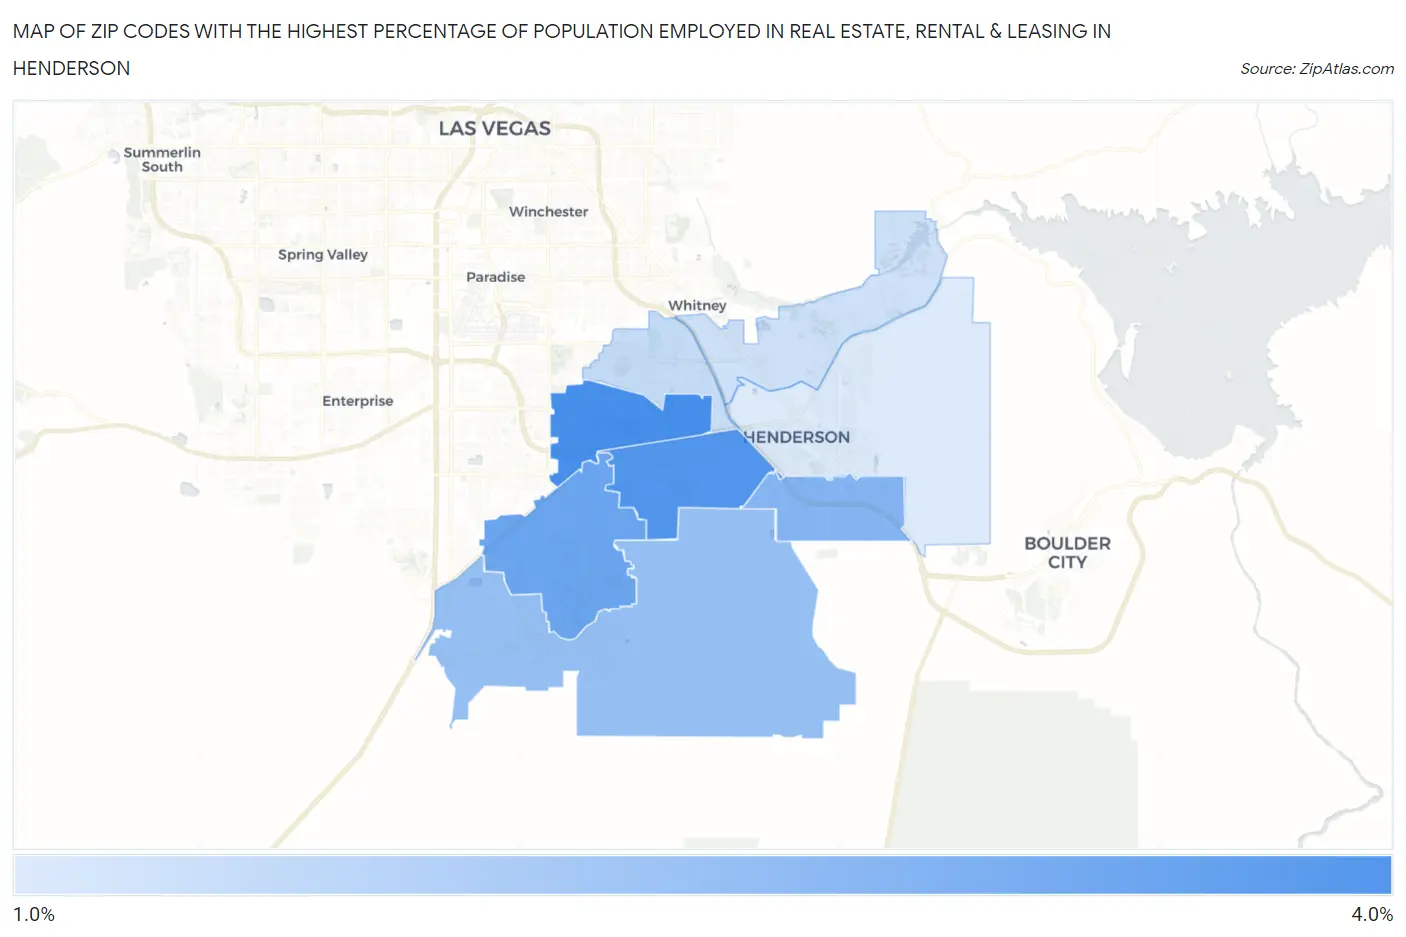
Map of Zip Codes with the Highest Percentage of Population Employed in Real Estate, Rental & Leasing in Henderson
1.8%
3.9%
Zip Codes with the Highest Percentage of Population Employed in Real Estate, Rental & Leasing in Henderson, NV
| Zip Code | % Employed | vs State | vs National | |
| 1. | 89074 | 3.9% | 2.5%(+1.46)#25 | 1.9%(+2.04)#2,251 |
| 2. | 89012 | 3.8% | 2.5%(+1.29)#28 | 1.9%(+1.87)#2,430 |
| 3. | 89052 | 3.4% | 2.5%(+0.936)#33 | 1.9%(+1.51)#3,013 |
| 4. | 89002 | 3.0% | 2.5%(+0.572)#42 | 1.9%(+1.15)#3,777 |
| 5. | 89044 | 2.8% | 2.5%(+0.329)#50 | 1.9%(+0.908)#4,435 |
| 6. | 89014 | 2.1% | 2.5%(-0.348)#81 | 1.9%(+0.230)#7,203 |
| 7. | 89011 | 2.0% | 2.5%(-0.492)#90 | 1.9%(+0.086)#7,967 |
| 8. | 89015 | 1.8% | 2.5%(-0.680)#97 | 1.9%(-0.101)#9,198 |
1
Common Questions
What are the Top 5 Zip Codes with the Highest Percentage of Population Employed in Real Estate, Rental & Leasing in Henderson, NV?
Top 5 Zip Codes with the Highest Percentage of Population Employed in Real Estate, Rental & Leasing in Henderson, NV are:
What zip code has the Highest Percentage of Population Employed in Real Estate, Rental & Leasing in Henderson, NV?
89074 has the Highest Percentage of Population Employed in Real Estate, Rental & Leasing in Henderson, NV with 3.9%.
What is the Percentage of Population Employed in Real Estate, Rental & Leasing in Henderson, NV?
Percentage of Population Employed in Real Estate, Rental & Leasing in Henderson is 3.1%.
What is the Percentage of Population Employed in Real Estate, Rental & Leasing in Nevada?
Percentage of Population Employed in Real Estate, Rental & Leasing in Nevada is 2.5%.
What is the Percentage of Population Employed in Real Estate, Rental & Leasing in the United States?
Percentage of Population Employed in Real Estate, Rental & Leasing in the United States is 1.9%.