Zip Codes with the Highest Percentage of Population Employed in Sales & Related in Henderson, NV
RELATED REPORTS & OPTIONS
Sales & Related
Henderson
Compare Zip Codes
Map of Zip Codes with the Highest Percentage of Population Employed in Sales & Related in Henderson
8.9%
12.7%
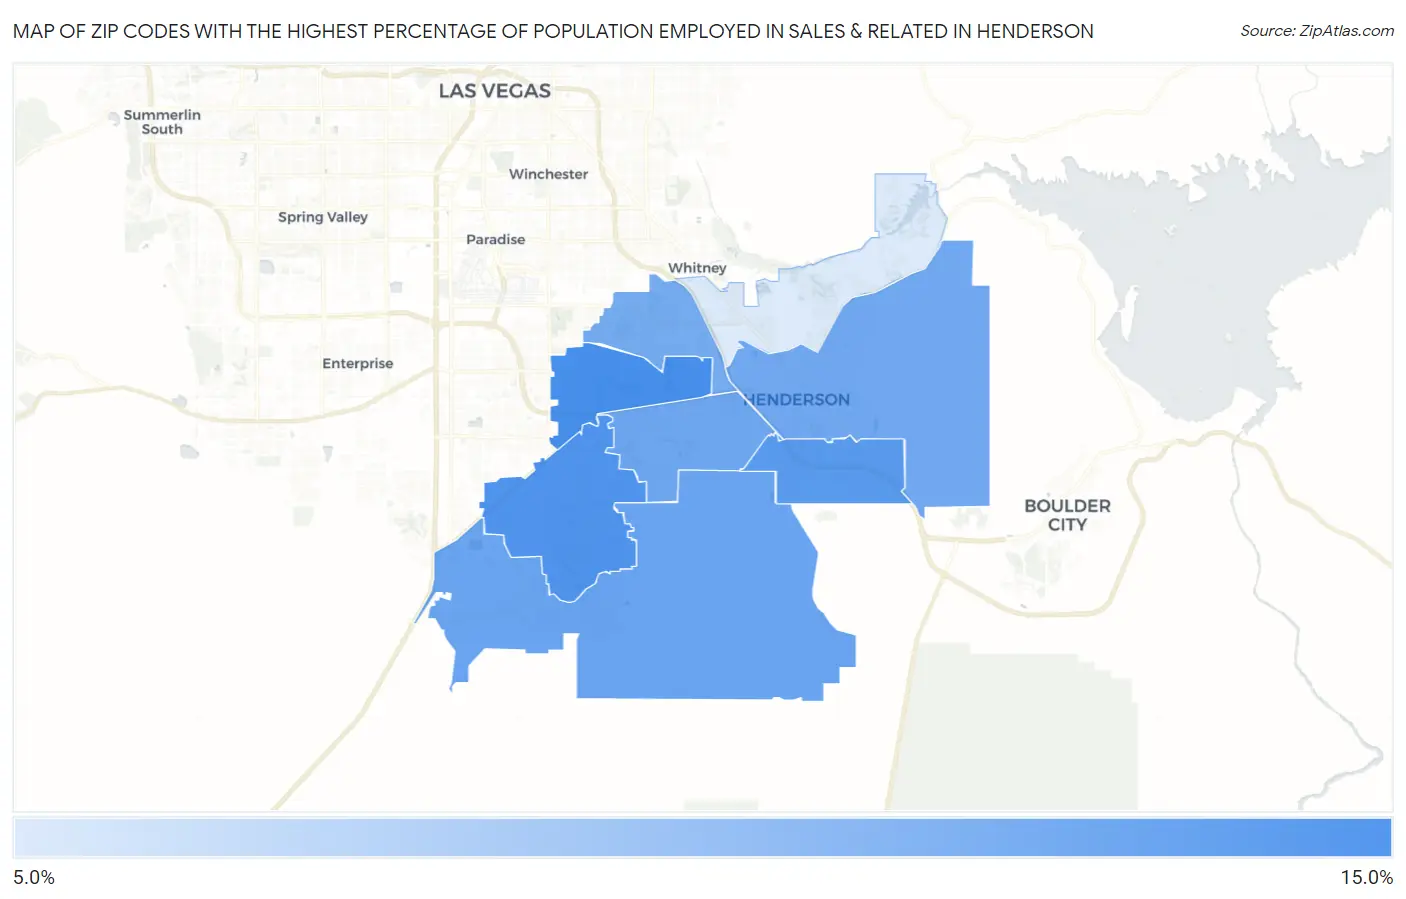
Zip Codes with the Highest Percentage of Population Employed in Sales & Related in Henderson, NV
| Zip Code | % Employed | vs State | vs National | |
| 1. | 89074 | 12.7% | 10.4% (+2.31)#34 | 9.6% (+3.14)#4,840 |
| 2. | 89052 | 12.5% | 10.4% (+2.09)#36 | 9.6% (+2.92)#5,149 |
| 3. | 89002 | 12.3% | 10.4% (+1.88)#39 | 9.6% (+2.70)#5,486 |
| 4. | 89044 | 11.8% | 10.4% (+1.41)#45 | 9.6% (+2.24)#6,351 |
| 5. | 89012 | 11.7% | 10.4% (+1.32)#49 | 9.6% (+2.15)#6,510 |
| 6. | 89015 | 11.7% | 10.4% (+1.24)#51 | 9.6% (+2.07)#6,679 |
| 7. | 89014 | 11.5% | 10.4% (+1.13)#53 | 9.6% (+1.95)#6,912 |
| 8. | 89011 | 8.9% | 10.4% (-1.52)#102 | 9.6% (-0.698)#14,911 |
1
Common Questions
What are the Top 5 Zip Codes with the Highest Percentage of Population Employed in Sales & Related in Henderson, NV?
Top 5 Zip Codes with the Highest Percentage of Population Employed in Sales & Related in Henderson, NV are:
What zip code has the Highest Percentage of Population Employed in Sales & Related in Henderson, NV?
89074 has the Highest Percentage of Population Employed in Sales & Related in Henderson, NV with 12.7%.
What is the Percentage of Population Employed in Sales & Related in Henderson, NV?
Percentage of Population Employed in Sales & Related in Henderson is 11.8%.
What is the Percentage of Population Employed in Sales & Related in Nevada?
Percentage of Population Employed in Sales & Related in Nevada is 10.4%.
What is the Percentage of Population Employed in Sales & Related in the United States?
Percentage of Population Employed in Sales & Related in the United States is 9.6%.