Zip Codes with the Highest Percentage of Population Employed in Accommodation & Food Services in Henderson, NV
RELATED REPORTS & OPTIONS
Accommodation & Food Services
Henderson
Compare Zip Codes
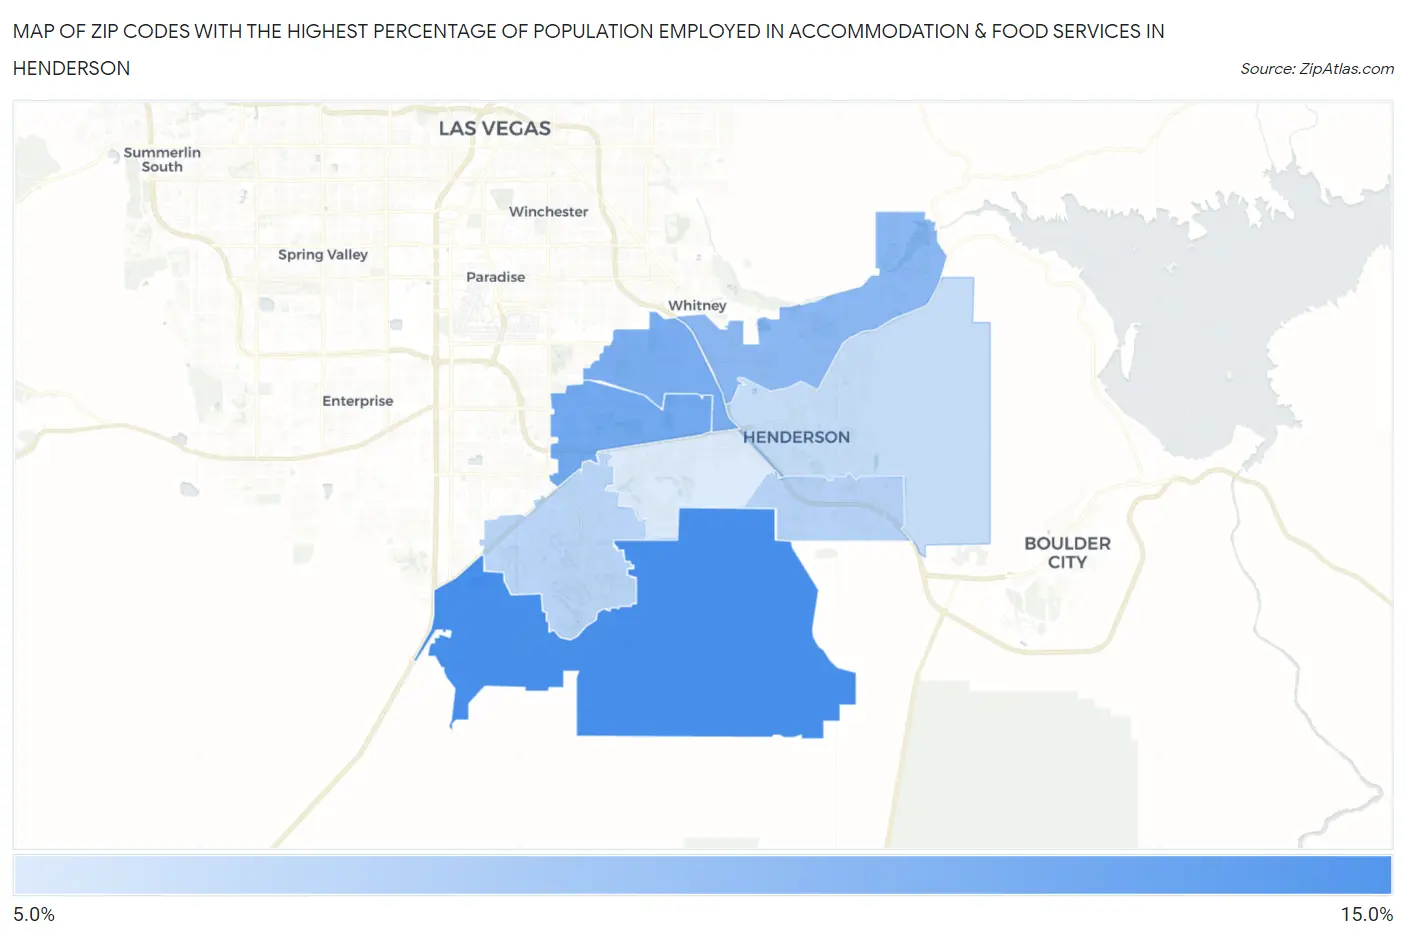
Map of Zip Codes with the Highest Percentage of Population Employed in Accommodation & Food Services in Henderson
8.4%
14.2%
Zip Codes with the Highest Percentage of Population Employed in Accommodation & Food Services in Henderson, NV
| Zip Code | % Employed | vs State | vs National | |
| 1. | 89044 | 14.2% | 13.3%(+0.890)#43 | 6.9%(+7.28)#1,915 |
| 2. | 89074 | 12.5% | 13.3%(-0.797)#54 | 6.9%(+5.59)#2,607 |
| 3. | 89014 | 12.1% | 13.3%(-1.12)#55 | 6.9%(+5.27)#2,752 |
| 4. | 89011 | 11.6% | 13.3%(-1.66)#58 | 6.9%(+4.73)#3,086 |
| 5. | 89002 | 9.9% | 13.3%(-3.37)#75 | 6.9%(+3.02)#4,665 |
| 6. | 89052 | 9.8% | 13.3%(-3.50)#77 | 6.9%(+2.88)#4,838 |
| 7. | 89015 | 9.3% | 13.3%(-3.92)#82 | 6.9%(+2.46)#5,434 |
| 8. | 89012 | 8.4% | 13.3%(-4.82)#88 | 6.9%(+1.56)#6,918 |
1
Common Questions
What are the Top 5 Zip Codes with the Highest Percentage of Population Employed in Accommodation & Food Services in Henderson, NV?
Top 5 Zip Codes with the Highest Percentage of Population Employed in Accommodation & Food Services in Henderson, NV are:
What zip code has the Highest Percentage of Population Employed in Accommodation & Food Services in Henderson, NV?
89044 has the Highest Percentage of Population Employed in Accommodation & Food Services in Henderson, NV with 14.2%.
What is the Percentage of Population Employed in Accommodation & Food Services in Henderson, NV?
Percentage of Population Employed in Accommodation & Food Services in Henderson is 10.6%.
What is the Percentage of Population Employed in Accommodation & Food Services in Nevada?
Percentage of Population Employed in Accommodation & Food Services in Nevada is 13.3%.
What is the Percentage of Population Employed in Accommodation & Food Services in the United States?
Percentage of Population Employed in Accommodation & Food Services in the United States is 6.9%.