Zip Codes with the Highest Percentage of Households Heated by Bottled Gas / Liquid Propane in Roswell, NM
RELATED REPORTS & OPTIONS
Bottled Gas / LP Heating
Roswell
Compare Zip Codes
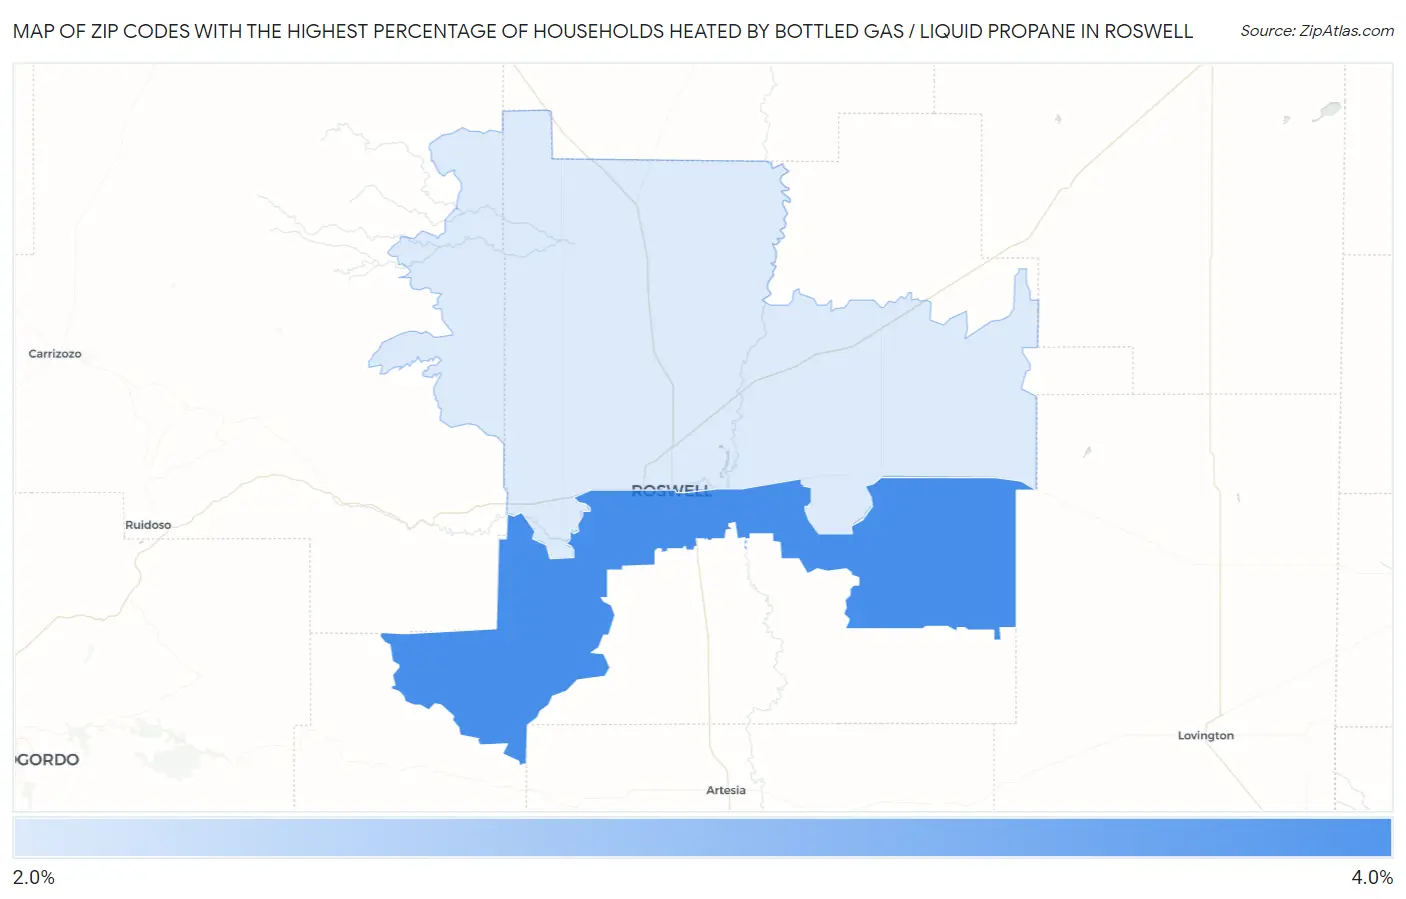
Map of Zip Codes with the Highest Percentage of Households Heated by Bottled Gas / Liquid Propane in Roswell
2.1%
3.9%
Zip Codes with the Highest Percentage of Households Heated by Bottled Gas / Liquid Propane in Roswell, NM
| Zip Code | Bottled Gas / LP Heating | vs State | vs National | |
| 1. | 88203 | 3.9% | 6.8%(-2.90)#251 | 4.9%(-1.00)#19,727 |
| 2. | 88201 | 2.1% | 6.8%(-4.70)#282 | 4.9%(-2.80)#22,901 |
1
Common Questions
What are the Top Zip Codes with the Highest Percentage of Households Heated by Bottled Gas / Liquid Propane in Roswell, NM?
Top Zip Codes with the Highest Percentage of Households Heated by Bottled Gas / Liquid Propane in Roswell, NM are:
What zip code has the Highest Percentage of Households Heated by Bottled Gas / Liquid Propane in Roswell, NM?
88203 has the Highest Percentage of Households Heated by Bottled Gas / Liquid Propane in Roswell, NM with 3.9%.
What is the Percentage of Households Heated by Bottled Gas / Liquid Propane in Roswell, NM?
Percentage of Households Heated by Bottled Gas / Liquid Propane in Roswell is 1.5%.
What is the Percentage of Households Heated by Bottled Gas / Liquid Propane in New Mexico?
Percentage of Households Heated by Bottled Gas / Liquid Propane in New Mexico is 6.8%.
What is the Percentage of Households Heated by Bottled Gas / Liquid Propane in the United States?
Percentage of Households Heated by Bottled Gas / Liquid Propane in the United States is 4.9%.