Zip Codes with the Highest Percentage of Population Employed in Legal Services & Support in Roswell, NM
RELATED REPORTS & OPTIONS
Legal Services & Support
Roswell
Compare Zip Codes
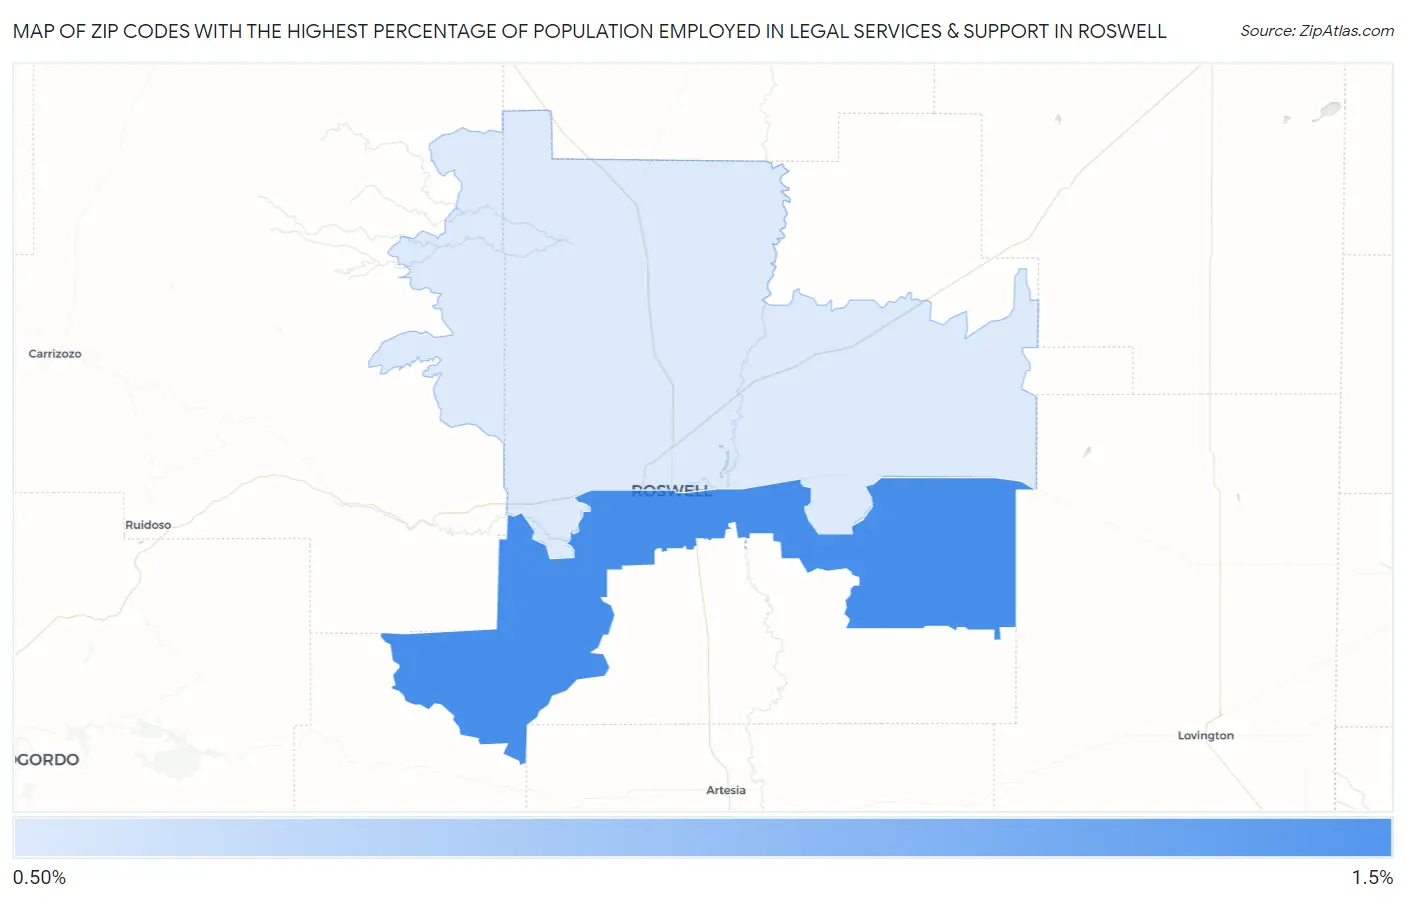
Map of Zip Codes with the Highest Percentage of Population Employed in Legal Services & Support in Roswell
1.1%
1.1%
Zip Codes with the Highest Percentage of Population Employed in Legal Services & Support in Roswell, NM
| Zip Code | % Employed | vs State | vs National | |
| 1. | 88203 | 1.1% | 1.3%(-0.162)#59 | 1.2%(-0.036)#6,830 |
| 2. | 88201 | 1.1% | 1.3%(-0.258)#67 | 1.2%(-0.131)#7,474 |
1
Common Questions
What are the Top Zip Codes with the Highest Percentage of Population Employed in Legal Services & Support in Roswell, NM?
Top Zip Codes with the Highest Percentage of Population Employed in Legal Services & Support in Roswell, NM are:
What zip code has the Highest Percentage of Population Employed in Legal Services & Support in Roswell, NM?
88203 has the Highest Percentage of Population Employed in Legal Services & Support in Roswell, NM with 1.1%.
What is the Percentage of Population Employed in Legal Services & Support in Roswell, NM?
Percentage of Population Employed in Legal Services & Support in Roswell is 1.1%.
What is the Percentage of Population Employed in Legal Services & Support in New Mexico?
Percentage of Population Employed in Legal Services & Support in New Mexico is 1.3%.
What is the Percentage of Population Employed in Legal Services & Support in the United States?
Percentage of Population Employed in Legal Services & Support in the United States is 1.2%.