Zip Codes with the Highest Percentage of Population with a Degree in Liberal Arts and History in Roswell, NM
RELATED REPORTS & OPTIONS
Liberal Arts and History
Roswell
Compare Zip Codes
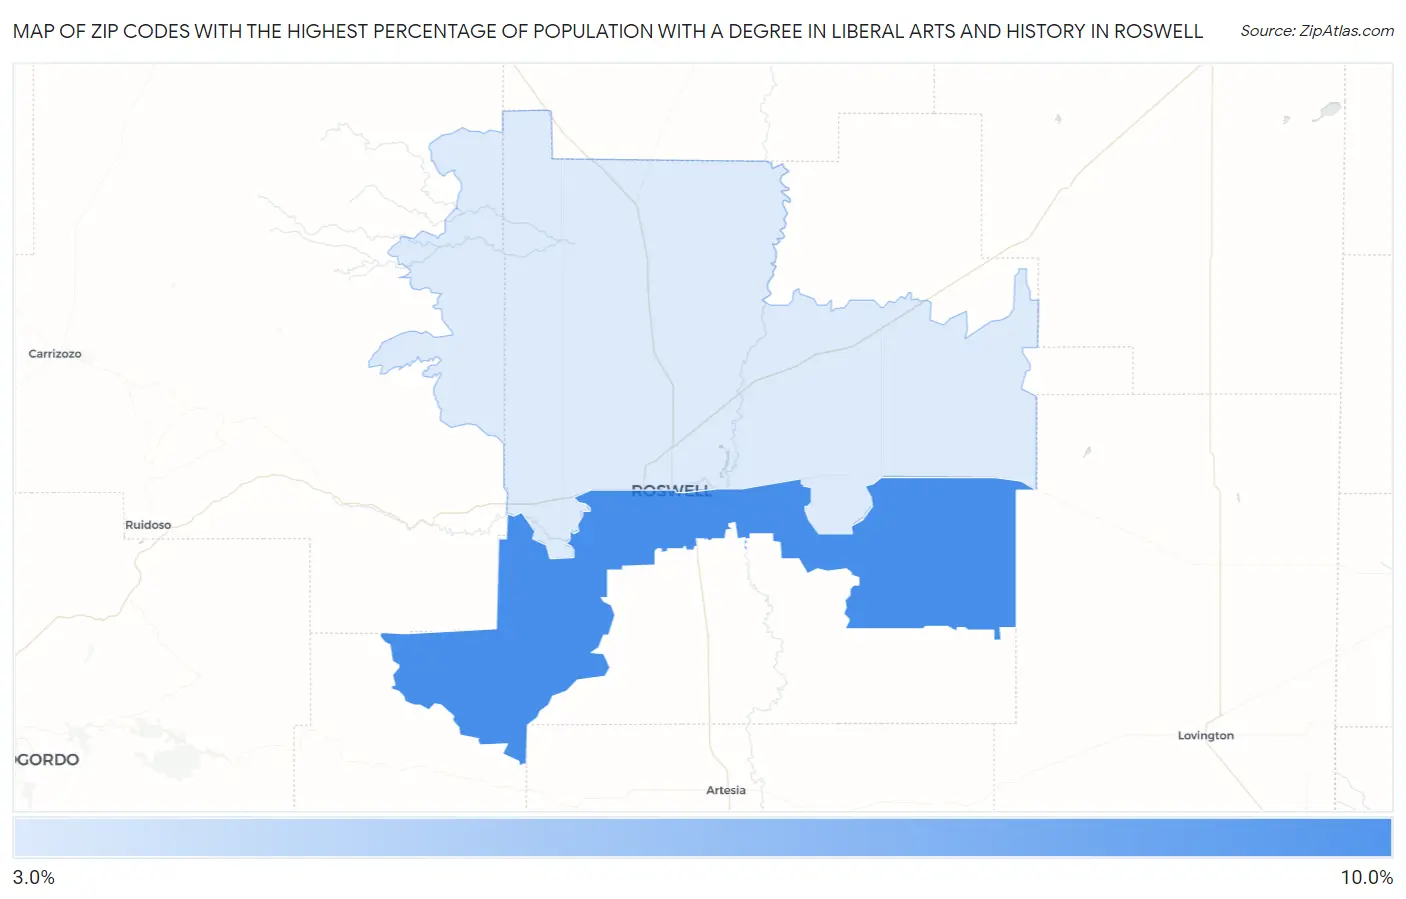
Map of Zip Codes with the Highest Percentage of Population with a Degree in Liberal Arts and History in Roswell
3.7%
9.6%
Zip Codes with the Highest Percentage of Population with a Degree in Liberal Arts and History in Roswell, NM
| Zip Code | % Graduates | vs State | vs National | |
| 1. | 88203 | 9.6% | 5.5%(+4.18)#38 | 4.9%(+4.76)#3,347 |
| 2. | 88201 | 3.7% | 5.5%(-1.76)#127 | 4.9%(-1.17)#15,914 |
1
Common Questions
What are the Top Zip Codes with the Highest Percentage of Population with a Degree in Liberal Arts and History in Roswell, NM?
Top Zip Codes with the Highest Percentage of Population with a Degree in Liberal Arts and History in Roswell, NM are:
What zip code has the Highest Percentage of Population with a Degree in Liberal Arts and History in Roswell, NM?
88203 has the Highest Percentage of Population with a Degree in Liberal Arts and History in Roswell, NM with 9.6%.
What is the Percentage of Population with a Degree in Liberal Arts and History in Roswell, NM?
Percentage of Population with a Degree in Liberal Arts and History in Roswell is 6.1%.
What is the Percentage of Population with a Degree in Liberal Arts and History in New Mexico?
Percentage of Population with a Degree in Liberal Arts and History in New Mexico is 5.5%.
What is the Percentage of Population with a Degree in Liberal Arts and History in the United States?
Percentage of Population with a Degree in Liberal Arts and History in the United States is 4.9%.