Zip Codes with the Highest Percentage of Self-Employed / Not Incorporated in Roswell, NM
RELATED REPORTS & OPTIONS
Self-Employed / Not Incorporated
Roswell
Compare Zip Codes
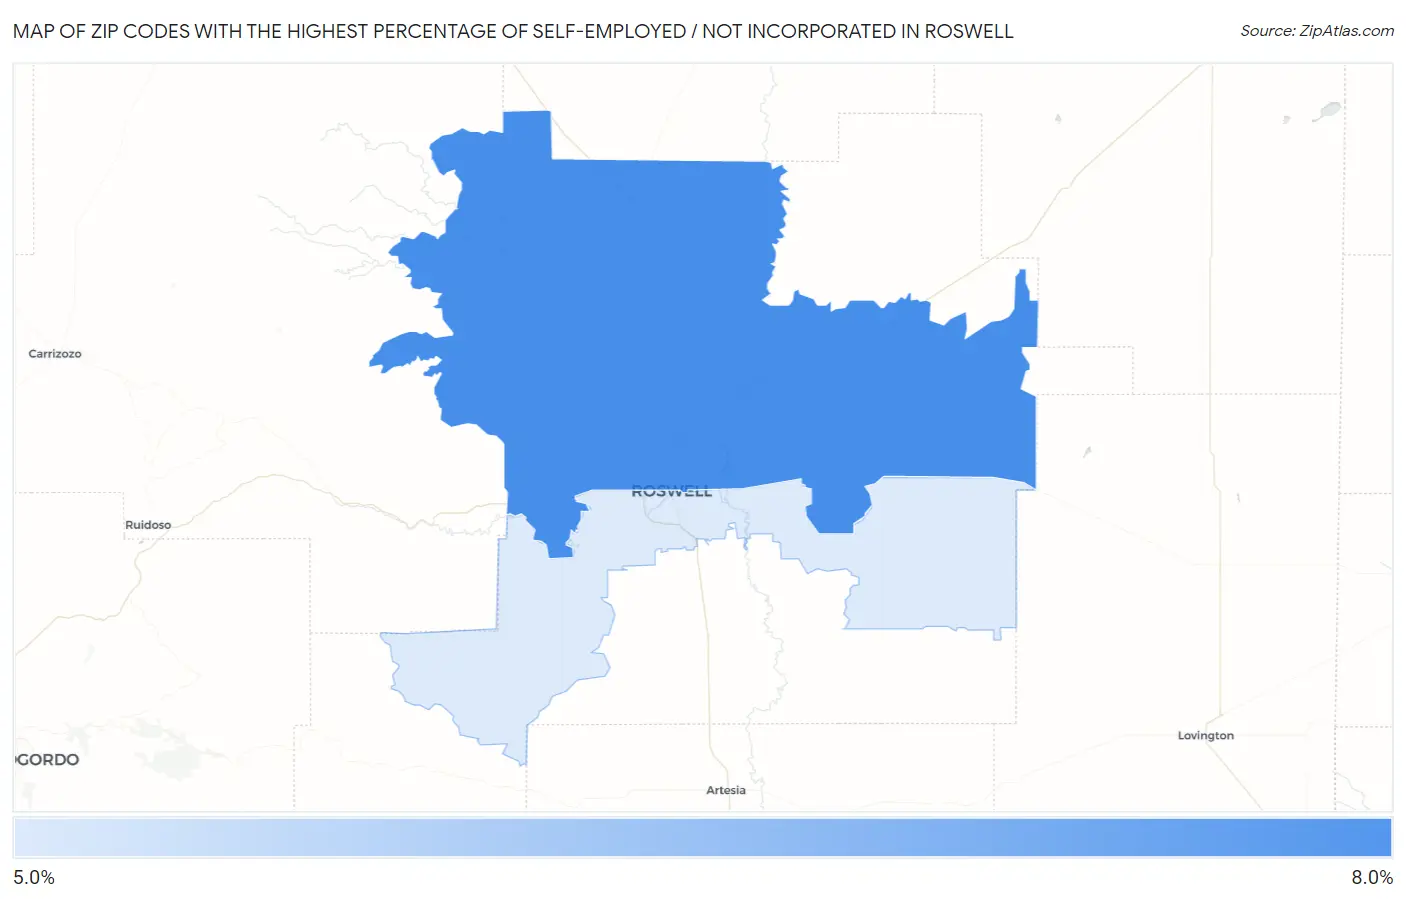
Map of Zip Codes with the Highest Percentage of Self-Employed / Not Incorporated in Roswell
0.0%
8.0%
Zip Codes with the Highest Percentage of Self-Employed / Not Incorporated in Roswell, NM
| Zip Code | % Self-Employed / Not Incorporated | vs State | vs National | |
| 1. | 88201 | 6.6% | 6.4%(+0.159)#158 | 5.8%(+0.783)#14,137 |
| 2. | 88203 | 5.8% | 6.4%(-0.667)#175 | 5.8%(-0.042)#16,786 |
1
Common Questions
What are the Top Zip Codes with the Highest Percentage of Self-Employed / Not Incorporated in Roswell, NM?
Top Zip Codes with the Highest Percentage of Self-Employed / Not Incorporated in Roswell, NM are:
What zip code has the Highest Percentage of Self-Employed / Not Incorporated in Roswell, NM?
88201 has the Highest Percentage of Self-Employed / Not Incorporated in Roswell, NM with 6.6%.
What is the Percentage of Self-Employed / Not Incorporated in Roswell, NM?
Percentage of Self-Employed / Not Incorporated in Roswell is 6.0%.
What is the Percentage of Self-Employed / Not Incorporated in New Mexico?
Percentage of Self-Employed / Not Incorporated in New Mexico is 6.4%.
What is the Percentage of Self-Employed / Not Incorporated in the United States?
Percentage of Self-Employed / Not Incorporated in the United States is 5.8%.