Zip Codes with the Highest Percentage of Population with a Degree in Visual and Performing Arts in Roswell, NM
RELATED REPORTS & OPTIONS
Visual and Performing Arts
Roswell
Compare Zip Codes
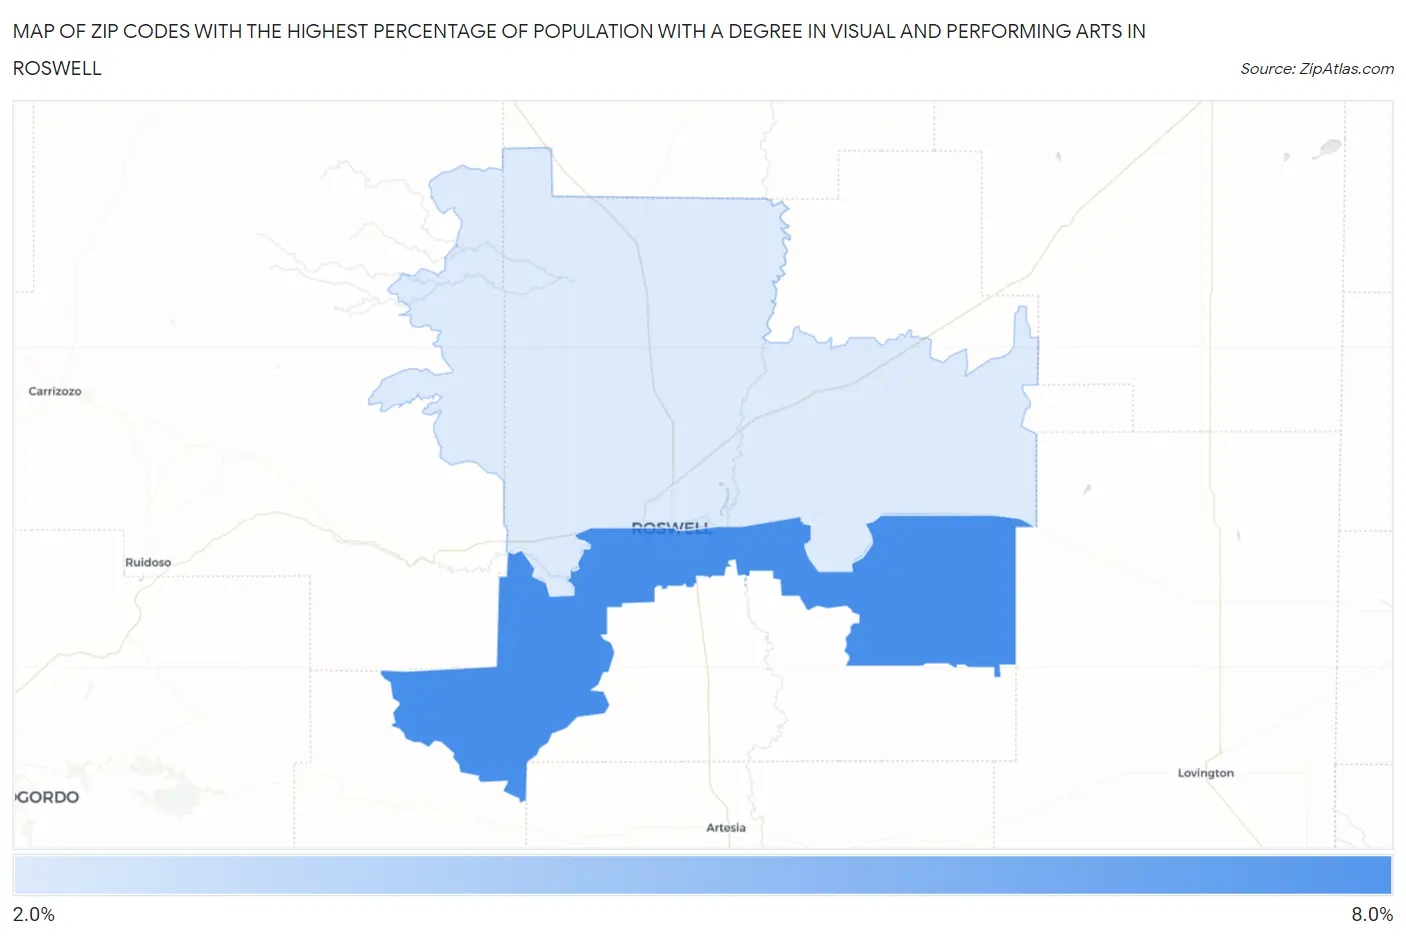
Map of Zip Codes with the Highest Percentage of Population with a Degree in Visual and Performing Arts in Roswell
2.8%
7.8%
Zip Codes with the Highest Percentage of Population with a Degree in Visual and Performing Arts in Roswell, NM
| Zip Code | % Graduates | vs State | vs National | |
| 1. | 88203 | 7.8% | 4.8%(+3.09)#38 | 4.3%(+3.58)#2,960 |
| 2. | 88201 | 2.8% | 4.8%(-1.90)#109 | 4.3%(-1.40)#13,307 |
1
Common Questions
What are the Top Zip Codes with the Highest Percentage of Population with a Degree in Visual and Performing Arts in Roswell, NM?
Top Zip Codes with the Highest Percentage of Population with a Degree in Visual and Performing Arts in Roswell, NM are:
What zip code has the Highest Percentage of Population with a Degree in Visual and Performing Arts in Roswell, NM?
88203 has the Highest Percentage of Population with a Degree in Visual and Performing Arts in Roswell, NM with 7.8%.
What is the Percentage of Population with a Degree in Visual and Performing Arts in Roswell, NM?
Percentage of Population with a Degree in Visual and Performing Arts in Roswell is 5.0%.
What is the Percentage of Population with a Degree in Visual and Performing Arts in New Mexico?
Percentage of Population with a Degree in Visual and Performing Arts in New Mexico is 4.8%.
What is the Percentage of Population with a Degree in Visual and Performing Arts in the United States?
Percentage of Population with a Degree in Visual and Performing Arts in the United States is 4.3%.