Zip Codes with the Fewest Births per 1,000 Teenage Women Under the Age of 20 in Mississippi

RELATED REPORTS & OPTIONS

Lowest Birth Rate | Women 15-19
Population
Families and Households
Female Fertility
Female Fertility (Unmarried)
Race (Community Size)
Race (Percentage)
Ancestry (Community Size)
AfghanAfricanAlaska NativeAlaskan AthabascanAlbanianAleutAlsatianAmericanApacheArabArapahoArgentineanArmenianAssyrian / Chaldean / SyriacAustralianAustrianBahamianBangladeshiBarbadianBasqueBelgianBelizeanBermudanBhutaneseBlackfeetBolivianBrazilianBritishBritish West IndianBulgarianBurmeseCajunCambodianCanadianCape VerdeanCarpatho RusynCelticCentral AmericanCentral American IndianCherokeeCheyenneChickasawChileanChineseChippewaChoctawColombianColvilleComancheCosta RicanCreeCreekCroatianCrowCubanCypriotCzechCzechoslovakianDanishDelawareDominicanDutchDutch West IndianEastern EuropeanEcuadorianEgyptianEnglishEstonianEthiopianEuropeanFijianFilipinoFinnishFrenchFrench American IndianFrench CanadianGermanGerman RussianGhanaianGreekGuamanian / ChamorroGuatemalanGuyaneseHaitianHmongHonduranHopiHoumaHungarianIcelanderIndian (Asian)IndonesianInupiatIranianIraqiIrishIroquoisIsraeliItalianJamaicanJapaneseJordanianKenyanKiowaKoreanLaotianLatvianLebaneseLiberianLithuanianLumbeeLuxembourgerMacedonianMalaysianMalteseMarshalleseMenomineeMexicanMexican American IndianMongolianMoroccanNative HawaiianNavajoNepaleseNew ZealanderNicaraguanNigerianNorthern EuropeanNorwegianOkinawanOsageOttawaPaiutePakistaniPalestinianPanamanianParaguayanPennsylvania GermanPeruvianPimaPolishPortuguesePotawatomiPuebloPuerto RicanPuget Sound SalishRomanianRussianSalvadoranSamoanScandinavianScotch-IrishScottishSeminoleSenegaleseSerbianShoshoneSierra LeoneanSiouxSlavicSlovakSloveneSomaliSouth AfricanSouth AmericanSouth American IndianSoviet UnionSpaniardSpanishSpanish AmericanSpanish American IndianSri LankanSubsaharan AfricanSudaneseSwedishSwissSyrianTaiwaneseThaiTlingit-HaidaTohono O'OdhamTonganTrinidadian and TobagonianTsimshianTurkishU.S. Virgin IslanderUgandanUkrainianUruguayanUteVenezuelanVietnameseWelshWest IndianYakamaYaquiYugoslavianYumanYup'ikZimbabwean
Ancestry (Percentage)
AfghanAfricanAlaska NativeAlaskan AthabascanAlbanianAleutAlsatianAmericanApacheArabArapahoArgentineanArmenianAssyrian / Chaldean / SyriacAustralianAustrianBahamianBangladeshiBarbadianBasqueBelgianBelizeanBermudanBhutaneseBlackfeetBolivianBrazilianBritishBritish West IndianBulgarianBurmeseCajunCambodianCanadianCape VerdeanCarpatho RusynCelticCentral AmericanCentral American IndianCherokeeCheyenneChickasawChileanChineseChippewaChoctawColombianColvilleComancheCosta RicanCreeCreekCroatianCrowCubanCypriotCzechCzechoslovakianDanishDelawareDominicanDutchDutch West IndianEastern EuropeanEcuadorianEgyptianEnglishEstonianEthiopianEuropeanFijianFilipinoFinnishFrenchFrench American IndianFrench CanadianGermanGerman RussianGhanaianGreekGuamanian / ChamorroGuatemalanGuyaneseHaitianHmongHonduranHopiHoumaHungarianIcelanderIndian (Asian)IndonesianInupiatIranianIraqiIrishIroquoisIsraeliItalianJamaicanJapaneseJordanianKenyanKiowaKoreanLaotianLatvianLebaneseLiberianLithuanianLumbeeLuxembourgerMacedonianMalaysianMalteseMarshalleseMenomineeMexicanMexican American IndianMongolianMoroccanNative HawaiianNavajoNepaleseNew ZealanderNicaraguanNigerianNorthern EuropeanNorwegianOkinawanOsageOttawaPaiutePakistaniPalestinianPanamanianParaguayanPennsylvania GermanPeruvianPimaPolishPortuguesePotawatomiPuebloPuerto RicanPuget Sound SalishRomanianRussianSalvadoranSamoanScandinavianScotch-IrishScottishSeminoleSenegaleseSerbianShoshoneSierra LeoneanSiouxSlavicSlovakSloveneSomaliSouth AfricanSouth AmericanSouth American IndianSoviet UnionSpaniardSpanishSpanish AmericanSpanish American IndianSri LankanSubsaharan AfricanSudaneseSwedishSwissSyrianTaiwaneseThaiTlingit-HaidaTohono O'OdhamTonganTrinidadian and TobagonianTsimshianTurkishU.S. Virgin IslanderUgandanUkrainianUruguayanUteVenezuelanVietnameseWelshWest IndianYakamaYaquiYugoslavianYumanYup'ikZimbabwean
Immigrant Origin (Total)
AfghanistanAfricaAlbaniaArgentinaArmeniaAsiaAustraliaAustriaAzoresBahamasBangladeshBarbadosBelarusBelgiumBelizeBoliviaBosnia and HerzegovinaBrazilBulgariaBurma / MyanmarCabo VerdeCambodiaCameroonCanadaCaribbeanCentral AmericaChileChinaColombiaCongoCosta RicaCroatiaCubaCzechoslovakiaDenmarkDominicaDominican RepublicEastern AfricaEastern AsiaEastern EuropeEcuadorEgyptEl SalvadorEnglandEritreaEthiopiaEuropeFijiFranceGermanyGhanaGreeceGrenadaGuatemalaGuyanaHaitiHondurasHong KongHungaryIndiaIndonesiaIranIraqIrelandIsraelItalyJamaicaJapanJordanKazakhstanKenyaKoreaKuwaitLaosLatin AmericaLatviaLebanonLiberiaLithuaniaMalaysiaMexicoMicronesiaMiddle AfricaMoldovaMoroccoNepalNetherlandsNicaraguaNigeriaNorth MacedoniaNorthern AfricaNorthern EuropeNorwayOceaniaPakistanPanamaPeruPhilippinesPolandPortugalRomaniaRussiaSaudi ArabiaScotlandSenegalSerbiaSierra LeoneSingaporeSomaliaSouth AfricaSouth AmericaSouth Central AsiaSouth Eastern AsiaSouthern EuropeSpainSri LankaSt. Vincent and the GrenadinesSudanSwedenSwitzerlandSyriaTaiwanThailandTrinidad and TobagoTurkeyUgandaUkraineUruguayUzbekistanVenezuelaVietnamWest IndiesWestern AfricaWestern AsiaWestern EuropeYemenZaireZimbabwe
Immigrant Origin (Percentage)
AfghanistanAfricaAlbaniaArgentinaArmeniaAsiaAustraliaAustriaAzoresBahamasBangladeshBarbadosBelarusBelgiumBelizeBoliviaBosnia and HerzegovinaBrazilBulgariaBurma / MyanmarCabo VerdeCambodiaCameroonCanadaCaribbeanCentral AmericaChileChinaColombiaCongoCosta RicaCroatiaCubaCzechoslovakiaDenmarkDominicaDominican RepublicEastern AfricaEastern AsiaEastern EuropeEcuadorEgyptEl SalvadorEnglandEritreaEthiopiaEuropeFijiFranceGermanyGhanaGreeceGrenadaGuatemalaGuyanaHaitiHondurasHong KongHungaryIndiaIndonesiaIranIraqIrelandIsraelItalyJamaicaJapanJordanKazakhstanKenyaKoreaKuwaitLaosLatin AmericaLatviaLebanonLiberiaLithuaniaMalaysiaMexicoMicronesiaMiddle AfricaMoldovaMoroccoNepalNetherlandsNicaraguaNigeriaNorth MacedoniaNorthern AfricaNorthern EuropeNorwayOceaniaPakistanPanamaPeruPhilippinesPolandPortugalRomaniaRussiaSaudi ArabiaScotlandSenegalSerbiaSierra LeoneSingaporeSomaliaSouth AfricaSouth AmericaSouth Central AsiaSouth Eastern AsiaSouthern EuropeSpainSri LankaSt. Vincent and the GrenadinesSudanSwedenSwitzerlandSyriaTaiwanThailandTrinidad and TobagoTurkeyUgandaUkraineUruguayUzbekistanVenezuelaVietnamWest IndiesWestern AfricaWestern AsiaWestern EuropeYemenZaireZimbabwe
Income
Income (Families)
Income (Households)
Poverty
Poverty (Families)
Unemployment
Employment Occupations
Employment Industries
Employer Class
Commute Time
Commute Means
School Enrollment
Education by Degree Field
Occupancy
Finances
Physical Characteristics
Mississippi
Compare Zip Codes
Comparison Subject

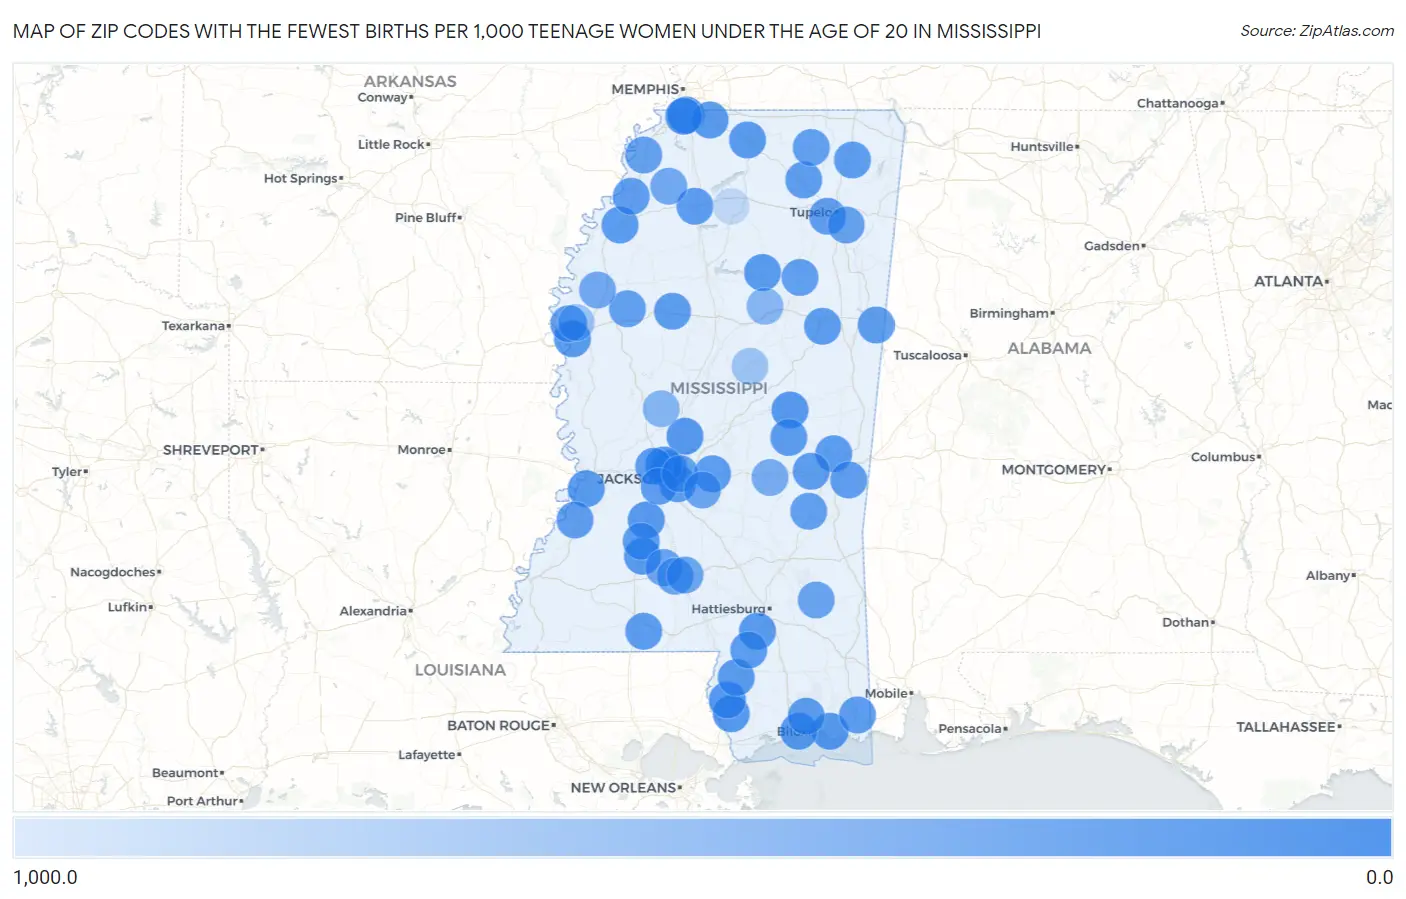
Map of Zip Codes with the Fewest Births per 1,000 Teenage Women Under the Age of 20 in Mississippi

1,000.0
0.0
Zip Codes with the Fewest Births per 1,000 Teenage Women Under the Age of 20 in Mississippi Map

Zip Codes with the Fewest Births per 1,000 Teenage Women Under the Age of 20 in Mississippi

Zip Code Births / 1,000 Women vs State vs National
1.392062.015.0(-13.0)#110.0(-8.00)#76
2.394663.015.0(-12.0)#210.0(-7.00)#128
3.390465.015.0(-10.00)#310.0(-5.00)#277
4.391915.015.0(-10.00)#410.0(-5.00)#295
5.395646.015.0(-9.00)#510.0(-4.00)#323
6.386717.015.0(-8.00)#610.0(-3.00)#405
7.390598.015.0(-7.00)#710.0(-2.00)#500
8.395079.015.0(-6.00)#810.0(-1.000)#577
9.3935010.015.0(-5.00)#910.0(=0.000)#637
10.3942610.015.0(-5.00)#1010.0(=0.000)#649
11.3870111.015.0(-4.00)#1110.0(+1.000)#703
12.3947011.015.0(-4.00)#1210.0(+1.000)#714
13.3920813.015.0(-2.00)#1310.0(+3.00)#830
14.3865414.015.0(-1.000)#1410.0(+4.00)#885
15.3921319.015.0(+4.00)#1510.0(+9.00)#1,244
16.3891619.015.0(+4.00)#1610.0(+9.00)#1,265
17.3918021.015.0(+6.00)#1710.0(+11.0)#1,356
18.3863525.015.0(+10.00)#1810.0(+15.0)#1,608
19.3947526.015.0(+11.0)#1910.0(+16.0)#1,658
20.3863728.015.0(+13.0)#2010.0(+18.0)#1,729
21.3975933.015.0(+18.0)#2110.0(+23.0)#1,956
22.3861435.015.0(+20.0)#2210.0(+25.0)#2,038
23.3956236.015.0(+21.0)#2310.0(+26.0)#2,072
24.3953237.015.0(+22.0)#2410.0(+27.0)#2,095
25.3964837.015.0(+22.0)#2510.0(+27.0)#2,116
26.3860637.015.0(+22.0)#2610.0(+27.0)#2,119
27.3870337.015.0(+22.0)#2710.0(+27.0)#2,124
28.3914539.015.0(+24.0)#2810.0(+29.0)#2,187
29.3882940.015.0(+25.0)#2910.0(+30.0)#2,207
30.3936541.015.0(+26.0)#3010.0(+31.0)#2,244
31.3920943.015.0(+28.0)#3110.0(+33.0)#2,301
32.3930543.015.0(+28.0)#3210.0(+33.0)#2,307
33.3945544.015.0(+29.0)#3310.0(+34.0)#2,343
34.3908352.015.0(+37.0)#3410.0(+42.0)#2,541
35.3893056.015.0(+41.0)#3510.0(+46.0)#2,629
36.3932359.015.0(+44.0)#3610.0(+49.0)#2,703
37.3970261.015.0(+46.0)#3710.0(+51.0)#2,731
38.3865262.015.0(+47.0)#3810.0(+52.0)#2,757
39.3915067.015.0(+52.0)#3910.0(+57.0)#2,851
40.3861768.015.0(+53.0)#4010.0(+58.0)#2,874
41.3921276.015.0(+61.0)#4110.0(+66.0)#2,968
42.3930178.015.0(+63.0)#4210.0(+68.0)#3,001
43.3880180.015.0(+65.0)#4310.0(+70.0)#3,026
44.3977683.015.0(+68.0)#4410.0(+73.0)#3,078
45.3877886.015.0(+71.0)#4510.0(+76.0)#3,112
46.3934788.015.0(+73.0)#4610.0(+78.0)#3,129
47.3866396.015.0(+81.0)#4710.0(+86.0)#3,216
48.38676126.015.0(+111)#4810.0(+116)#3,428
49.38862130.015.0(+115)#4910.0(+120)#3,443
50.39665147.015.0(+132)#5010.0(+137)#3,526
51.39476148.015.0(+133)#5110.0(+138)#3,528
52.39232156.015.0(+141)#5210.0(+146)#3,558
53.39654162.015.0(+147)#5310.0(+152)#3,580
54.39042163.015.0(+148)#5410.0(+153)#3,584
55.39663172.015.0(+157)#5510.0(+162)#3,608
56.38621206.015.0(+191)#5610.0(+196)#3,694
57.38730221.015.0(+206)#5710.0(+211)#3,722
58.39336265.015.0(+250)#5810.0(+255)#3,790
59.39039385.015.0(+370)#5910.0(+375)#3,866
60.39744399.015.0(+384)#6010.0(+389)#3,872
61.39067582.015.0(+567)#6110.0(+572)#3,929
62.38760584.015.0(+569)#6210.0(+574)#3,930
63.38673878.015.0(+863)#6310.0(+868)#3,964

Common Questions

What are the Top 10 Zip Codes with the Fewest Births per 1,000 Teenage Women Under the Age of 20 in Mississippi?
Top 10 Zip Codes with the Fewest Births per 1,000 Teenage Women Under the Age of 20 in Mississippi are:
#1
0.0
#2
0.0
#3
0.0
#4
0.0
#5
0.0
#6
0.0
#7
0.0
#8
0.0
#9
0.0
#10
0.0
What zip code has the Fewest Births per 1,000 Teenage Women Under the Age of 20 in Mississippi?
39206 has the Fewest Births per 1,000 Teenage Women Under the Age of 20 in Mississippi with 2.0.
What is the Number of Births per 1,000 Teenage Women Under the Age of 20 in the State of Mississippi?
Number of Births per 1,000 Teenage Women Under the Age of 20 in Mississippi is 15.0.
What is the Number of Births per 1,000 Teenage Women Under the Age of 20 in the United States?
Number of Births per 1,000 Teenage Women Under the Age of 20 in the United States is 10.0.