Zip Codes with the Highest Percentage of Population Employed in Firefighting & Prevention in Missouri
RELATED REPORTS & OPTIONS
Firefighting & Prevention
Missouri
Compare Zip Codes
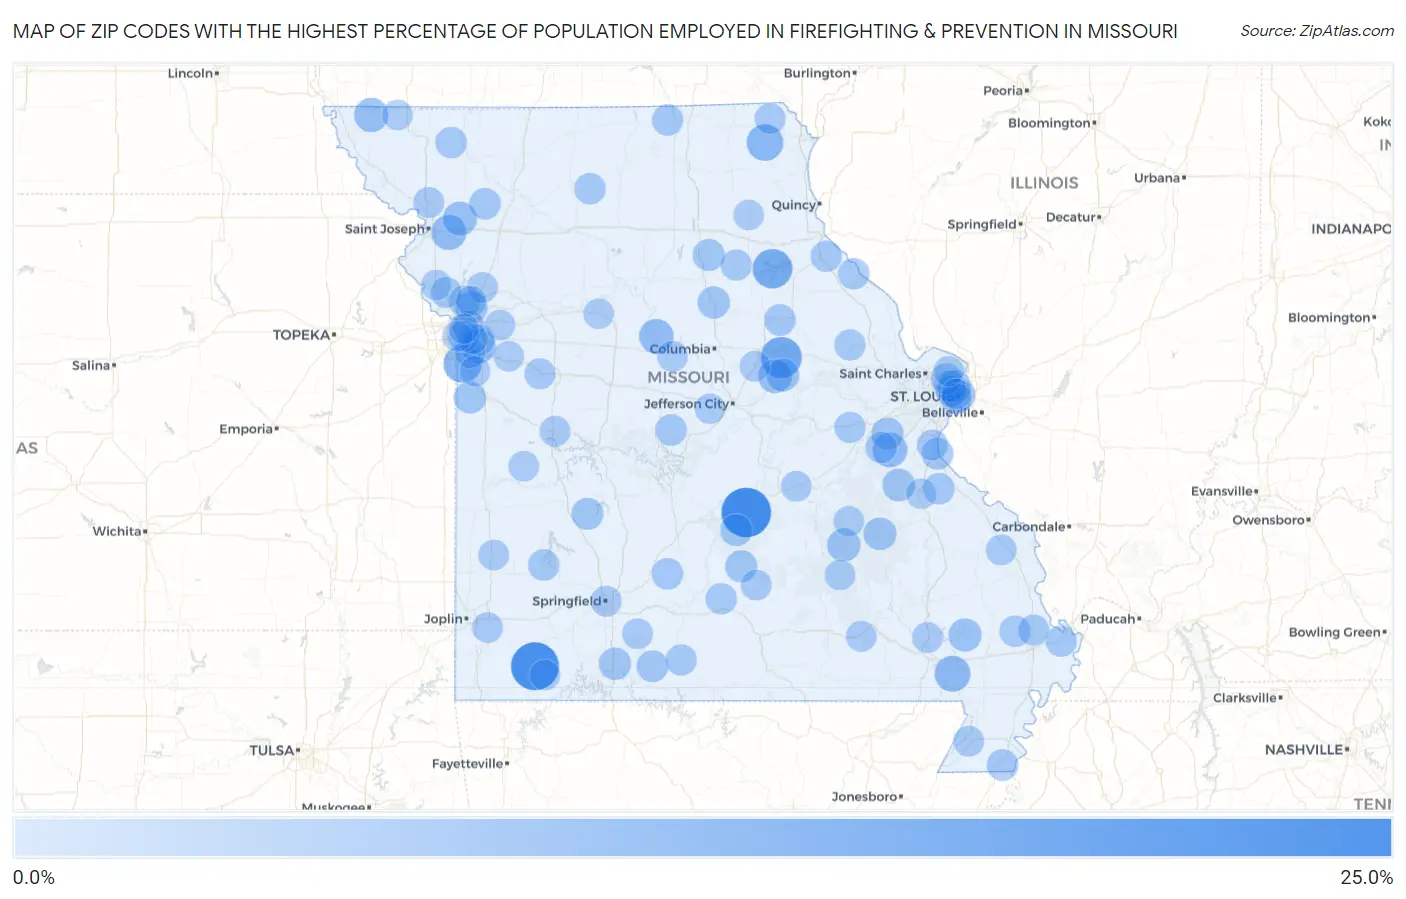
Map of Zip Codes with the Highest Percentage of Population Employed in Firefighting & Prevention in Missouri
0.0%
25.0%
Zip Codes with the Highest Percentage of Population Employed in Firefighting & Prevention in Missouri
| Zip Code | % Employed | vs State | vs National | |
| 1. | 65457 | 24.1% | 0.95%(+23.2)#1 | 1.2%(+23.0)#66 |
| 2. | 65623 | 22.2% | 0.95%(+21.3)#2 | 1.2%(+21.0)#83 |
| 3. | 63388 | 14.1% | 0.95%(+13.2)#3 | 1.2%(+13.0)#175 |
| 4. | 65283 | 12.4% | 0.95%(+11.5)#4 | 1.2%(+11.2)#214 |
| 5. | 64147 | 10.6% | 0.95%(+9.64)#5 | 1.2%(+9.40)#275 |
| 6. | 63474 | 9.1% | 0.95%(+8.14)#6 | 1.2%(+7.91)#339 |
| 7. | 63932 | 8.2% | 0.95%(+7.24)#7 | 1.2%(+7.01)#393 |
| 8. | 64443 | 7.2% | 0.95%(+6.24)#8 | 1.2%(+6.01)#485 |
| 9. | 63041 | 6.9% | 0.95%(+5.94)#9 | 1.2%(+5.71)#527 |
| 10. | 64139 | 6.8% | 0.95%(+5.83)#10 | 1.2%(+5.60)#541 |
| 11. | 65250 | 6.7% | 0.95%(+5.75)#11 | 1.2%(+5.52)#556 |
| 12. | 64498 | 6.2% | 0.95%(+5.22)#12 | 1.2%(+4.99)#649 |
| 13. | 64430 | 6.2% | 0.95%(+5.21)#13 | 1.2%(+4.98)#652 |
| 14. | 65077 | 5.8% | 0.95%(+4.84)#14 | 1.2%(+4.60)#710 |
| 15. | 63102 | 5.3% | 0.95%(+4.30)#15 | 1.2%(+4.07)#817 |
| 16. | 65440 | 5.2% | 0.95%(+4.28)#16 | 1.2%(+4.05)#821 |
| 17. | 65067 | 5.0% | 0.95%(+4.09)#17 | 1.2%(+3.85)#895 |
| 18. | 63960 | 5.0% | 0.95%(+4.07)#18 | 1.2%(+3.83)#903 |
| 19. | 63623 | 4.7% | 0.95%(+3.71)#19 | 1.2%(+3.48)#1,039 |
| 20. | 63630 | 4.6% | 0.95%(+3.68)#20 | 1.2%(+3.45)#1,045 |
| 21. | 64158 | 4.5% | 0.95%(+3.56)#21 | 1.2%(+3.33)#1,096 |
| 22. | 63072 | 4.2% | 0.95%(+3.26)#22 | 1.2%(+3.03)#1,247 |
| 23. | 65243 | 4.2% | 0.95%(+3.24)#23 | 1.2%(+3.01)#1,261 |
| 24. | 65771 | 4.2% | 0.95%(+3.24)#24 | 1.2%(+3.00)#1,266 |
| 25. | 64746 | 3.9% | 0.95%(+2.98)#25 | 1.2%(+2.74)#1,394 |
| 26. | 65260 | 3.9% | 0.95%(+2.96)#26 | 1.2%(+2.73)#1,404 |
| 27. | 65473 | 3.9% | 0.95%(+2.95)#27 | 1.2%(+2.72)#1,406 |
| 28. | 63147 | 3.8% | 0.95%(+2.89)#28 | 1.2%(+2.66)#1,447 |
| 29. | 65570 | 3.8% | 0.95%(+2.86)#29 | 1.2%(+2.63)#1,463 |
| 30. | 65650 | 3.8% | 0.95%(+2.85)#30 | 1.2%(+2.62)#1,469 |
| 31. | 64125 | 3.7% | 0.95%(+2.70)#31 | 1.2%(+2.46)#1,597 |
| 32. | 63019 | 3.6% | 0.95%(+2.64)#32 | 1.2%(+2.40)#1,647 |
| 33. | 65614 | 3.5% | 0.95%(+2.57)#33 | 1.2%(+2.34)#1,702 |
| 34. | 64156 | 3.5% | 0.95%(+2.51)#34 | 1.2%(+2.28)#1,752 |
| 35. | 65232 | 3.3% | 0.95%(+2.38)#35 | 1.2%(+2.15)#1,873 |
| 36. | 64469 | 3.3% | 0.95%(+2.31)#36 | 1.2%(+2.08)#1,944 |
| 37. | 65661 | 3.2% | 0.95%(+2.30)#37 | 1.2%(+2.06)#1,958 |
| 38. | 65713 | 3.2% | 0.95%(+2.29)#38 | 1.2%(+2.05)#1,972 |
| 39. | 63060 | 3.2% | 0.95%(+2.25)#39 | 1.2%(+2.02)#2,017 |
| 40. | 63036 | 3.2% | 0.95%(+2.25)#40 | 1.2%(+2.02)#2,018 |
| 41. | 63120 | 3.2% | 0.95%(+2.24)#41 | 1.2%(+2.01)#2,032 |
| 42. | 63839 | 3.2% | 0.95%(+2.22)#42 | 1.2%(+1.99)#2,049 |
| 43. | 65011 | 3.1% | 0.95%(+2.16)#43 | 1.2%(+1.92)#2,126 |
| 44. | 63551 | 3.1% | 0.95%(+2.12)#44 | 1.2%(+1.89)#2,153 |
| 45. | 63353 | 3.1% | 0.95%(+2.10)#45 | 1.2%(+1.87)#2,175 |
| 46. | 64652 | 3.0% | 0.95%(+2.10)#46 | 1.2%(+1.86)#2,186 |
| 47. | 63784 | 3.0% | 0.95%(+2.08)#47 | 1.2%(+1.84)#2,208 |
| 48. | 64136 | 3.0% | 0.95%(+2.07)#48 | 1.2%(+1.83)#2,219 |
| 49. | 65711 | 3.0% | 0.95%(+2.03)#49 | 1.2%(+1.79)#2,270 |
| 50. | 64479 | 3.0% | 0.95%(+2.02)#50 | 1.2%(+1.79)#2,276 |
| 51. | 65755 | 2.9% | 0.95%(+1.95)#51 | 1.2%(+1.72)#2,373 |
| 52. | 63113 | 2.9% | 0.95%(+1.93)#52 | 1.2%(+1.70)#2,414 |
| 53. | 65258 | 2.8% | 0.95%(+1.89)#53 | 1.2%(+1.66)#2,475 |
| 54. | 64134 | 2.8% | 0.95%(+1.89)#54 | 1.2%(+1.65)#2,486 |
| 55. | 63459 | 2.8% | 0.95%(+1.87)#55 | 1.2%(+1.64)#2,524 |
| 56. | 63013 | 2.8% | 0.95%(+1.85)#56 | 1.2%(+1.62)#2,560 |
| 57. | 64130 | 2.8% | 0.95%(+1.84)#57 | 1.2%(+1.61)#2,588 |
| 58. | 63349 | 2.8% | 0.95%(+1.83)#58 | 1.2%(+1.60)#2,599 |
| 59. | 63834 | 2.7% | 0.95%(+1.79)#59 | 1.2%(+1.55)#2,665 |
| 60. | 63135 | 2.7% | 0.95%(+1.78)#60 | 1.2%(+1.55)#2,675 |
| 61. | 63824 | 2.7% | 0.95%(+1.75)#61 | 1.2%(+1.52)#2,724 |
| 62. | 63070 | 2.7% | 0.95%(+1.73)#62 | 1.2%(+1.50)#2,754 |
| 63. | 63104 | 2.6% | 0.95%(+1.69)#63 | 1.2%(+1.46)#2,805 |
| 64. | 64019 | 2.6% | 0.95%(+1.68)#64 | 1.2%(+1.45)#2,822 |
| 65. | 64163 | 2.6% | 0.95%(+1.67)#65 | 1.2%(+1.44)#2,851 |
| 66. | 65897 | 2.6% | 0.95%(+1.60)#66 | 1.2%(+1.37)#2,980 |
| 67. | 63967 | 2.5% | 0.95%(+1.55)#67 | 1.2%(+1.32)#3,091 |
| 68. | 64485 | 2.5% | 0.95%(+1.53)#68 | 1.2%(+1.30)#3,126 |
| 69. | 63965 | 2.5% | 0.95%(+1.52)#69 | 1.2%(+1.29)#3,154 |
| 70. | 65233 | 2.5% | 0.95%(+1.50)#70 | 1.2%(+1.27)#3,193 |
| 71. | 64735 | 2.4% | 0.95%(+1.49)#71 | 1.2%(+1.26)#3,222 |
| 72. | 65483 | 2.4% | 0.95%(+1.49)#72 | 1.2%(+1.25)#3,227 |
| 73. | 63453 | 2.4% | 0.95%(+1.49)#73 | 1.2%(+1.25)#3,230 |
| 74. | 65251 | 2.4% | 0.95%(+1.44)#74 | 1.2%(+1.20)#3,360 |
| 75. | 64759 | 2.4% | 0.95%(+1.42)#75 | 1.2%(+1.19)#3,400 |
| 76. | 65559 | 2.3% | 0.95%(+1.37)#76 | 1.2%(+1.14)#3,518 |
| 77. | 63857 | 2.3% | 0.95%(+1.35)#77 | 1.2%(+1.12)#3,545 |
| 78. | 63747 | 2.3% | 0.95%(+1.33)#78 | 1.2%(+1.10)#3,598 |
| 79. | 65625 | 2.3% | 0.95%(+1.33)#79 | 1.2%(+1.09)#3,625 |
| 80. | 65753 | 2.3% | 0.95%(+1.32)#80 | 1.2%(+1.09)#3,635 |
| 81. | 64133 | 2.2% | 0.95%(+1.26)#81 | 1.2%(+1.03)#3,820 |
| 82. | 64060 | 2.2% | 0.95%(+1.26)#82 | 1.2%(+1.02)#3,834 |
| 83. | 64840 | 2.2% | 0.95%(+1.25)#83 | 1.2%(+1.02)#3,844 |
| 84. | 64724 | 2.2% | 0.95%(+1.21)#84 | 1.2%(+0.976)#3,981 |
| 85. | 64070 | 2.1% | 0.95%(+1.19)#85 | 1.2%(+0.952)#4,040 |
| 86. | 64079 | 2.1% | 0.95%(+1.17)#86 | 1.2%(+0.933)#4,102 |
| 87. | 64157 | 2.1% | 0.95%(+1.16)#87 | 1.2%(+0.931)#4,111 |
| 88. | 64445 | 2.1% | 0.95%(+1.16)#88 | 1.2%(+0.927)#4,122 |
| 89. | 64112 | 2.1% | 0.95%(+1.15)#89 | 1.2%(+0.921)#4,132 |
| 90. | 63033 | 2.1% | 0.95%(+1.15)#90 | 1.2%(+0.918)#4,143 |
| 91. | 65566 | 2.1% | 0.95%(+1.13)#91 | 1.2%(+0.898)#4,206 |
| 92. | 64083 | 2.1% | 0.95%(+1.13)#92 | 1.2%(+0.895)#4,216 |
| 93. | 65053 | 2.1% | 0.95%(+1.13)#93 | 1.2%(+0.892)#4,223 |
| 94. | 63628 | 2.1% | 0.95%(+1.12)#94 | 1.2%(+0.889)#4,233 |
| 95. | 64127 | 2.1% | 0.95%(+1.12)#95 | 1.2%(+0.884)#4,249 |
| 96. | 64016 | 2.1% | 0.95%(+1.10)#96 | 1.2%(+0.868)#4,315 |
| 97. | 63469 | 2.0% | 0.95%(+1.09)#97 | 1.2%(+0.860)#4,347 |
| 98. | 65339 | 2.0% | 0.95%(+1.08)#98 | 1.2%(+0.845)#4,399 |
| 99. | 63629 | 2.0% | 0.95%(+1.08)#99 | 1.2%(+0.844)#4,405 |
| 100. | 63106 | 1.9% | 0.95%(+0.995)#100 | 1.2%(+0.762)#4,713 |
Common Questions
What are the Top 10 Zip Codes with the Highest Percentage of Population Employed in Firefighting & Prevention in Missouri?
Top 10 Zip Codes with the Highest Percentage of Population Employed in Firefighting & Prevention in Missouri are:
What zip code has the Highest Percentage of Population Employed in Firefighting & Prevention in Missouri?
65457 has the Highest Percentage of Population Employed in Firefighting & Prevention in Missouri with 24.1%.
What is the Percentage of Population Employed in Firefighting & Prevention in the State of Missouri?
Percentage of Population Employed in Firefighting & Prevention in Missouri is 0.95%.
What is the Percentage of Population Employed in Firefighting & Prevention in the United States?
Percentage of Population Employed in Firefighting & Prevention in the United States is 1.2%.