Zip Codes with the Highest Percentage of Families with Income Above $100,000 in Fishers, IN
RELATED REPORTS & OPTIONS
Family Income | $100k+
Fishers
Compare Zip Codes
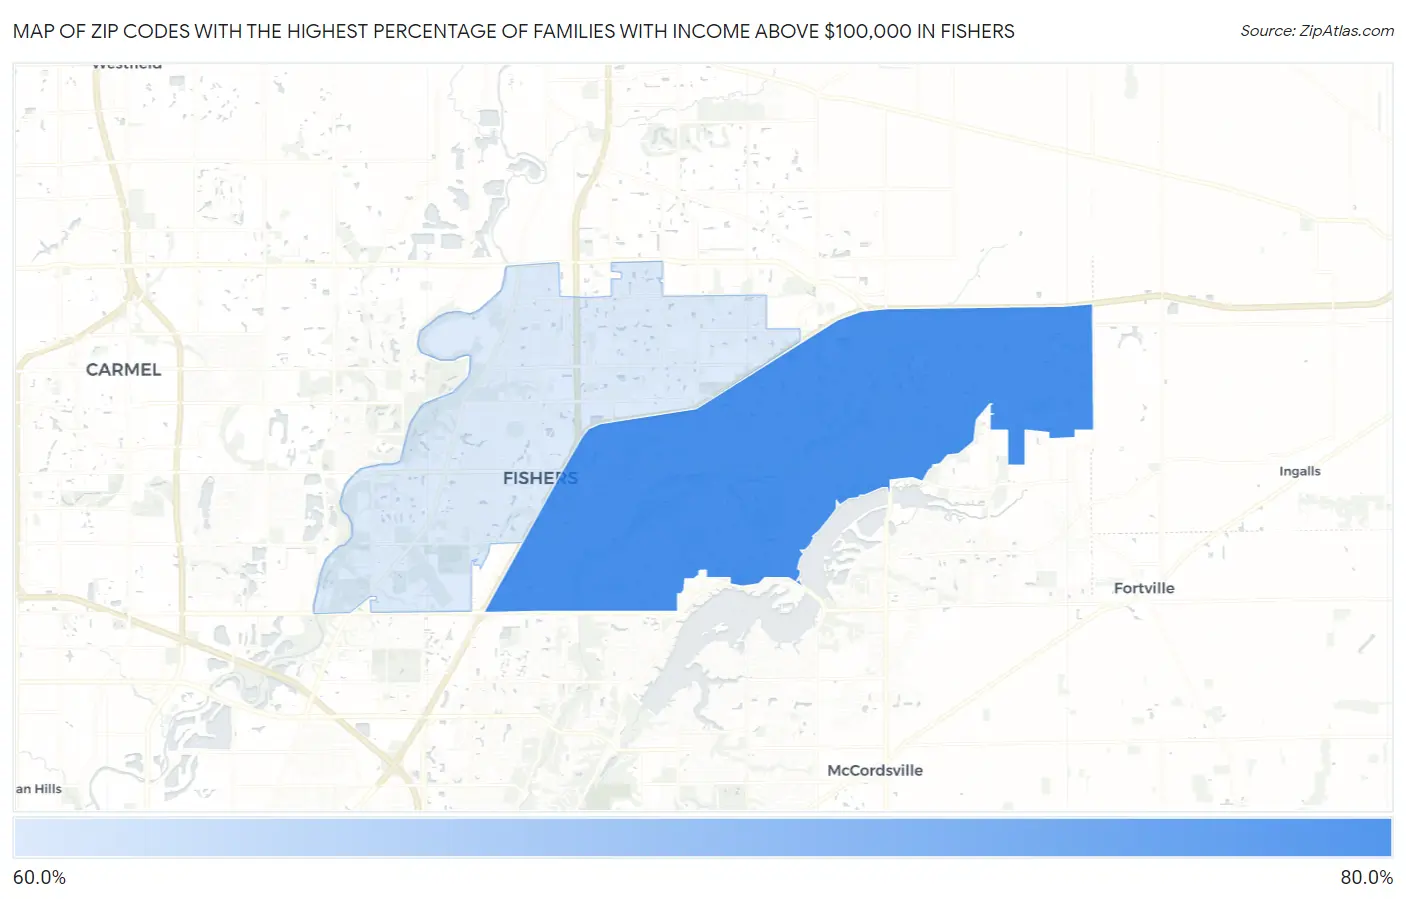
Map of Zip Codes with the Highest Percentage of Families with Income Above $100,000 in Fishers
63.2%
72.7%
Zip Codes with the Highest Percentage of Families with Income Above $100,000 in Fishers, IN
| Zip Code | Families with Income > $100k | vs State | vs National | |
| 1. | 46037 | 72.7% | 40.5%(+32.2)#17 | 46.1%(+26.6)#2,085 |
| 2. | 46038 | 63.2% | 40.5%(+22.7)#39 | 46.1%(+17.1)#4,214 |
1
Common Questions
What are the Top Zip Codes with the Highest Percentage of Families with Income Above $100,000 in Fishers, IN?
Top Zip Codes with the Highest Percentage of Families with Income Above $100,000 in Fishers, IN are:
What zip code has the Highest Percentage of Families with Income Above $100,000 in Fishers, IN?
46037 has the Highest Percentage of Families with Income Above $100,000 in Fishers, IN with 72.7%.
What is the Percentage of Families with Income Above $100,000 in Fishers, IN?
Percentage of Families with Income Above $100,000 in Fishers is 70.7%.
What is the Percentage of Families with Income Above $100,000 in Indiana?
Percentage of Families with Income Above $100,000 in Indiana is 40.5%.
What is the Percentage of Families with Income Above $100,000 in the United States?
Percentage of Families with Income Above $100,000 in the United States is 46.1%.