Zip Codes with the Highest Percentage of Population Employed in Legal Services & Support in Melrose Park, IL
RELATED REPORTS & OPTIONS
Legal Services & Support
Melrose Park
Compare Zip Codes
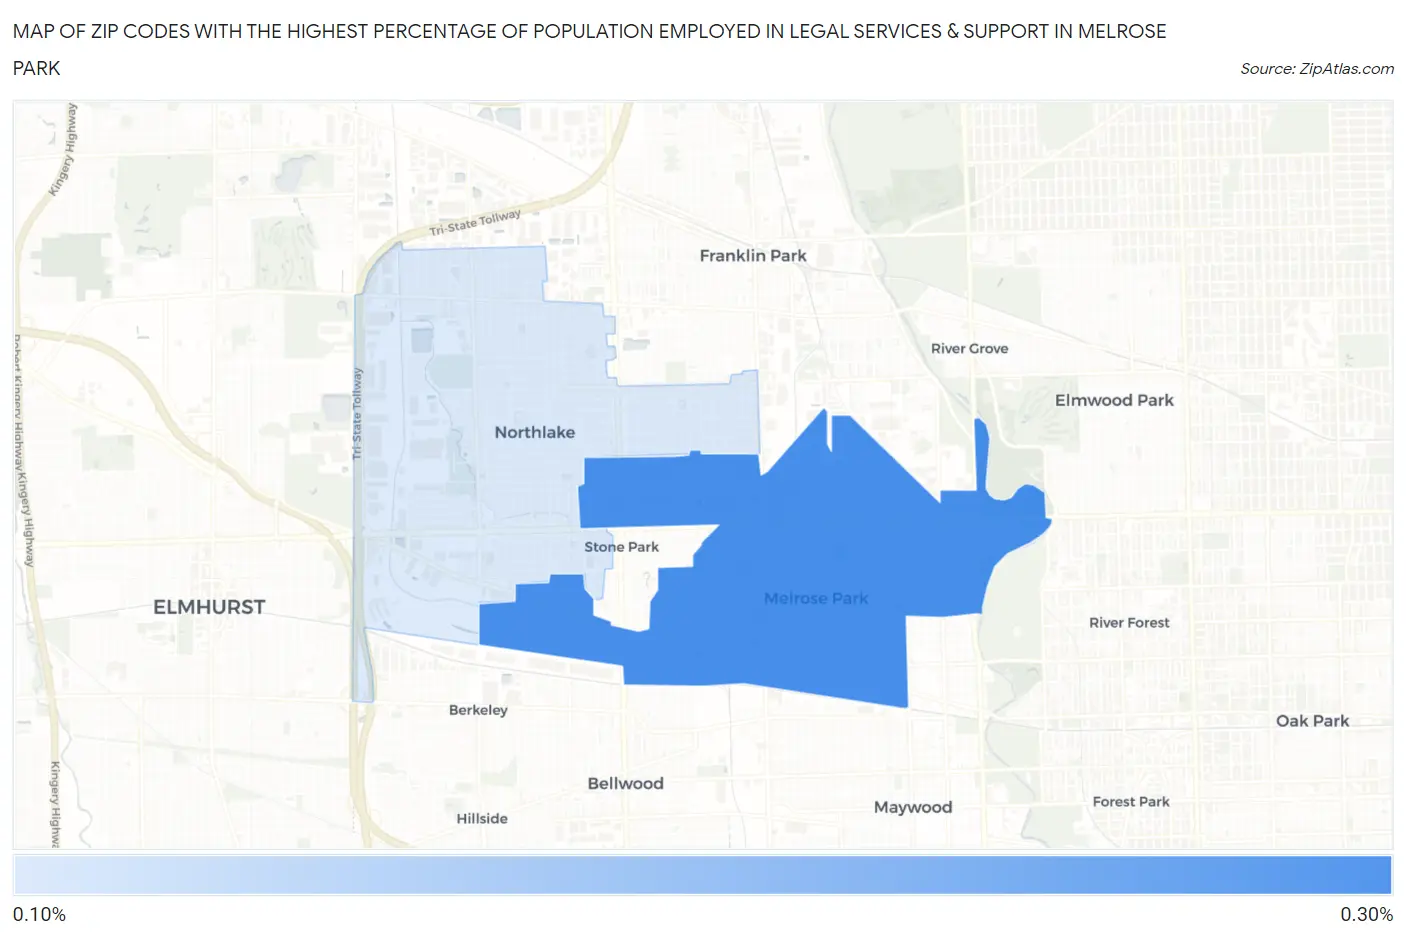
Map of Zip Codes with the Highest Percentage of Population Employed in Legal Services & Support in Melrose Park
0.20%
0.29%
Zip Codes with the Highest Percentage of Population Employed in Legal Services & Support in Melrose Park, IL
| Zip Code | % Employed | vs State | vs National | |
| 1. | 60160 | 0.29% | 1.3%(-1.06)#610 | 1.2%(-0.893)#15,144 |
| 2. | 60164 | 0.20% | 1.3%(-1.15)#662 | 1.2%(-0.986)#16,220 |
1
Common Questions
What are the Top Zip Codes with the Highest Percentage of Population Employed in Legal Services & Support in Melrose Park, IL?
Top Zip Codes with the Highest Percentage of Population Employed in Legal Services & Support in Melrose Park, IL are:
What zip code has the Highest Percentage of Population Employed in Legal Services & Support in Melrose Park, IL?
60160 has the Highest Percentage of Population Employed in Legal Services & Support in Melrose Park, IL with 0.29%.
What is the Percentage of Population Employed in Legal Services & Support in Melrose Park, IL?
Percentage of Population Employed in Legal Services & Support in Melrose Park is 0.29%.
What is the Percentage of Population Employed in Legal Services & Support in Illinois?
Percentage of Population Employed in Legal Services & Support in Illinois is 1.3%.
What is the Percentage of Population Employed in Legal Services & Support in the United States?
Percentage of Population Employed in Legal Services & Support in the United States is 1.2%.