Immigrants from Switzerland vs Ugandan Married-couple Households
COMPARE
Immigrants from Switzerland
Ugandan
Married-couple Households
Married-couple Households Comparison
Immigrants from Switzerland
Ugandans
46.2%
MARRIED-COUPLE HOUSEHOLDS
36.9/ 100
METRIC RATING
184th/ 347
METRIC RANK
43.8%
MARRIED-COUPLE HOUSEHOLDS
0.3/ 100
METRIC RATING
256th/ 347
METRIC RANK
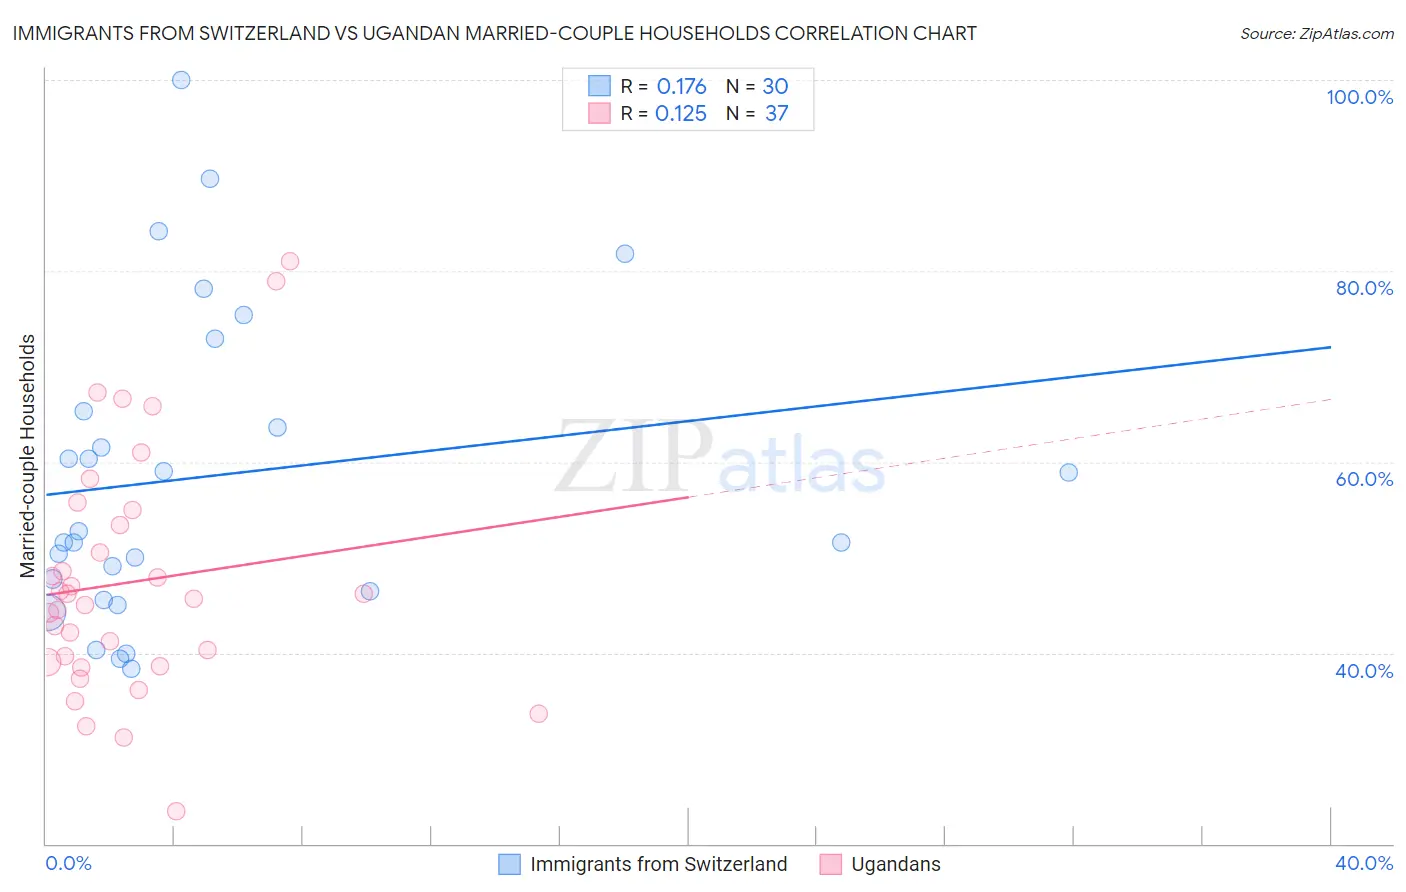
Immigrants from Switzerland vs Ugandan Married-couple Households Correlation Chart
The statistical analysis conducted on geographies consisting of 148,072,536 people shows a poor positive correlation between the proportion of Immigrants from Switzerland and percentage of married-couple family households in the United States with a correlation coefficient (R) of 0.176 and weighted average of 46.2%. Similarly, the statistical analysis conducted on geographies consisting of 93,998,948 people shows a poor positive correlation between the proportion of Ugandans and percentage of married-couple family households in the United States with a correlation coefficient (R) of 0.125 and weighted average of 43.8%, a difference of 5.4%.
Married-couple Households Correlation Summary
| Measurement | Immigrants from Switzerland | Ugandan |
| Minimum | 38.3% | 23.4% |
| Maximum | 100.0% | 81.0% |
| Range | 61.7% | 57.6% |
| Mean | 58.5% | 47.4% |
| Median | 52.2% | 45.6% |
| Interquartile 25% (IQ1) | 46.4% | 38.8% |
| Interquartile 75% (IQ3) | 65.4% | 54.2% |
| Interquartile Range (IQR) | 19.0% | 15.3% |
| Standard Deviation (Sample) | 16.1% | 12.7% |
| Standard Deviation (Population) | 15.8% | 12.5% |
Similar Demographics by Married-couple Households
Demographics Similar to Immigrants from Switzerland by Married-couple Households
In terms of married-couple households, the demographic groups most similar to Immigrants from Switzerland are Brazilian (46.2%, a difference of 0.040%), Immigrants from Brazil (46.2%, a difference of 0.060%), Yugoslavian (46.2%, a difference of 0.080%), Mongolian (46.3%, a difference of 0.20%), and Malaysian (46.3%, a difference of 0.20%).
| Demographics | Rating | Rank | Married-couple Households |
| Immigrants | Immigrants | 43.8 /100 | #177 | Average 46.3% |
| Immigrants | Costa Rica | 43.4 /100 | #178 | Average 46.3% |
| Immigrants | Zimbabwe | 43.0 /100 | #179 | Average 46.3% |
| Mongolians | 42.0 /100 | #180 | Average 46.3% |
| Malaysians | 41.8 /100 | #181 | Average 46.3% |
| Yugoslavians | 38.9 /100 | #182 | Fair 46.2% |
| Immigrants | Brazil | 38.3 /100 | #183 | Fair 46.2% |
| Immigrants | Switzerland | 36.9 /100 | #184 | Fair 46.2% |
| Brazilians | 35.9 /100 | #185 | Fair 46.2% |
| Albanians | 31.1 /100 | #186 | Fair 46.1% |
| Fijians | 29.2 /100 | #187 | Fair 46.1% |
| South American Indians | 28.4 /100 | #188 | Fair 46.0% |
| Immigrants | Latvia | 26.9 /100 | #189 | Fair 46.0% |
| Immigrants | Kuwait | 25.6 /100 | #190 | Fair 46.0% |
| Choctaw | 24.9 /100 | #191 | Fair 46.0% |
Demographics Similar to Ugandans by Married-couple Households
In terms of married-couple households, the demographic groups most similar to Ugandans are Shoshone (43.9%, a difference of 0.14%), Apache (43.9%, a difference of 0.16%), Blackfeet (43.8%, a difference of 0.16%), Central American Indian (43.8%, a difference of 0.20%), and Central American (43.9%, a difference of 0.21%).
| Demographics | Rating | Rank | Married-couple Households |
| Immigrants | Kenya | 0.4 /100 | #249 | Tragic 44.1% |
| French American Indians | 0.4 /100 | #250 | Tragic 44.1% |
| German Russians | 0.4 /100 | #251 | Tragic 44.0% |
| Seminole | 0.4 /100 | #252 | Tragic 44.0% |
| Central Americans | 0.3 /100 | #253 | Tragic 43.9% |
| Apache | 0.3 /100 | #254 | Tragic 43.9% |
| Shoshone | 0.3 /100 | #255 | Tragic 43.9% |
| Ugandans | 0.3 /100 | #256 | Tragic 43.8% |
| Blackfeet | 0.2 /100 | #257 | Tragic 43.8% |
| Central American Indians | 0.2 /100 | #258 | Tragic 43.8% |
| Iroquois | 0.2 /100 | #259 | Tragic 43.7% |
| Immigrants | Cameroon | 0.2 /100 | #260 | Tragic 43.7% |
| Alaskan Athabascans | 0.2 /100 | #261 | Tragic 43.6% |
| Vietnamese | 0.2 /100 | #262 | Tragic 43.6% |
| Cree | 0.1 /100 | #263 | Tragic 43.6% |