Immigrants from Central America vs Immigrants from Micronesia Married-couple Households
COMPARE
Immigrants from Central America
Immigrants from Micronesia
Married-couple Households
Married-couple Households Comparison
Immigrants from Central America
Immigrants from Micronesia
45.7%
MARRIED-COUPLE HOUSEHOLDS
14.2/ 100
METRIC RATING
202nd/ 347
METRIC RANK
44.9%
MARRIED-COUPLE HOUSEHOLDS
2.6/ 100
METRIC RATING
224th/ 347
METRIC RANK
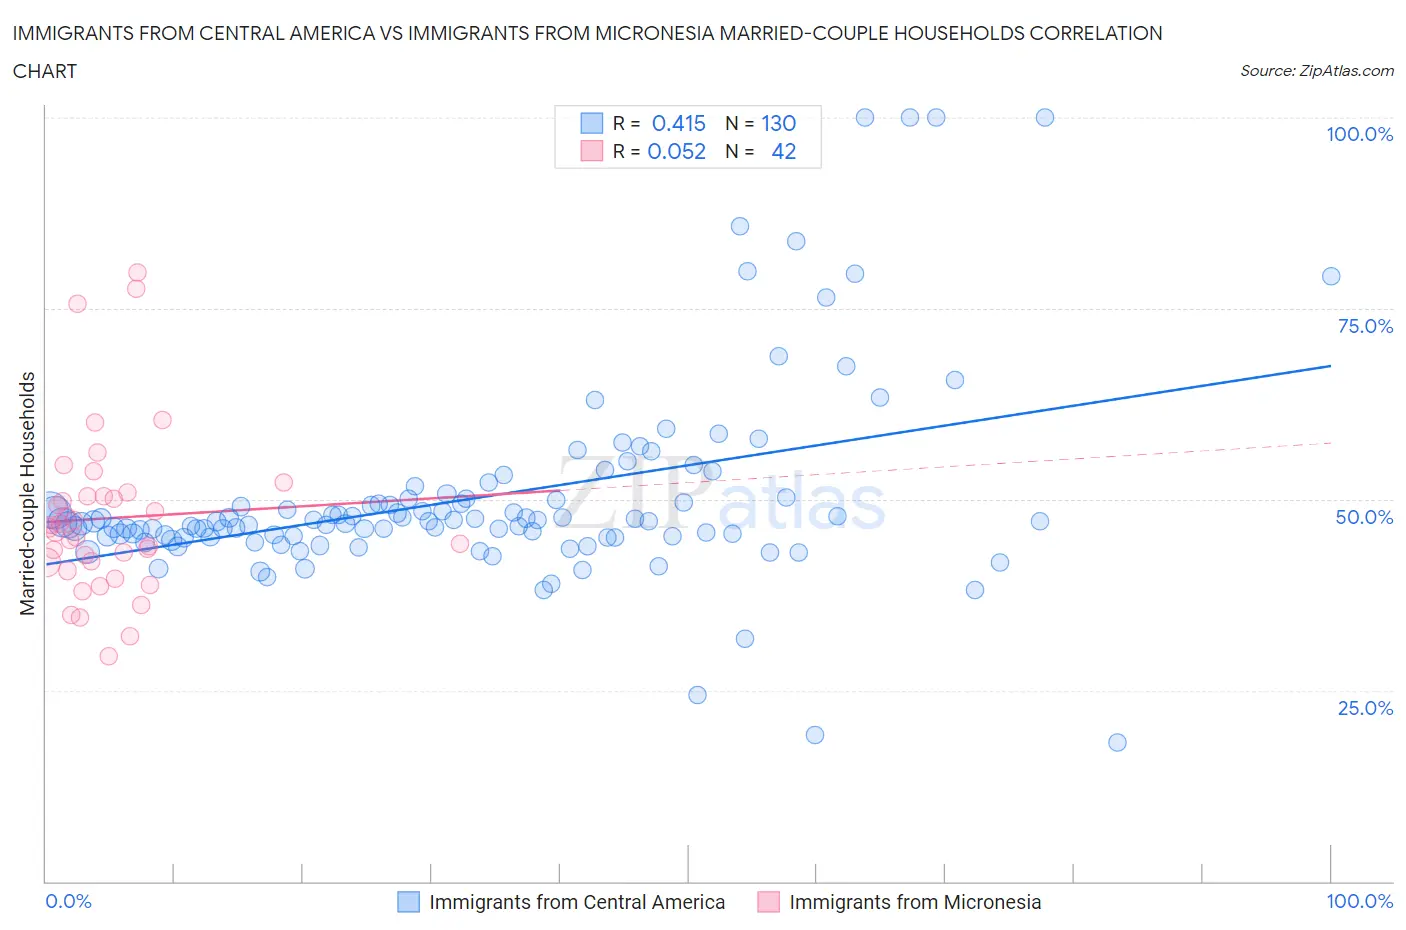
Immigrants from Central America vs Immigrants from Micronesia Married-couple Households Correlation Chart
The statistical analysis conducted on geographies consisting of 536,047,937 people shows a moderate positive correlation between the proportion of Immigrants from Central America and percentage of married-couple family households in the United States with a correlation coefficient (R) of 0.415 and weighted average of 45.7%. Similarly, the statistical analysis conducted on geographies consisting of 61,600,267 people shows a slight positive correlation between the proportion of Immigrants from Micronesia and percentage of married-couple family households in the United States with a correlation coefficient (R) of 0.052 and weighted average of 44.9%, a difference of 1.8%.
Married-couple Households Correlation Summary
| Measurement | Immigrants from Central America | Immigrants from Micronesia |
| Minimum | 18.2% | 29.5% |
| Maximum | 100.0% | 79.7% |
| Range | 81.8% | 50.3% |
| Mean | 50.3% | 47.5% |
| Median | 47.1% | 45.9% |
| Interquartile 25% (IQ1) | 45.1% | 41.7% |
| Interquartile 75% (IQ3) | 50.1% | 50.4% |
| Interquartile Range (IQR) | 5.0% | 8.7% |
| Standard Deviation (Sample) | 13.3% | 10.9% |
| Standard Deviation (Population) | 13.2% | 10.7% |
Similar Demographics by Married-couple Households
Demographics Similar to Immigrants from Central America by Married-couple Households
In terms of married-couple households, the demographic groups most similar to Immigrants from Central America are Immigrants from Serbia (45.7%, a difference of 0.080%), Alaska Native (45.6%, a difference of 0.090%), Potawatomi (45.7%, a difference of 0.11%), Carpatho Rusyn (45.7%, a difference of 0.12%), and Aleut (45.6%, a difference of 0.14%).
| Demographics | Rating | Rank | Married-couple Households |
| Chickasaw | 22.7 /100 | #195 | Fair 45.9% |
| Immigrants | South America | 22.2 /100 | #196 | Fair 45.9% |
| Cambodians | 21.3 /100 | #197 | Fair 45.9% |
| Ottawa | 19.4 /100 | #198 | Poor 45.8% |
| Carpatho Rusyns | 15.7 /100 | #199 | Poor 45.7% |
| Potawatomi | 15.6 /100 | #200 | Poor 45.7% |
| Immigrants | Serbia | 15.2 /100 | #201 | Poor 45.7% |
| Immigrants | Central America | 14.2 /100 | #202 | Poor 45.7% |
| Alaska Natives | 13.0 /100 | #203 | Poor 45.6% |
| Aleuts | 12.5 /100 | #204 | Poor 45.6% |
| Nepalese | 11.9 /100 | #205 | Poor 45.6% |
| Uruguayans | 10.4 /100 | #206 | Poor 45.5% |
| Immigrants | France | 8.8 /100 | #207 | Tragic 45.4% |
| Hispanics or Latinos | 8.7 /100 | #208 | Tragic 45.4% |
| Immigrants | Uzbekistan | 8.4 /100 | #209 | Tragic 45.4% |
Demographics Similar to Immigrants from Micronesia by Married-couple Households
In terms of married-couple households, the demographic groups most similar to Immigrants from Micronesia are Dutch West Indian (44.9%, a difference of 0.020%), Immigrants from Cambodia (44.9%, a difference of 0.030%), Alsatian (44.8%, a difference of 0.12%), Salvadoran (44.7%, a difference of 0.31%), and Kenyan (44.7%, a difference of 0.43%).
| Demographics | Rating | Rank | Married-couple Households |
| Panamanians | 5.5 /100 | #217 | Tragic 45.2% |
| Immigrants | Azores | 5.3 /100 | #218 | Tragic 45.2% |
| Nicaraguans | 5.3 /100 | #219 | Tragic 45.2% |
| Immigrants | Thailand | 5.1 /100 | #220 | Tragic 45.2% |
| Tlingit-Haida | 4.9 /100 | #221 | Tragic 45.1% |
| Immigrants | Laos | 4.6 /100 | #222 | Tragic 45.1% |
| Immigrants | Cambodia | 2.7 /100 | #223 | Tragic 44.9% |
| Immigrants | Micronesia | 2.6 /100 | #224 | Tragic 44.9% |
| Dutch West Indians | 2.6 /100 | #225 | Tragic 44.9% |
| Alsatians | 2.3 /100 | #226 | Tragic 44.8% |
| Salvadorans | 1.9 /100 | #227 | Tragic 44.7% |
| Kenyans | 1.7 /100 | #228 | Tragic 44.7% |
| Immigrants | Latin America | 1.6 /100 | #229 | Tragic 44.7% |
| Soviet Union | 1.6 /100 | #230 | Tragic 44.6% |
| Houma | 1.5 /100 | #231 | Tragic 44.6% |