Immigrants from Bosnia and Herzegovina vs Guyanese Married-couple Households
COMPARE
Immigrants from Bosnia and Herzegovina
Guyanese
Married-couple Households
Married-couple Households Comparison
Immigrants from Bosnia and Herzegovina
Guyanese
44.4%
MARRIED-COUPLE HOUSEHOLDS
1.0/ 100
METRIC RATING
241st/ 347
METRIC RANK
41.4%
MARRIED-COUPLE HOUSEHOLDS
0.0/ 100
METRIC RATING
306th/ 347
METRIC RANK
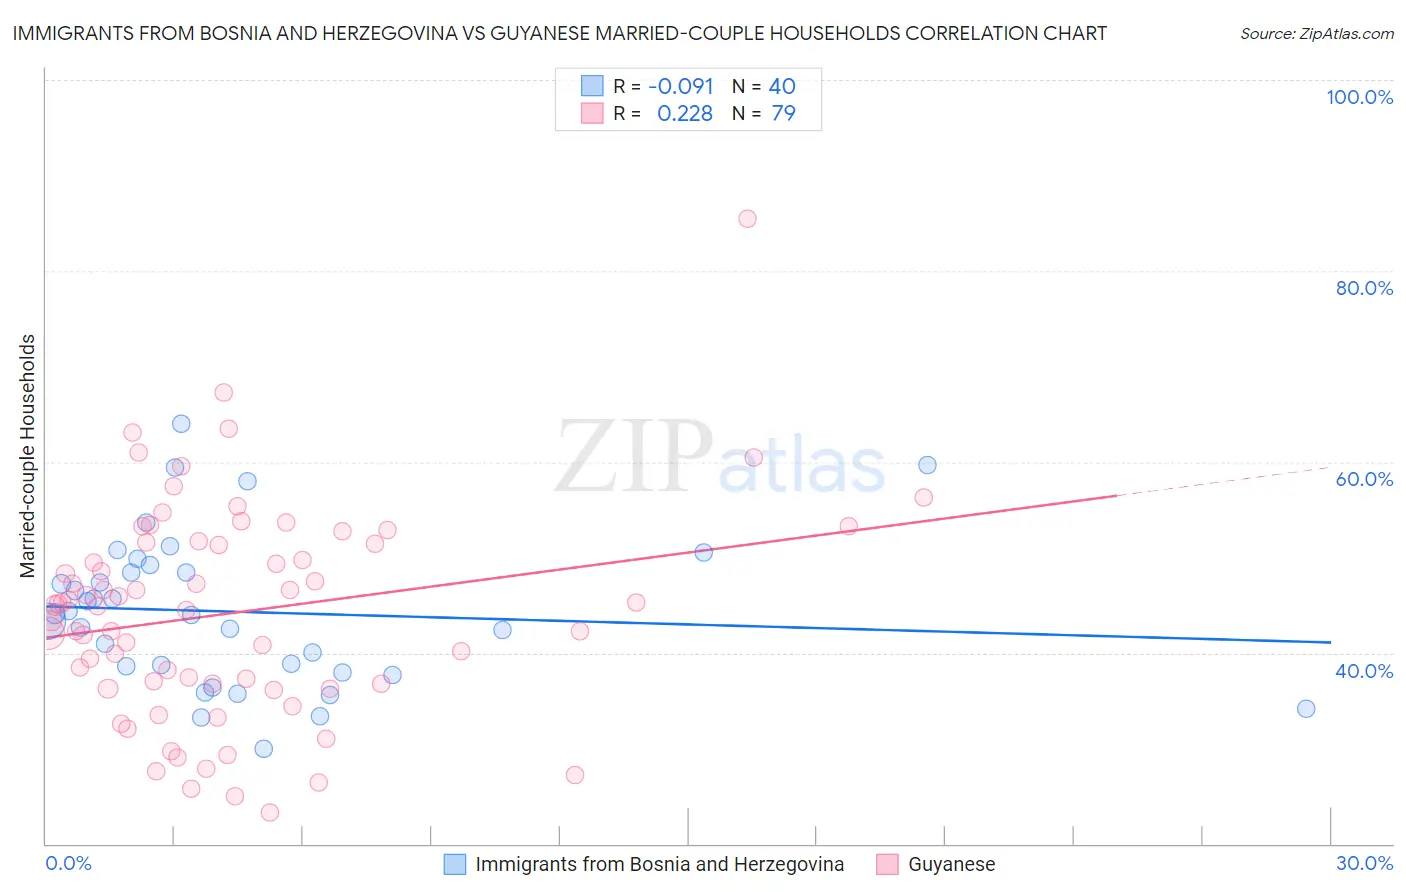
Immigrants from Bosnia and Herzegovina vs Guyanese Married-couple Households Correlation Chart
The statistical analysis conducted on geographies consisting of 156,805,510 people shows a slight negative correlation between the proportion of Immigrants from Bosnia and Herzegovina and percentage of married-couple family households in the United States with a correlation coefficient (R) of -0.091 and weighted average of 44.4%. Similarly, the statistical analysis conducted on geographies consisting of 176,795,479 people shows a weak positive correlation between the proportion of Guyanese and percentage of married-couple family households in the United States with a correlation coefficient (R) of 0.228 and weighted average of 41.4%, a difference of 7.5%.
Married-couple Households Correlation Summary
| Measurement | Immigrants from Bosnia and Herzegovina | Guyanese |
| Minimum | 29.9% | 23.3% |
| Maximum | 64.0% | 85.4% |
| Range | 34.1% | 62.2% |
| Mean | 44.3% | 44.2% |
| Median | 44.0% | 45.0% |
| Interquartile 25% (IQ1) | 38.2% | 36.8% |
| Interquartile 75% (IQ3) | 48.8% | 51.5% |
| Interquartile Range (IQR) | 10.6% | 14.7% |
| Standard Deviation (Sample) | 7.9% | 11.1% |
| Standard Deviation (Population) | 7.8% | 11.0% |
Similar Demographics by Married-couple Households
Demographics Similar to Immigrants from Bosnia and Herzegovina by Married-couple Households
In terms of married-couple households, the demographic groups most similar to Immigrants from Bosnia and Herzegovina are Ute (44.4%, a difference of 0.0%), Immigrants from Albania (44.4%, a difference of 0.040%), Spanish American (44.5%, a difference of 0.080%), Immigrants from Uruguay (44.5%, a difference of 0.10%), and Immigrants from Saudi Arabia (44.4%, a difference of 0.11%).
| Demographics | Rating | Rank | Married-couple Households |
| Immigrants | Panama | 1.3 /100 | #234 | Tragic 44.6% |
| Immigrants | Nicaragua | 1.2 /100 | #235 | Tragic 44.5% |
| Yaqui | 1.2 /100 | #236 | Tragic 44.5% |
| Comanche | 1.2 /100 | #237 | Tragic 44.5% |
| Immigrants | Uruguay | 1.1 /100 | #238 | Tragic 44.5% |
| Spanish Americans | 1.1 /100 | #239 | Tragic 44.5% |
| Ute | 1.0 /100 | #240 | Tragic 44.4% |
| Immigrants | Bosnia and Herzegovina | 1.0 /100 | #241 | Tragic 44.4% |
| Immigrants | Albania | 1.0 /100 | #242 | Tragic 44.4% |
| Immigrants | Saudi Arabia | 0.9 /100 | #243 | Tragic 44.4% |
| Immigrants | Armenia | 0.7 /100 | #244 | Tragic 44.3% |
| Immigrants | El Salvador | 0.7 /100 | #245 | Tragic 44.3% |
| Immigrants | Cuba | 0.6 /100 | #246 | Tragic 44.2% |
| Immigrants | Morocco | 0.6 /100 | #247 | Tragic 44.2% |
| Yup'ik | 0.4 /100 | #248 | Tragic 44.1% |
Demographics Similar to Guyanese by Married-couple Households
In terms of married-couple households, the demographic groups most similar to Guyanese are Immigrants from Western Africa (41.4%, a difference of 0.010%), Crow (41.4%, a difference of 0.010%), Immigrants from Trinidad and Tobago (41.2%, a difference of 0.36%), Sioux (41.5%, a difference of 0.37%), and Haitian (41.2%, a difference of 0.44%).
| Demographics | Rating | Rank | Married-couple Households |
| Immigrants | Ghana | 0.0 /100 | #299 | Tragic 41.8% |
| Immigrants | Belize | 0.0 /100 | #300 | Tragic 41.8% |
| Immigrants | Bahamas | 0.0 /100 | #301 | Tragic 41.7% |
| Immigrants | Honduras | 0.0 /100 | #302 | Tragic 41.6% |
| Sub-Saharan Africans | 0.0 /100 | #303 | Tragic 41.6% |
| Immigrants | Guyana | 0.0 /100 | #304 | Tragic 41.6% |
| Sioux | 0.0 /100 | #305 | Tragic 41.5% |
| Guyanese | 0.0 /100 | #306 | Tragic 41.4% |
| Immigrants | Western Africa | 0.0 /100 | #307 | Tragic 41.4% |
| Crow | 0.0 /100 | #308 | Tragic 41.4% |
| Immigrants | Trinidad and Tobago | 0.0 /100 | #309 | Tragic 41.2% |
| Haitians | 0.0 /100 | #310 | Tragic 41.2% |
| Colville | 0.0 /100 | #311 | Tragic 41.0% |
| Africans | 0.0 /100 | #312 | Tragic 40.9% |
| Immigrants | Haiti | 0.0 /100 | #313 | Tragic 40.9% |