Immigrants from Bosnia and Herzegovina vs Nicaraguan Married-couple Households
COMPARE
Immigrants from Bosnia and Herzegovina
Nicaraguan
Married-couple Households
Married-couple Households Comparison
Immigrants from Bosnia and Herzegovina
Nicaraguans
44.4%
MARRIED-COUPLE HOUSEHOLDS
1.0/ 100
METRIC RATING
241st/ 347
METRIC RANK
45.2%
MARRIED-COUPLE HOUSEHOLDS
5.3/ 100
METRIC RATING
219th/ 347
METRIC RANK
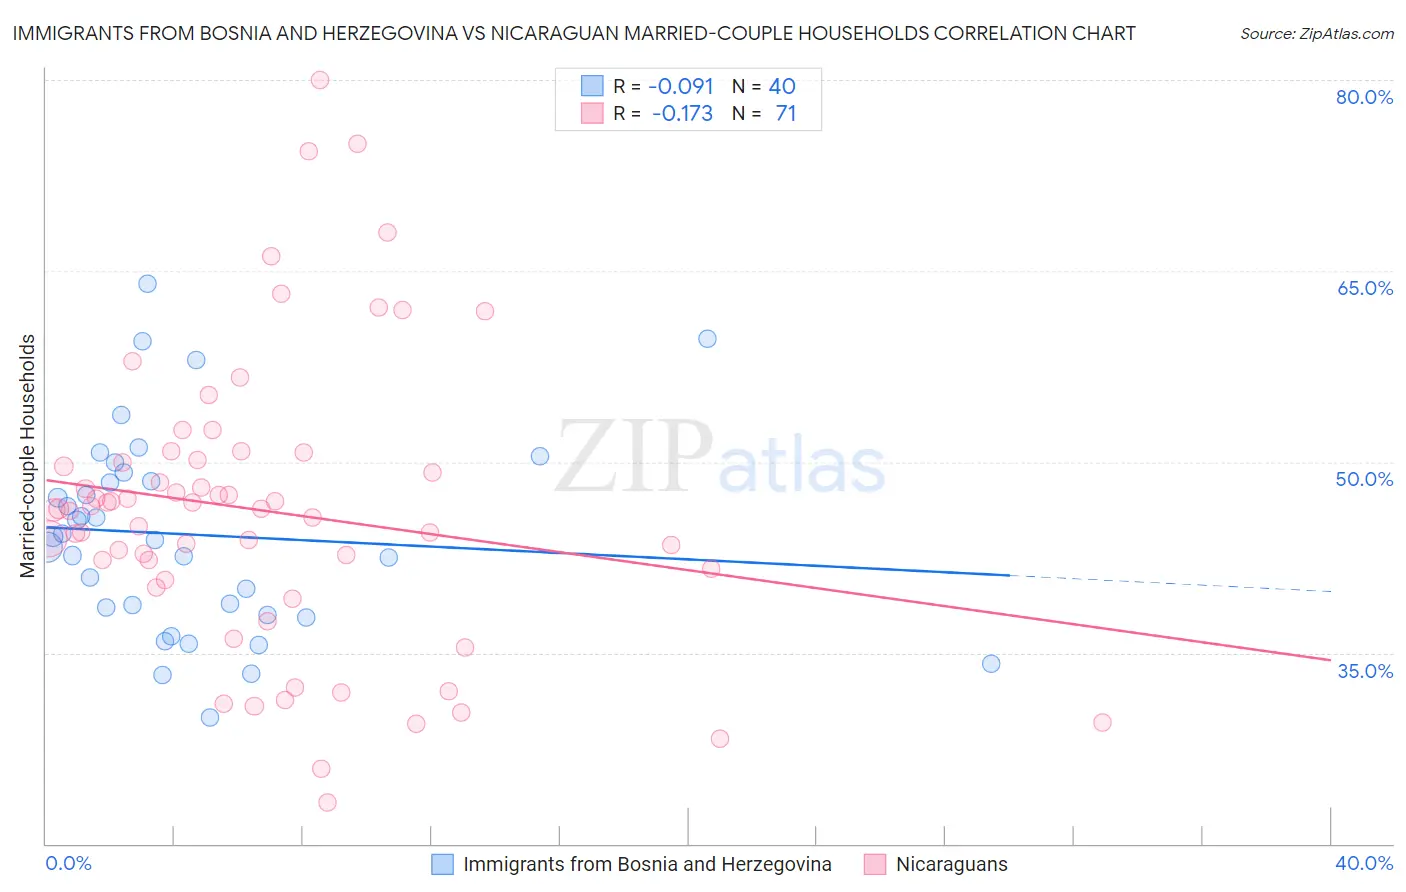
Immigrants from Bosnia and Herzegovina vs Nicaraguan Married-couple Households Correlation Chart
The statistical analysis conducted on geographies consisting of 156,805,510 people shows a slight negative correlation between the proportion of Immigrants from Bosnia and Herzegovina and percentage of married-couple family households in the United States with a correlation coefficient (R) of -0.091 and weighted average of 44.4%. Similarly, the statistical analysis conducted on geographies consisting of 285,610,844 people shows a poor negative correlation between the proportion of Nicaraguans and percentage of married-couple family households in the United States with a correlation coefficient (R) of -0.173 and weighted average of 45.2%, a difference of 1.7%.
Married-couple Households Correlation Summary
| Measurement | Immigrants from Bosnia and Herzegovina | Nicaraguan |
| Minimum | 29.9% | 23.2% |
| Maximum | 64.0% | 80.0% |
| Range | 34.1% | 56.8% |
| Mean | 44.3% | 46.2% |
| Median | 44.0% | 46.3% |
| Interquartile 25% (IQ1) | 38.2% | 40.8% |
| Interquartile 75% (IQ3) | 48.8% | 50.2% |
| Interquartile Range (IQR) | 10.6% | 9.4% |
| Standard Deviation (Sample) | 7.9% | 11.4% |
| Standard Deviation (Population) | 7.8% | 11.3% |
Similar Demographics by Married-couple Households
Demographics Similar to Immigrants from Bosnia and Herzegovina by Married-couple Households
In terms of married-couple households, the demographic groups most similar to Immigrants from Bosnia and Herzegovina are Ute (44.4%, a difference of 0.0%), Immigrants from Albania (44.4%, a difference of 0.040%), Spanish American (44.5%, a difference of 0.080%), Immigrants from Uruguay (44.5%, a difference of 0.10%), and Immigrants from Saudi Arabia (44.4%, a difference of 0.11%).
| Demographics | Rating | Rank | Married-couple Households |
| Immigrants | Panama | 1.3 /100 | #234 | Tragic 44.6% |
| Immigrants | Nicaragua | 1.2 /100 | #235 | Tragic 44.5% |
| Yaqui | 1.2 /100 | #236 | Tragic 44.5% |
| Comanche | 1.2 /100 | #237 | Tragic 44.5% |
| Immigrants | Uruguay | 1.1 /100 | #238 | Tragic 44.5% |
| Spanish Americans | 1.1 /100 | #239 | Tragic 44.5% |
| Ute | 1.0 /100 | #240 | Tragic 44.4% |
| Immigrants | Bosnia and Herzegovina | 1.0 /100 | #241 | Tragic 44.4% |
| Immigrants | Albania | 1.0 /100 | #242 | Tragic 44.4% |
| Immigrants | Saudi Arabia | 0.9 /100 | #243 | Tragic 44.4% |
| Immigrants | Armenia | 0.7 /100 | #244 | Tragic 44.3% |
| Immigrants | El Salvador | 0.7 /100 | #245 | Tragic 44.3% |
| Immigrants | Cuba | 0.6 /100 | #246 | Tragic 44.2% |
| Immigrants | Morocco | 0.6 /100 | #247 | Tragic 44.2% |
| Yup'ik | 0.4 /100 | #248 | Tragic 44.1% |
Demographics Similar to Nicaraguans by Married-couple Households
In terms of married-couple households, the demographic groups most similar to Nicaraguans are Immigrants from the Azores (45.2%, a difference of 0.010%), Panamanian (45.2%, a difference of 0.030%), Immigrants from Thailand (45.2%, a difference of 0.030%), Immigrants from Portugal (45.2%, a difference of 0.050%), and Immigrants from Nepal (45.2%, a difference of 0.060%).
| Demographics | Rating | Rank | Married-couple Households |
| Creek | 6.4 /100 | #212 | Tragic 45.3% |
| Yakama | 5.8 /100 | #213 | Tragic 45.2% |
| Japanese | 5.7 /100 | #214 | Tragic 45.2% |
| Immigrants | Nepal | 5.6 /100 | #215 | Tragic 45.2% |
| Immigrants | Portugal | 5.6 /100 | #216 | Tragic 45.2% |
| Panamanians | 5.5 /100 | #217 | Tragic 45.2% |
| Immigrants | Azores | 5.3 /100 | #218 | Tragic 45.2% |
| Nicaraguans | 5.3 /100 | #219 | Tragic 45.2% |
| Immigrants | Thailand | 5.1 /100 | #220 | Tragic 45.2% |
| Tlingit-Haida | 4.9 /100 | #221 | Tragic 45.1% |
| Immigrants | Laos | 4.6 /100 | #222 | Tragic 45.1% |
| Immigrants | Cambodia | 2.7 /100 | #223 | Tragic 44.9% |
| Immigrants | Micronesia | 2.6 /100 | #224 | Tragic 44.9% |
| Dutch West Indians | 2.6 /100 | #225 | Tragic 44.9% |
| Alsatians | 2.3 /100 | #226 | Tragic 44.8% |