Swiss vs Immigrants from Pakistan Disability Age Under 5
COMPARE
Swiss
Immigrants from Pakistan
Disability Age Under 5
Disability Age Under 5 Comparison
Swiss
Immigrants from Pakistan
1.6%
DISABILITY AGE UNDER 5
0.0/ 100
METRIC RATING
303rd/ 347
METRIC RANK
1.1%
DISABILITY AGE UNDER 5
98.4/ 100
METRIC RATING
75th/ 347
METRIC RANK
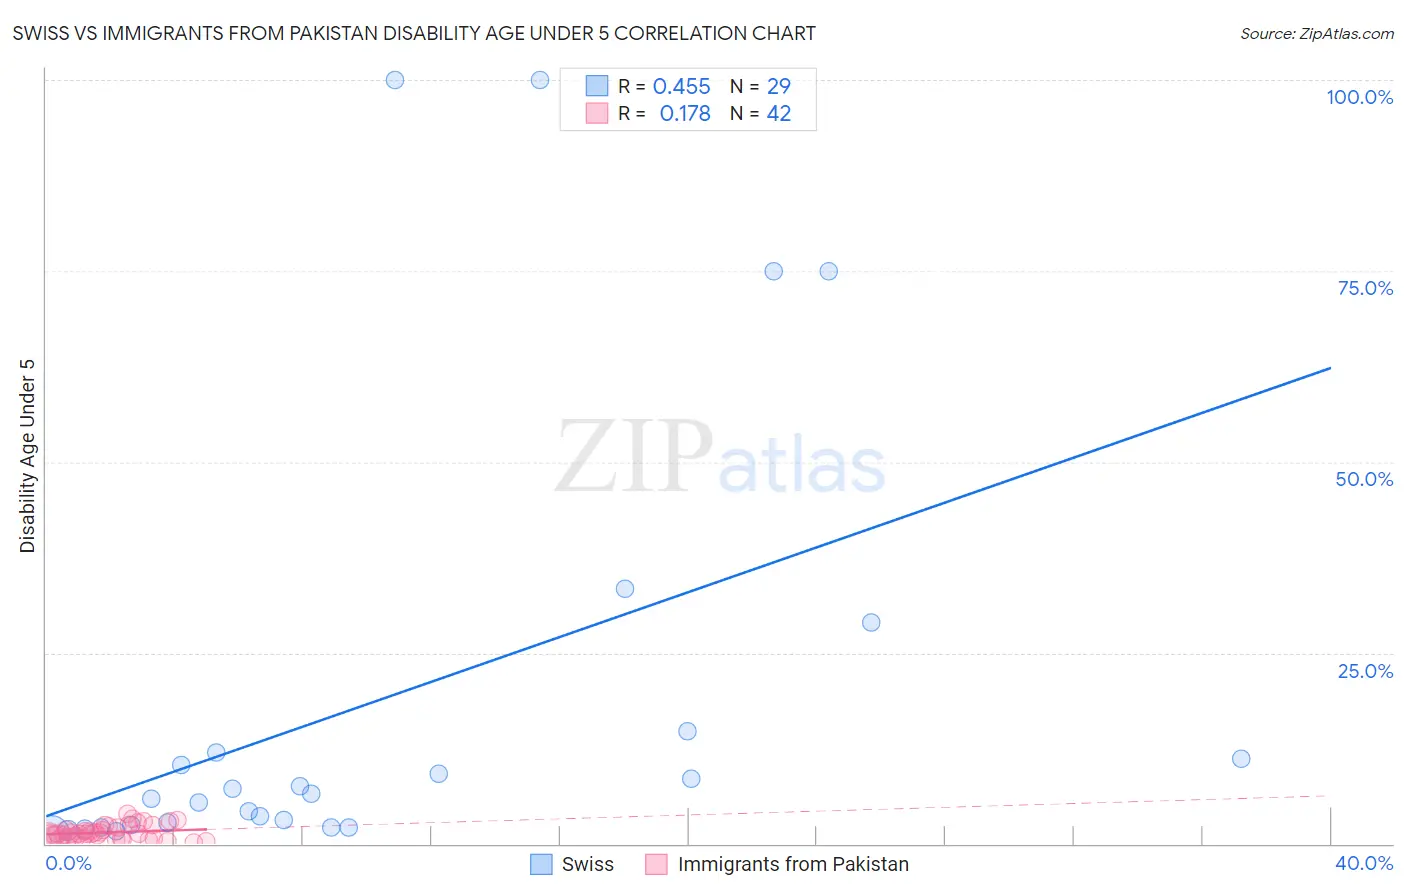
Swiss vs Immigrants from Pakistan Disability Age Under 5 Correlation Chart
The statistical analysis conducted on geographies consisting of 231,156,469 people shows a moderate positive correlation between the proportion of Swiss and percentage of population with a disability under the age of 5 in the United States with a correlation coefficient (R) of 0.455 and weighted average of 1.6%. Similarly, the statistical analysis conducted on geographies consisting of 169,764,287 people shows a poor positive correlation between the proportion of Immigrants from Pakistan and percentage of population with a disability under the age of 5 in the United States with a correlation coefficient (R) of 0.178 and weighted average of 1.1%, a difference of 45.2%.
Disability Age Under 5 Correlation Summary
| Measurement | Swiss | Immigrants from Pakistan |
| Minimum | 1.3% | 0.17% |
| Maximum | 100.0% | 3.9% |
| Range | 98.7% | 3.7% |
| Mean | 18.6% | 1.5% |
| Median | 6.6% | 1.3% |
| Interquartile 25% (IQ1) | 2.4% | 0.82% |
| Interquartile 75% (IQ3) | 13.4% | 2.2% |
| Interquartile Range (IQR) | 11.0% | 1.4% |
| Standard Deviation (Sample) | 29.4% | 0.91% |
| Standard Deviation (Population) | 28.9% | 0.90% |
Similar Demographics by Disability Age Under 5
Demographics Similar to Swiss by Disability Age Under 5
In terms of disability age under 5, the demographic groups most similar to Swiss are Welsh (1.6%, a difference of 0.16%), German Russian (1.6%, a difference of 0.27%), Seminole (1.6%, a difference of 0.63%), Shoshone (1.6%, a difference of 0.72%), and Blackfeet (1.6%, a difference of 0.79%).
| Demographics | Rating | Rank | Disability Age Under 5 |
| Poles | 0.0 /100 | #296 | Tragic 1.6% |
| Immigrants | Nonimmigrants | 0.0 /100 | #297 | Tragic 1.6% |
| Cajuns | 0.0 /100 | #298 | Tragic 1.6% |
| Portuguese | 0.0 /100 | #299 | Tragic 1.6% |
| Shoshone | 0.0 /100 | #300 | Tragic 1.6% |
| German Russians | 0.0 /100 | #301 | Tragic 1.6% |
| Welsh | 0.0 /100 | #302 | Tragic 1.6% |
| Swiss | 0.0 /100 | #303 | Tragic 1.6% |
| Seminole | 0.0 /100 | #304 | Tragic 1.6% |
| Blackfeet | 0.0 /100 | #305 | Tragic 1.6% |
| Creek | 0.0 /100 | #306 | Tragic 1.6% |
| Scottish | 0.0 /100 | #307 | Tragic 1.6% |
| Navajo | 0.0 /100 | #308 | Tragic 1.6% |
| Cape Verdeans | 0.0 /100 | #309 | Tragic 1.7% |
| Whites/Caucasians | 0.0 /100 | #310 | Tragic 1.7% |
Demographics Similar to Immigrants from Pakistan by Disability Age Under 5
In terms of disability age under 5, the demographic groups most similar to Immigrants from Pakistan are Immigrants from Sri Lanka (1.1%, a difference of 0.090%), Jordanian (1.1%, a difference of 0.090%), Burmese (1.1%, a difference of 0.17%), Immigrants from Burma/Myanmar (1.1%, a difference of 0.26%), and Trinidadian and Tobagonian (1.1%, a difference of 0.33%).
| Demographics | Rating | Rank | Disability Age Under 5 |
| South Africans | 98.7 /100 | #68 | Exceptional 1.1% |
| Israelis | 98.7 /100 | #69 | Exceptional 1.1% |
| Immigrants | Ecuador | 98.6 /100 | #70 | Exceptional 1.1% |
| Trinidadians and Tobagonians | 98.6 /100 | #71 | Exceptional 1.1% |
| Burmese | 98.5 /100 | #72 | Exceptional 1.1% |
| Immigrants | Sri Lanka | 98.5 /100 | #73 | Exceptional 1.1% |
| Jordanians | 98.5 /100 | #74 | Exceptional 1.1% |
| Immigrants | Pakistan | 98.4 /100 | #75 | Exceptional 1.1% |
| Immigrants | Burma/Myanmar | 98.2 /100 | #76 | Exceptional 1.1% |
| Immigrants | Denmark | 98.1 /100 | #77 | Exceptional 1.1% |
| West Indians | 98.0 /100 | #78 | Exceptional 1.1% |
| Hmong | 98.0 /100 | #79 | Exceptional 1.1% |
| Immigrants | Trinidad and Tobago | 98.0 /100 | #80 | Exceptional 1.1% |
| Turks | 98.0 /100 | #81 | Exceptional 1.1% |
| Immigrants | Jordan | 97.9 /100 | #82 | Exceptional 1.1% |