Swiss vs Immigrants from Colombia Disability Age Under 5
COMPARE
Swiss
Immigrants from Colombia
Disability Age Under 5
Disability Age Under 5 Comparison
Swiss
Immigrants from Colombia
1.6%
DISABILITY AGE UNDER 5
0.0/ 100
METRIC RATING
303rd/ 347
METRIC RANK
1.2%
DISABILITY AGE UNDER 5
79.3/ 100
METRIC RATING
142nd/ 347
METRIC RANK
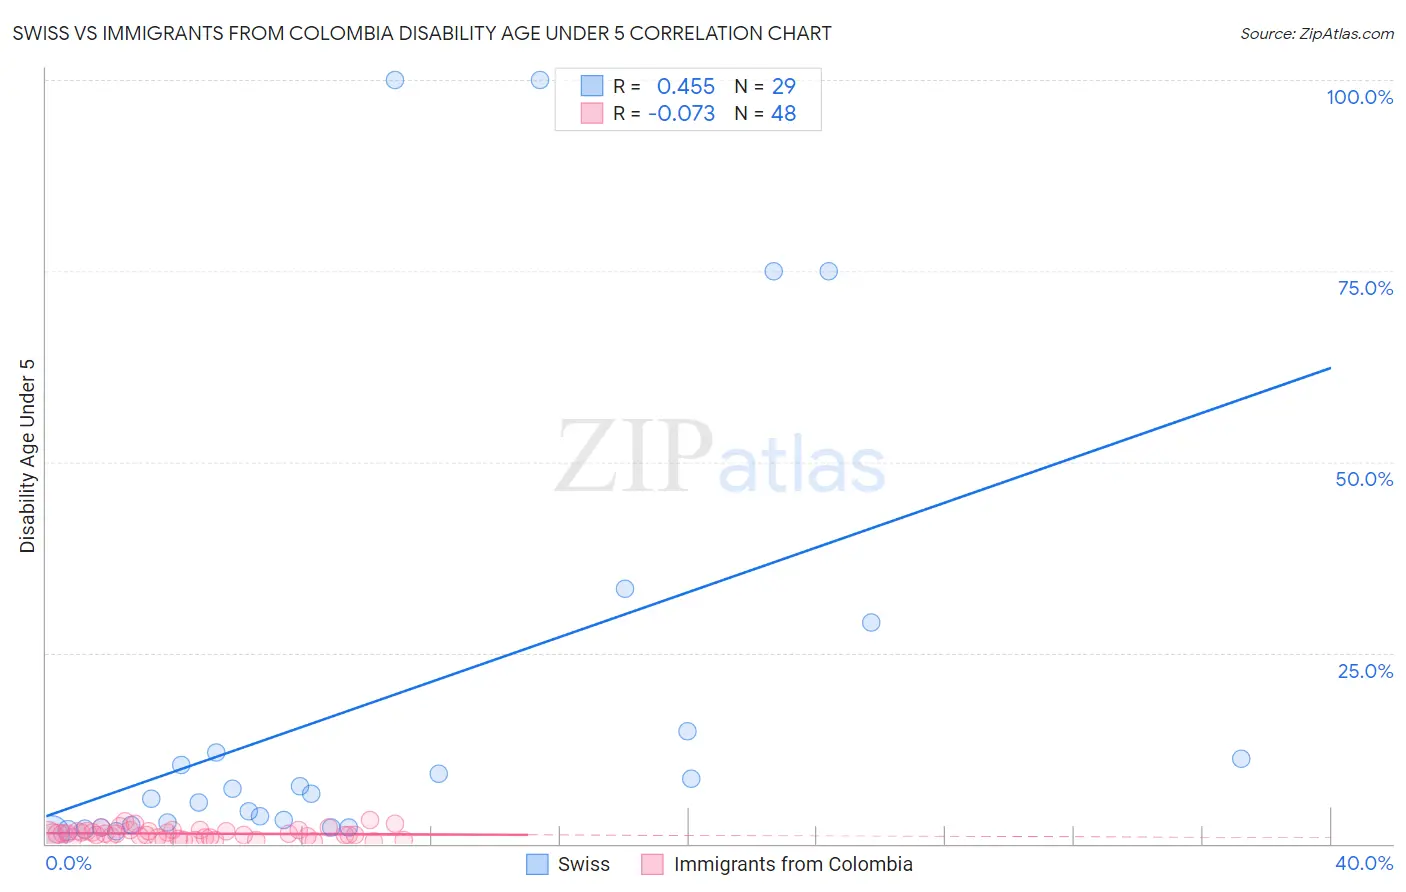
Swiss vs Immigrants from Colombia Disability Age Under 5 Correlation Chart
The statistical analysis conducted on geographies consisting of 231,156,469 people shows a moderate positive correlation between the proportion of Swiss and percentage of population with a disability under the age of 5 in the United States with a correlation coefficient (R) of 0.455 and weighted average of 1.6%. Similarly, the statistical analysis conducted on geographies consisting of 209,665,961 people shows a slight negative correlation between the proportion of Immigrants from Colombia and percentage of population with a disability under the age of 5 in the United States with a correlation coefficient (R) of -0.073 and weighted average of 1.2%, a difference of 35.8%.
Disability Age Under 5 Correlation Summary
| Measurement | Swiss | Immigrants from Colombia |
| Minimum | 1.3% | 0.32% |
| Maximum | 100.0% | 3.1% |
| Range | 98.7% | 2.8% |
| Mean | 18.6% | 1.3% |
| Median | 6.6% | 1.2% |
| Interquartile 25% (IQ1) | 2.4% | 0.86% |
| Interquartile 75% (IQ3) | 13.4% | 1.6% |
| Interquartile Range (IQR) | 11.0% | 0.78% |
| Standard Deviation (Sample) | 29.4% | 0.67% |
| Standard Deviation (Population) | 28.9% | 0.66% |
Similar Demographics by Disability Age Under 5
Demographics Similar to Swiss by Disability Age Under 5
In terms of disability age under 5, the demographic groups most similar to Swiss are Welsh (1.6%, a difference of 0.16%), German Russian (1.6%, a difference of 0.27%), Seminole (1.6%, a difference of 0.63%), Shoshone (1.6%, a difference of 0.72%), and Blackfeet (1.6%, a difference of 0.79%).
| Demographics | Rating | Rank | Disability Age Under 5 |
| Poles | 0.0 /100 | #296 | Tragic 1.6% |
| Immigrants | Nonimmigrants | 0.0 /100 | #297 | Tragic 1.6% |
| Cajuns | 0.0 /100 | #298 | Tragic 1.6% |
| Portuguese | 0.0 /100 | #299 | Tragic 1.6% |
| Shoshone | 0.0 /100 | #300 | Tragic 1.6% |
| German Russians | 0.0 /100 | #301 | Tragic 1.6% |
| Welsh | 0.0 /100 | #302 | Tragic 1.6% |
| Swiss | 0.0 /100 | #303 | Tragic 1.6% |
| Seminole | 0.0 /100 | #304 | Tragic 1.6% |
| Blackfeet | 0.0 /100 | #305 | Tragic 1.6% |
| Creek | 0.0 /100 | #306 | Tragic 1.6% |
| Scottish | 0.0 /100 | #307 | Tragic 1.6% |
| Navajo | 0.0 /100 | #308 | Tragic 1.6% |
| Cape Verdeans | 0.0 /100 | #309 | Tragic 1.7% |
| Whites/Caucasians | 0.0 /100 | #310 | Tragic 1.7% |
Demographics Similar to Immigrants from Colombia by Disability Age Under 5
In terms of disability age under 5, the demographic groups most similar to Immigrants from Colombia are Alsatian (1.2%, a difference of 0.010%), Immigrants from Middle Africa (1.2%, a difference of 0.010%), Immigrants from Honduras (1.2%, a difference of 0.15%), Immigrants from Zimbabwe (1.2%, a difference of 0.19%), and Somali (1.2%, a difference of 0.21%).
| Demographics | Rating | Rank | Disability Age Under 5 |
| Fijians | 84.7 /100 | #135 | Excellent 1.2% |
| Moroccans | 83.6 /100 | #136 | Excellent 1.2% |
| Immigrants | Eastern Africa | 83.1 /100 | #137 | Excellent 1.2% |
| Immigrants | Czechoslovakia | 82.8 /100 | #138 | Excellent 1.2% |
| New Zealanders | 81.4 /100 | #139 | Excellent 1.2% |
| Somalis | 80.8 /100 | #140 | Excellent 1.2% |
| Immigrants | Honduras | 80.4 /100 | #141 | Excellent 1.2% |
| Immigrants | Colombia | 79.3 /100 | #142 | Good 1.2% |
| Alsatians | 79.3 /100 | #143 | Good 1.2% |
| Immigrants | Middle Africa | 79.3 /100 | #144 | Good 1.2% |
| Immigrants | Zimbabwe | 77.9 /100 | #145 | Good 1.2% |
| Samoans | 77.7 /100 | #146 | Good 1.2% |
| Icelanders | 76.3 /100 | #147 | Good 1.2% |
| Ghanaians | 76.3 /100 | #148 | Good 1.2% |
| Kenyans | 75.9 /100 | #149 | Good 1.2% |