Swiss vs Immigrants from Egypt Disability Age Under 5
COMPARE
Swiss
Immigrants from Egypt
Disability Age Under 5
Disability Age Under 5 Comparison
Swiss
Immigrants from Egypt
1.6%
DISABILITY AGE UNDER 5
0.0/ 100
METRIC RATING
303rd/ 347
METRIC RANK
1.1%
DISABILITY AGE UNDER 5
99.4/ 100
METRIC RATING
58th/ 347
METRIC RANK
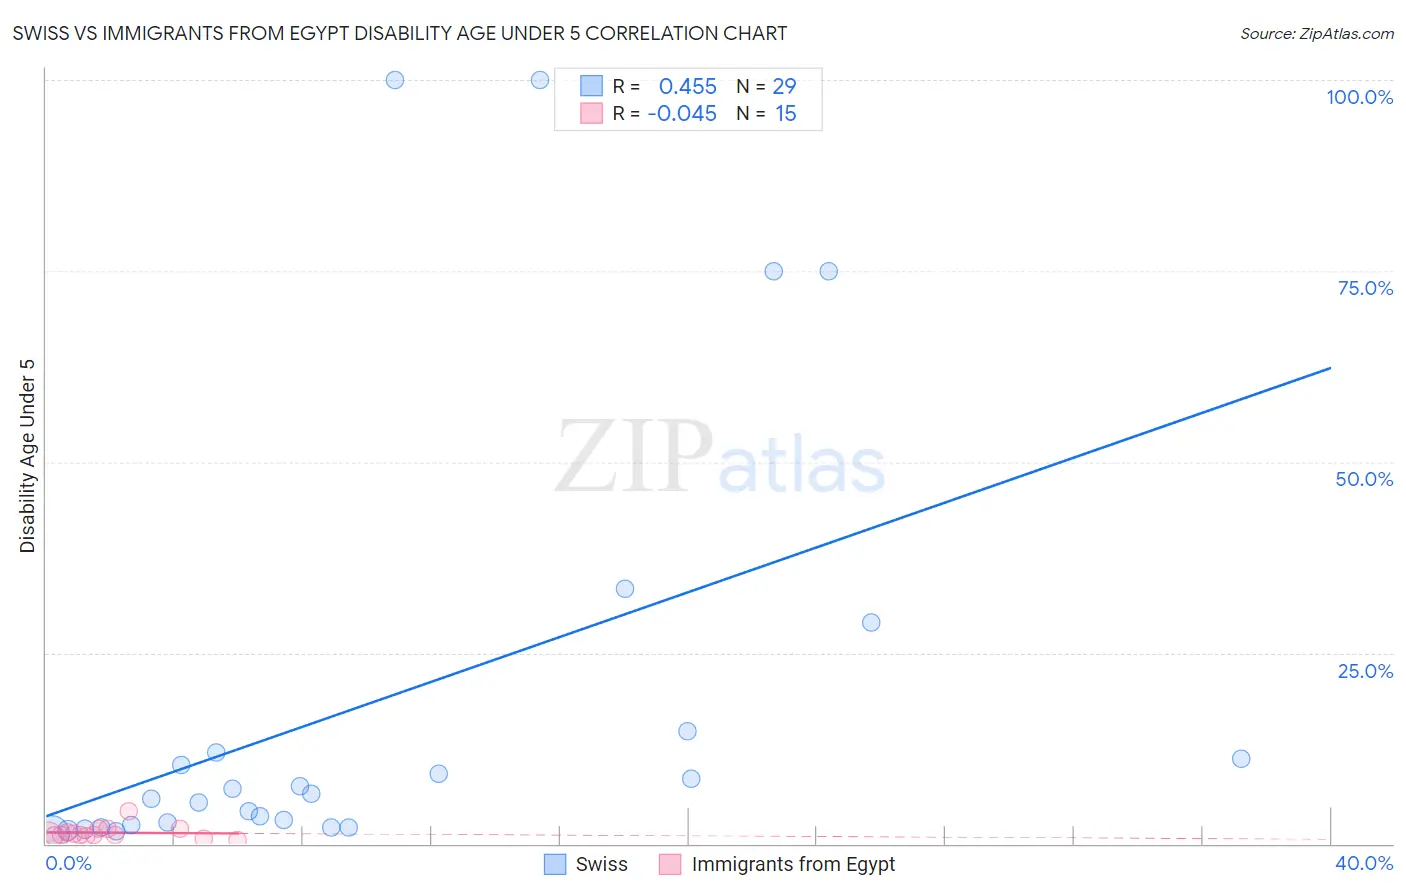
Swiss vs Immigrants from Egypt Disability Age Under 5 Correlation Chart
The statistical analysis conducted on geographies consisting of 231,156,469 people shows a moderate positive correlation between the proportion of Swiss and percentage of population with a disability under the age of 5 in the United States with a correlation coefficient (R) of 0.455 and weighted average of 1.6%. Similarly, the statistical analysis conducted on geographies consisting of 152,338,242 people shows no correlation between the proportion of Immigrants from Egypt and percentage of population with a disability under the age of 5 in the United States with a correlation coefficient (R) of -0.045 and weighted average of 1.1%, a difference of 48.9%.
Disability Age Under 5 Correlation Summary
| Measurement | Swiss | Immigrants from Egypt |
| Minimum | 1.3% | 0.53% |
| Maximum | 100.0% | 4.2% |
| Range | 98.7% | 3.7% |
| Mean | 18.6% | 1.4% |
| Median | 6.6% | 1.1% |
| Interquartile 25% (IQ1) | 2.4% | 1.0% |
| Interquartile 75% (IQ3) | 13.4% | 1.9% |
| Interquartile Range (IQR) | 11.0% | 0.94% |
| Standard Deviation (Sample) | 29.4% | 0.89% |
| Standard Deviation (Population) | 28.9% | 0.86% |
Similar Demographics by Disability Age Under 5
Demographics Similar to Swiss by Disability Age Under 5
In terms of disability age under 5, the demographic groups most similar to Swiss are Welsh (1.6%, a difference of 0.16%), German Russian (1.6%, a difference of 0.27%), Seminole (1.6%, a difference of 0.63%), Shoshone (1.6%, a difference of 0.72%), and Blackfeet (1.6%, a difference of 0.79%).
| Demographics | Rating | Rank | Disability Age Under 5 |
| Poles | 0.0 /100 | #296 | Tragic 1.6% |
| Immigrants | Nonimmigrants | 0.0 /100 | #297 | Tragic 1.6% |
| Cajuns | 0.0 /100 | #298 | Tragic 1.6% |
| Portuguese | 0.0 /100 | #299 | Tragic 1.6% |
| Shoshone | 0.0 /100 | #300 | Tragic 1.6% |
| German Russians | 0.0 /100 | #301 | Tragic 1.6% |
| Welsh | 0.0 /100 | #302 | Tragic 1.6% |
| Swiss | 0.0 /100 | #303 | Tragic 1.6% |
| Seminole | 0.0 /100 | #304 | Tragic 1.6% |
| Blackfeet | 0.0 /100 | #305 | Tragic 1.6% |
| Creek | 0.0 /100 | #306 | Tragic 1.6% |
| Scottish | 0.0 /100 | #307 | Tragic 1.6% |
| Navajo | 0.0 /100 | #308 | Tragic 1.6% |
| Cape Verdeans | 0.0 /100 | #309 | Tragic 1.7% |
| Whites/Caucasians | 0.0 /100 | #310 | Tragic 1.7% |
Demographics Similar to Immigrants from Egypt by Disability Age Under 5
In terms of disability age under 5, the demographic groups most similar to Immigrants from Egypt are Immigrants from Malaysia (1.1%, a difference of 0.12%), Assyrian/Chaldean/Syriac (1.1%, a difference of 0.19%), Ecuadorian (1.1%, a difference of 0.22%), Salvadoran (1.1%, a difference of 0.61%), and Immigrants from El Salvador (1.1%, a difference of 0.71%).
| Demographics | Rating | Rank | Disability Age Under 5 |
| Immigrants | Kazakhstan | 99.7 /100 | #51 | Exceptional 1.1% |
| Immigrants | Bolivia | 99.6 /100 | #52 | Exceptional 1.1% |
| Asians | 99.6 /100 | #53 | Exceptional 1.1% |
| Immigrants | El Salvador | 99.6 /100 | #54 | Exceptional 1.1% |
| Salvadorans | 99.5 /100 | #55 | Exceptional 1.1% |
| Ecuadorians | 99.5 /100 | #56 | Exceptional 1.1% |
| Assyrians/Chaldeans/Syriacs | 99.5 /100 | #57 | Exceptional 1.1% |
| Immigrants | Egypt | 99.4 /100 | #58 | Exceptional 1.1% |
| Immigrants | Malaysia | 99.4 /100 | #59 | Exceptional 1.1% |
| Immigrants | Western Asia | 99.2 /100 | #60 | Exceptional 1.1% |
| Immigrants | Ethiopia | 99.2 /100 | #61 | Exceptional 1.1% |
| Immigrants | Switzerland | 99.2 /100 | #62 | Exceptional 1.1% |
| Immigrants | Vietnam | 99.1 /100 | #63 | Exceptional 1.1% |
| Egyptians | 98.9 /100 | #64 | Exceptional 1.1% |
| Immigrants | Korea | 98.8 /100 | #65 | Exceptional 1.1% |