Swiss vs Bulgarian Disability Age Under 5
COMPARE
Swiss
Bulgarian
Disability Age Under 5
Disability Age Under 5 Comparison
Swiss
Bulgarians
1.6%
DISABILITY AGE UNDER 5
0.0/ 100
METRIC RATING
303rd/ 347
METRIC RANK
1.3%
DISABILITY AGE UNDER 5
19.5/ 100
METRIC RATING
209th/ 347
METRIC RANK
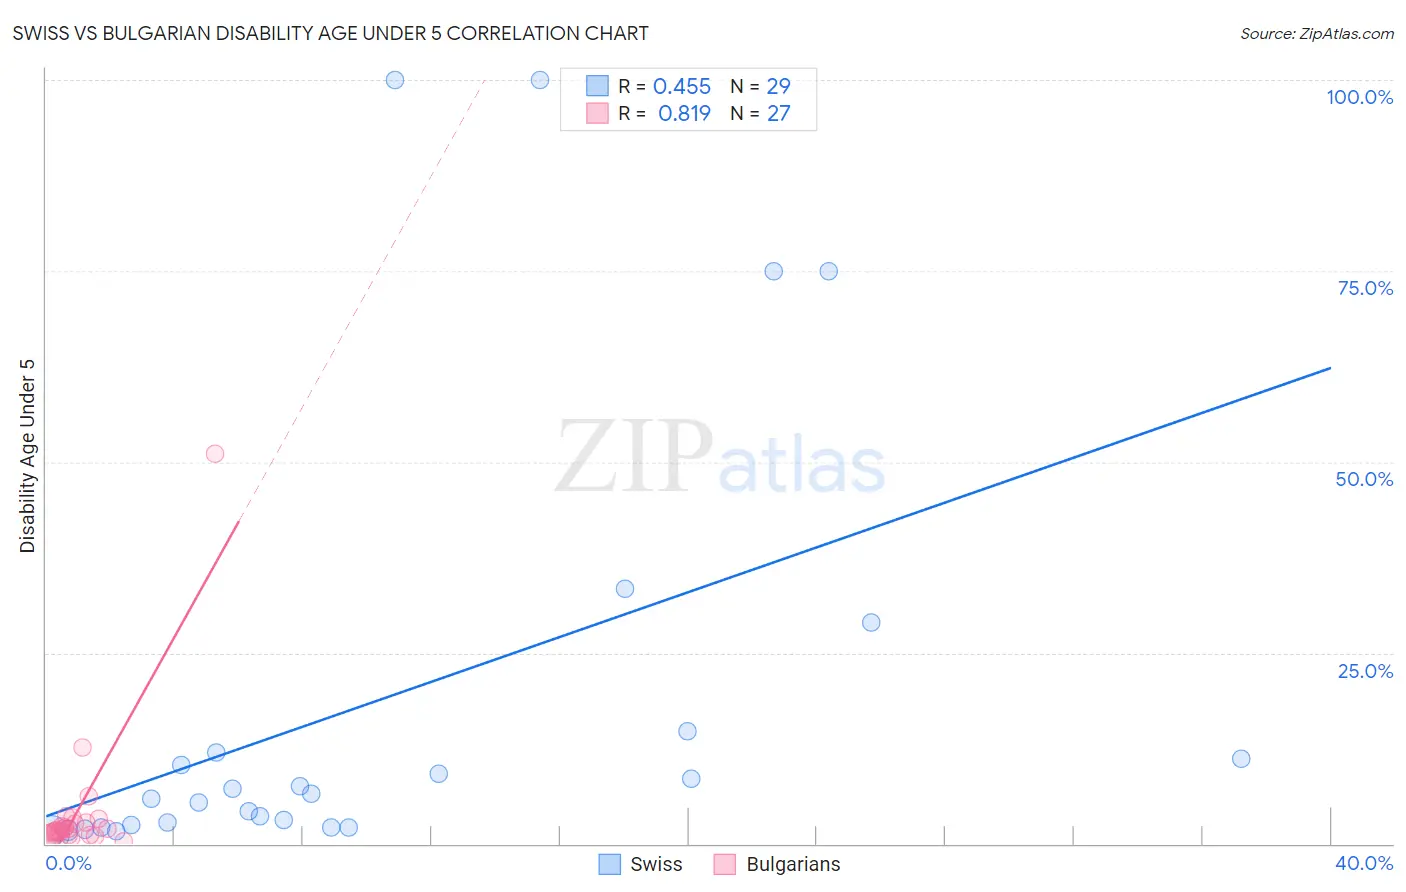
Swiss vs Bulgarian Disability Age Under 5 Correlation Chart
The statistical analysis conducted on geographies consisting of 231,156,469 people shows a moderate positive correlation between the proportion of Swiss and percentage of population with a disability under the age of 5 in the United States with a correlation coefficient (R) of 0.455 and weighted average of 1.6%. Similarly, the statistical analysis conducted on geographies consisting of 131,414,932 people shows a very strong positive correlation between the proportion of Bulgarians and percentage of population with a disability under the age of 5 in the United States with a correlation coefficient (R) of 0.819 and weighted average of 1.3%, a difference of 27.5%.
Disability Age Under 5 Correlation Summary
| Measurement | Swiss | Bulgarian |
| Minimum | 1.3% | 0.31% |
| Maximum | 100.0% | 51.1% |
| Range | 98.7% | 50.8% |
| Mean | 18.6% | 4.2% |
| Median | 6.6% | 1.7% |
| Interquartile 25% (IQ1) | 2.4% | 1.1% |
| Interquartile 75% (IQ3) | 13.4% | 2.8% |
| Interquartile Range (IQR) | 11.0% | 1.7% |
| Standard Deviation (Sample) | 29.4% | 9.7% |
| Standard Deviation (Population) | 28.9% | 9.5% |
Similar Demographics by Disability Age Under 5
Demographics Similar to Swiss by Disability Age Under 5
In terms of disability age under 5, the demographic groups most similar to Swiss are Welsh (1.6%, a difference of 0.16%), German Russian (1.6%, a difference of 0.27%), Seminole (1.6%, a difference of 0.63%), Shoshone (1.6%, a difference of 0.72%), and Blackfeet (1.6%, a difference of 0.79%).
| Demographics | Rating | Rank | Disability Age Under 5 |
| Poles | 0.0 /100 | #296 | Tragic 1.6% |
| Immigrants | Nonimmigrants | 0.0 /100 | #297 | Tragic 1.6% |
| Cajuns | 0.0 /100 | #298 | Tragic 1.6% |
| Portuguese | 0.0 /100 | #299 | Tragic 1.6% |
| Shoshone | 0.0 /100 | #300 | Tragic 1.6% |
| German Russians | 0.0 /100 | #301 | Tragic 1.6% |
| Welsh | 0.0 /100 | #302 | Tragic 1.6% |
| Swiss | 0.0 /100 | #303 | Tragic 1.6% |
| Seminole | 0.0 /100 | #304 | Tragic 1.6% |
| Blackfeet | 0.0 /100 | #305 | Tragic 1.6% |
| Creek | 0.0 /100 | #306 | Tragic 1.6% |
| Scottish | 0.0 /100 | #307 | Tragic 1.6% |
| Navajo | 0.0 /100 | #308 | Tragic 1.6% |
| Cape Verdeans | 0.0 /100 | #309 | Tragic 1.7% |
| Whites/Caucasians | 0.0 /100 | #310 | Tragic 1.7% |
Demographics Similar to Bulgarians by Disability Age Under 5
In terms of disability age under 5, the demographic groups most similar to Bulgarians are Pakistani (1.3%, a difference of 0.010%), Immigrants from Greece (1.3%, a difference of 0.050%), Chilean (1.3%, a difference of 0.090%), Immigrants from Sudan (1.3%, a difference of 0.11%), and Mexican (1.3%, a difference of 0.18%).
| Demographics | Rating | Rank | Disability Age Under 5 |
| Arapaho | 24.1 /100 | #202 | Fair 1.3% |
| Liberians | 24.0 /100 | #203 | Fair 1.3% |
| Immigrants | Europe | 23.6 /100 | #204 | Fair 1.3% |
| Romanians | 22.5 /100 | #205 | Fair 1.3% |
| Immigrants | Poland | 22.4 /100 | #206 | Fair 1.3% |
| Nigerians | 21.2 /100 | #207 | Fair 1.3% |
| Mexicans | 20.8 /100 | #208 | Fair 1.3% |
| Bulgarians | 19.5 /100 | #209 | Poor 1.3% |
| Pakistanis | 19.4 /100 | #210 | Poor 1.3% |
| Immigrants | Greece | 19.1 /100 | #211 | Poor 1.3% |
| Chileans | 18.8 /100 | #212 | Poor 1.3% |
| Immigrants | Sudan | 18.7 /100 | #213 | Poor 1.3% |
| Immigrants | Chile | 17.2 /100 | #214 | Poor 1.3% |
| Syrians | 16.1 /100 | #215 | Poor 1.3% |
| Bangladeshis | 15.5 /100 | #216 | Poor 1.3% |