Pueblo vs Russian Disability Age Under 5
COMPARE
Pueblo
Russian
Disability Age Under 5
Disability Age Under 5 Comparison
Pueblo
Russians
1.3%
DISABILITY AGE UNDER 5
3.8/ 100
METRIC RATING
234th/ 347
METRIC RANK
1.4%
DISABILITY AGE UNDER 5
1.0/ 100
METRIC RATING
246th/ 347
METRIC RANK
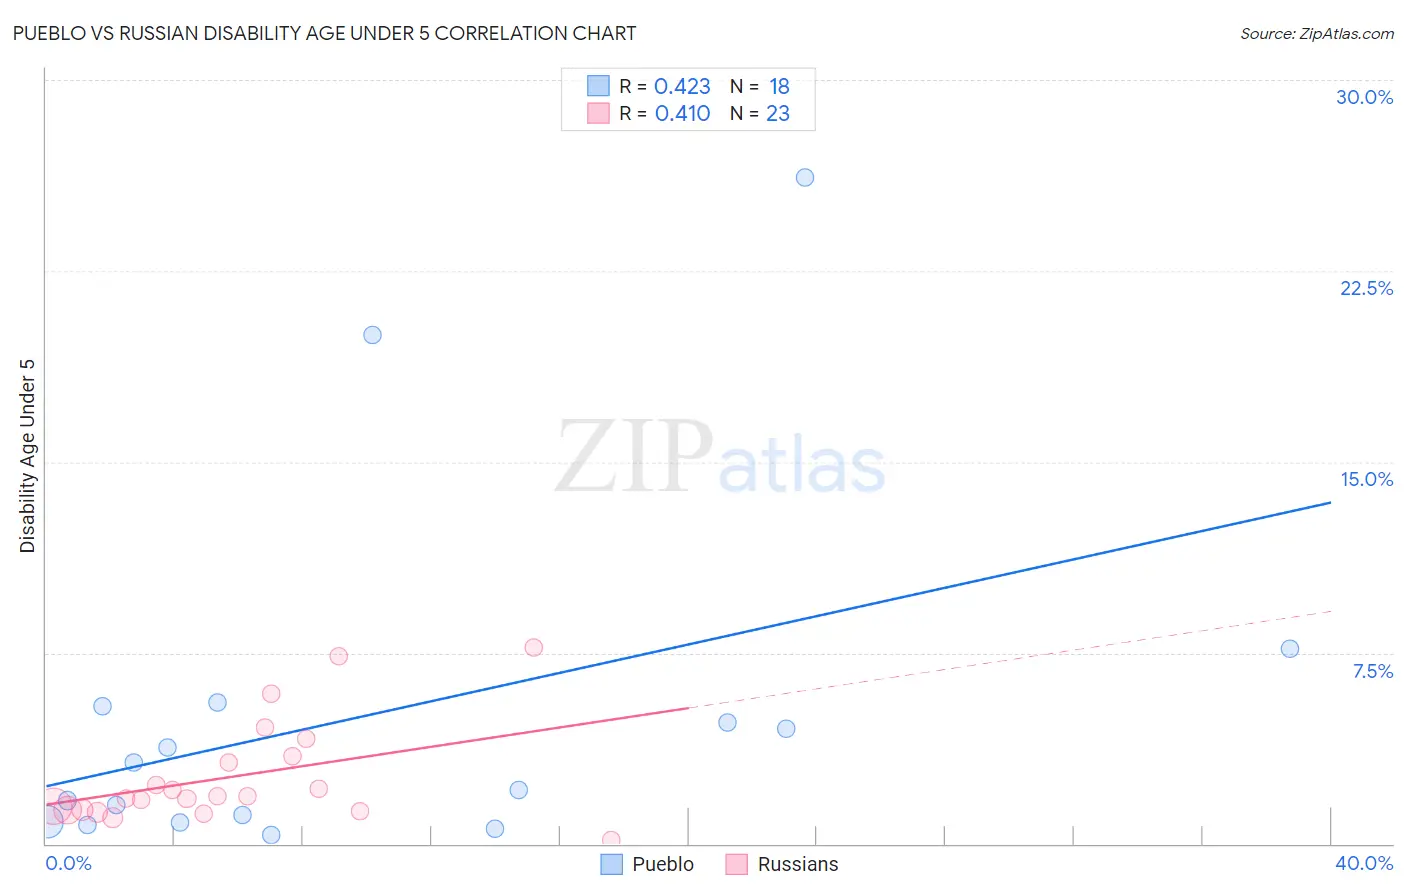
Pueblo vs Russian Disability Age Under 5 Correlation Chart
The statistical analysis conducted on geographies consisting of 91,796,516 people shows a moderate positive correlation between the proportion of Pueblo and percentage of population with a disability under the age of 5 in the United States with a correlation coefficient (R) of 0.423 and weighted average of 1.3%. Similarly, the statistical analysis conducted on geographies consisting of 247,754,409 people shows a moderate positive correlation between the proportion of Russians and percentage of population with a disability under the age of 5 in the United States with a correlation coefficient (R) of 0.410 and weighted average of 1.4%, a difference of 2.8%.
Disability Age Under 5 Correlation Summary
| Measurement | Pueblo | Russian |
| Minimum | 0.37% | 0.14% |
| Maximum | 26.2% | 7.7% |
| Range | 25.8% | 7.6% |
| Mean | 5.1% | 2.6% |
| Median | 2.7% | 1.8% |
| Interquartile 25% (IQ1) | 0.86% | 1.3% |
| Interquartile 75% (IQ3) | 5.4% | 3.4% |
| Interquartile Range (IQR) | 4.5% | 2.1% |
| Standard Deviation (Sample) | 7.0% | 2.0% |
| Standard Deviation (Population) | 6.8% | 2.0% |
Demographics Similar to Pueblo and Russians by Disability Age Under 5
In terms of disability age under 5, the demographic groups most similar to Pueblo are Central American Indian (1.3%, a difference of 0.070%), Tongan (1.3%, a difference of 0.26%), South American Indian (1.3%, a difference of 0.27%), French American Indian (1.3%, a difference of 0.38%), and Immigrants from Northern Europe (1.3%, a difference of 0.51%). Similarly, the demographic groups most similar to Russians are Immigrants from England (1.4%, a difference of 0.010%), Eastern European (1.4%, a difference of 0.050%), Potawatomi (1.4%, a difference of 0.13%), Bermudan (1.4%, a difference of 0.13%), and African (1.4%, a difference of 0.14%).
| Demographics | Rating | Rank | Disability Age Under 5 |
| Lebanese | 5.3 /100 | #230 | Tragic 1.3% |
| Immigrants | Northern Europe | 4.7 /100 | #231 | Tragic 1.3% |
| French American Indians | 4.5 /100 | #232 | Tragic 1.3% |
| Tongans | 4.2 /100 | #233 | Tragic 1.3% |
| Pueblo | 3.8 /100 | #234 | Tragic 1.3% |
| Central American Indians | 3.6 /100 | #235 | Tragic 1.3% |
| South American Indians | 3.3 /100 | #236 | Tragic 1.3% |
| Basques | 3.0 /100 | #237 | Tragic 1.3% |
| Spanish American Indians | 2.4 /100 | #238 | Tragic 1.3% |
| Immigrants | Austria | 2.3 /100 | #239 | Tragic 1.3% |
| Native Hawaiians | 2.2 /100 | #240 | Tragic 1.3% |
| Maltese | 2.2 /100 | #241 | Tragic 1.3% |
| Lumbee | 2.1 /100 | #242 | Tragic 1.3% |
| Immigrants | Cameroon | 1.7 /100 | #243 | Tragic 1.4% |
| Spaniards | 1.4 /100 | #244 | Tragic 1.4% |
| Potawatomi | 1.1 /100 | #245 | Tragic 1.4% |
| Russians | 1.0 /100 | #246 | Tragic 1.4% |
| Immigrants | England | 1.0 /100 | #247 | Tragic 1.4% |
| Eastern Europeans | 1.0 /100 | #248 | Tragic 1.4% |
| Bermudans | 1.0 /100 | #249 | Tragic 1.4% |
| Africans | 1.0 /100 | #250 | Tragic 1.4% |