Pueblo vs Nonimmigrants Disability Age Under 5
COMPARE
Pueblo
Nonimmigrants
Disability Age Under 5
Disability Age Under 5 Comparison
Pueblo
Nonimmigrants
1.3%
DISABILITY AGE UNDER 5
3.8/ 100
METRIC RATING
234th/ 347
METRIC RANK
1.6%
DISABILITY AGE UNDER 5
0.0/ 100
METRIC RATING
297th/ 347
METRIC RANK
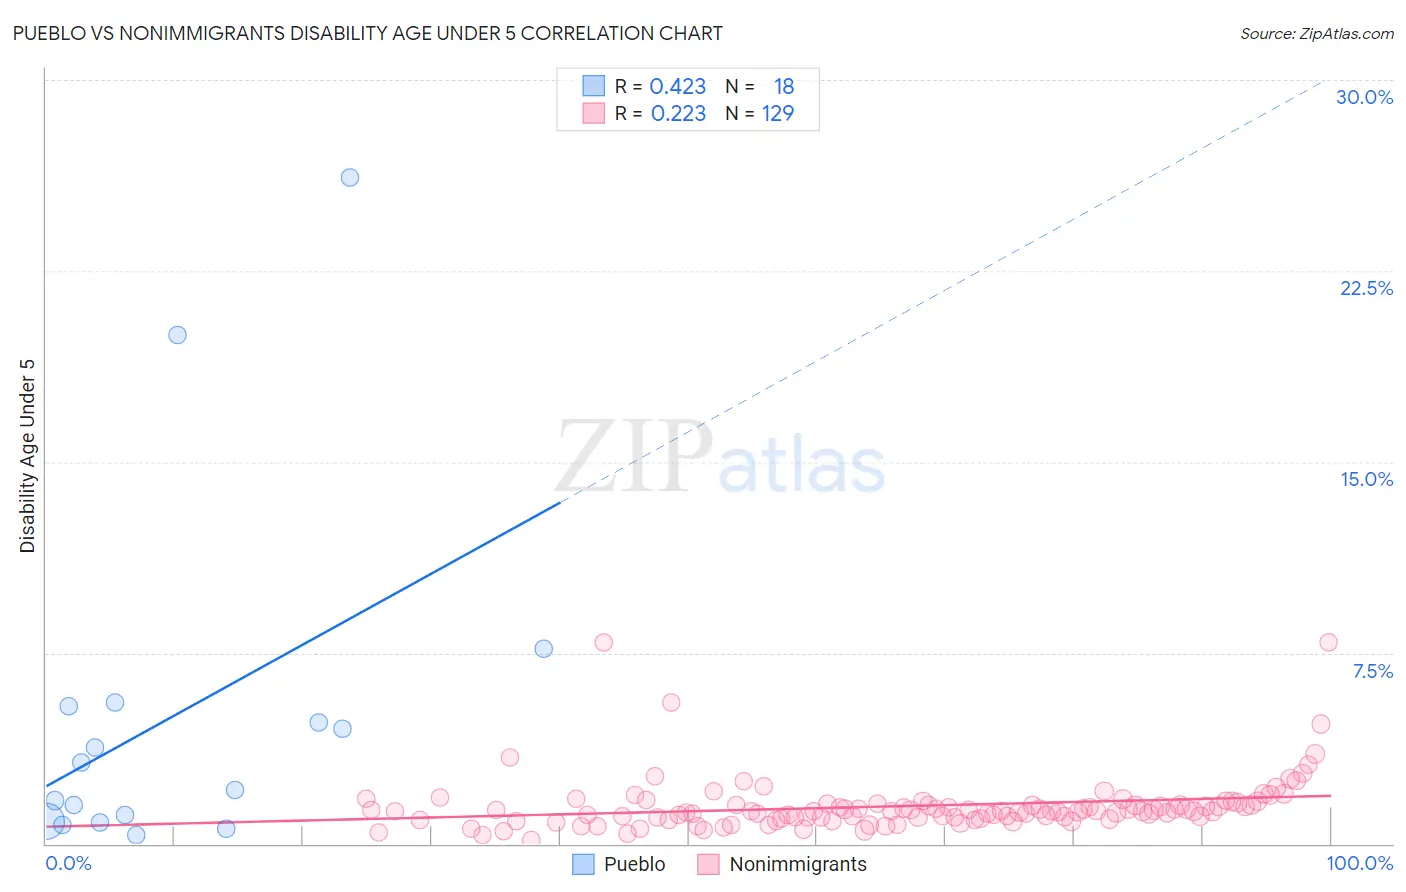
Pueblo vs Nonimmigrants Disability Age Under 5 Correlation Chart
The statistical analysis conducted on geographies consisting of 91,796,516 people shows a moderate positive correlation between the proportion of Pueblo and percentage of population with a disability under the age of 5 in the United States with a correlation coefficient (R) of 0.423 and weighted average of 1.3%. Similarly, the statistical analysis conducted on geographies consisting of 262,587,524 people shows a weak positive correlation between the proportion of Nonimmigrants and percentage of population with a disability under the age of 5 in the United States with a correlation coefficient (R) of 0.223 and weighted average of 1.6%, a difference of 20.7%.
Disability Age Under 5 Correlation Summary
| Measurement | Pueblo | Nonimmigrants |
| Minimum | 0.37% | 0.14% |
| Maximum | 26.2% | 7.9% |
| Range | 25.8% | 7.8% |
| Mean | 5.1% | 1.5% |
| Median | 2.7% | 1.3% |
| Interquartile 25% (IQ1) | 0.86% | 1.0% |
| Interquartile 75% (IQ3) | 5.4% | 1.5% |
| Interquartile Range (IQR) | 4.5% | 0.54% |
| Standard Deviation (Sample) | 7.0% | 1.1% |
| Standard Deviation (Population) | 6.8% | 1.1% |
Similar Demographics by Disability Age Under 5
Demographics Similar to Pueblo by Disability Age Under 5
In terms of disability age under 5, the demographic groups most similar to Pueblo are Central American Indian (1.3%, a difference of 0.070%), Tongan (1.3%, a difference of 0.26%), South American Indian (1.3%, a difference of 0.27%), French American Indian (1.3%, a difference of 0.38%), and Immigrants from Northern Europe (1.3%, a difference of 0.51%).
| Demographics | Rating | Rank | Disability Age Under 5 |
| Taiwanese | 6.1 /100 | #227 | Tragic 1.3% |
| Luxembourgers | 6.1 /100 | #228 | Tragic 1.3% |
| Immigrants | Costa Rica | 5.5 /100 | #229 | Tragic 1.3% |
| Lebanese | 5.3 /100 | #230 | Tragic 1.3% |
| Immigrants | Northern Europe | 4.7 /100 | #231 | Tragic 1.3% |
| French American Indians | 4.5 /100 | #232 | Tragic 1.3% |
| Tongans | 4.2 /100 | #233 | Tragic 1.3% |
| Pueblo | 3.8 /100 | #234 | Tragic 1.3% |
| Central American Indians | 3.6 /100 | #235 | Tragic 1.3% |
| South American Indians | 3.3 /100 | #236 | Tragic 1.3% |
| Basques | 3.0 /100 | #237 | Tragic 1.3% |
| Spanish American Indians | 2.4 /100 | #238 | Tragic 1.3% |
| Immigrants | Austria | 2.3 /100 | #239 | Tragic 1.3% |
| Native Hawaiians | 2.2 /100 | #240 | Tragic 1.3% |
| Maltese | 2.2 /100 | #241 | Tragic 1.3% |
Demographics Similar to Nonimmigrants by Disability Age Under 5
In terms of disability age under 5, the demographic groups most similar to Nonimmigrants are Cajun (1.6%, a difference of 0.010%), Portuguese (1.6%, a difference of 0.58%), Shoshone (1.6%, a difference of 0.91%), Polish (1.6%, a difference of 0.96%), and Finnish (1.6%, a difference of 1.0%).
| Demographics | Rating | Rank | Disability Age Under 5 |
| Czechs | 0.0 /100 | #290 | Tragic 1.5% |
| Northern Europeans | 0.0 /100 | #291 | Tragic 1.6% |
| Italians | 0.0 /100 | #292 | Tragic 1.6% |
| Lithuanians | 0.0 /100 | #293 | Tragic 1.6% |
| Swedes | 0.0 /100 | #294 | Tragic 1.6% |
| Finns | 0.0 /100 | #295 | Tragic 1.6% |
| Poles | 0.0 /100 | #296 | Tragic 1.6% |
| Immigrants | Nonimmigrants | 0.0 /100 | #297 | Tragic 1.6% |
| Cajuns | 0.0 /100 | #298 | Tragic 1.6% |
| Portuguese | 0.0 /100 | #299 | Tragic 1.6% |
| Shoshone | 0.0 /100 | #300 | Tragic 1.6% |
| German Russians | 0.0 /100 | #301 | Tragic 1.6% |
| Welsh | 0.0 /100 | #302 | Tragic 1.6% |
| Swiss | 0.0 /100 | #303 | Tragic 1.6% |
| Seminole | 0.0 /100 | #304 | Tragic 1.6% |