Pueblo vs Immigrants from Vietnam Disability Age Under 5
COMPARE
Pueblo
Immigrants from Vietnam
Disability Age Under 5
Disability Age Under 5 Comparison
Pueblo
Immigrants from Vietnam
1.3%
DISABILITY AGE UNDER 5
3.8/ 100
METRIC RATING
234th/ 347
METRIC RANK
1.1%
DISABILITY AGE UNDER 5
99.1/ 100
METRIC RATING
63rd/ 347
METRIC RANK
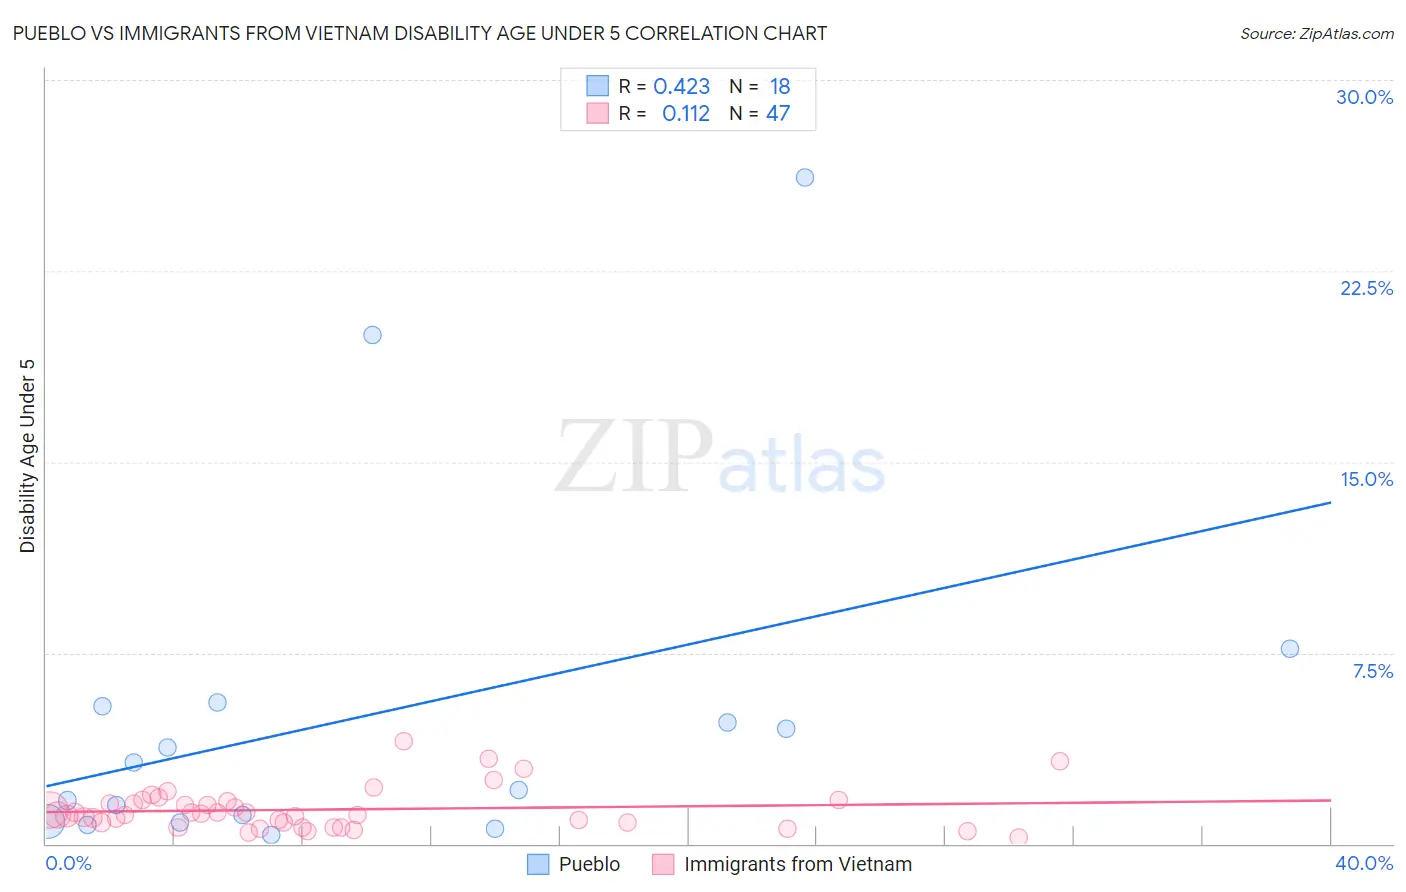
Pueblo vs Immigrants from Vietnam Disability Age Under 5 Correlation Chart
The statistical analysis conducted on geographies consisting of 91,796,516 people shows a moderate positive correlation between the proportion of Pueblo and percentage of population with a disability under the age of 5 in the United States with a correlation coefficient (R) of 0.423 and weighted average of 1.3%. Similarly, the statistical analysis conducted on geographies consisting of 220,992,476 people shows a poor positive correlation between the proportion of Immigrants from Vietnam and percentage of population with a disability under the age of 5 in the United States with a correlation coefficient (R) of 0.112 and weighted average of 1.1%, a difference of 20.2%.
Disability Age Under 5 Correlation Summary
| Measurement | Pueblo | Immigrants from Vietnam |
| Minimum | 0.37% | 0.25% |
| Maximum | 26.2% | 4.0% |
| Range | 25.8% | 3.8% |
| Mean | 5.1% | 1.3% |
| Median | 2.7% | 1.1% |
| Interquartile 25% (IQ1) | 0.86% | 0.81% |
| Interquartile 75% (IQ3) | 5.4% | 1.7% |
| Interquartile Range (IQR) | 4.5% | 0.87% |
| Standard Deviation (Sample) | 7.0% | 0.81% |
| Standard Deviation (Population) | 6.8% | 0.80% |
Similar Demographics by Disability Age Under 5
Demographics Similar to Pueblo by Disability Age Under 5
In terms of disability age under 5, the demographic groups most similar to Pueblo are Central American Indian (1.3%, a difference of 0.070%), Tongan (1.3%, a difference of 0.26%), South American Indian (1.3%, a difference of 0.27%), French American Indian (1.3%, a difference of 0.38%), and Immigrants from Northern Europe (1.3%, a difference of 0.51%).
| Demographics | Rating | Rank | Disability Age Under 5 |
| Taiwanese | 6.1 /100 | #227 | Tragic 1.3% |
| Luxembourgers | 6.1 /100 | #228 | Tragic 1.3% |
| Immigrants | Costa Rica | 5.5 /100 | #229 | Tragic 1.3% |
| Lebanese | 5.3 /100 | #230 | Tragic 1.3% |
| Immigrants | Northern Europe | 4.7 /100 | #231 | Tragic 1.3% |
| French American Indians | 4.5 /100 | #232 | Tragic 1.3% |
| Tongans | 4.2 /100 | #233 | Tragic 1.3% |
| Pueblo | 3.8 /100 | #234 | Tragic 1.3% |
| Central American Indians | 3.6 /100 | #235 | Tragic 1.3% |
| South American Indians | 3.3 /100 | #236 | Tragic 1.3% |
| Basques | 3.0 /100 | #237 | Tragic 1.3% |
| Spanish American Indians | 2.4 /100 | #238 | Tragic 1.3% |
| Immigrants | Austria | 2.3 /100 | #239 | Tragic 1.3% |
| Native Hawaiians | 2.2 /100 | #240 | Tragic 1.3% |
| Maltese | 2.2 /100 | #241 | Tragic 1.3% |
Demographics Similar to Immigrants from Vietnam by Disability Age Under 5
In terms of disability age under 5, the demographic groups most similar to Immigrants from Vietnam are Immigrants from Switzerland (1.1%, a difference of 0.11%), Immigrants from Ethiopia (1.1%, a difference of 0.12%), Immigrants from Western Asia (1.1%, a difference of 0.18%), Egyptian (1.1%, a difference of 0.46%), and Immigrants from Korea (1.1%, a difference of 0.80%).
| Demographics | Rating | Rank | Disability Age Under 5 |
| Ecuadorians | 99.5 /100 | #56 | Exceptional 1.1% |
| Assyrians/Chaldeans/Syriacs | 99.5 /100 | #57 | Exceptional 1.1% |
| Immigrants | Egypt | 99.4 /100 | #58 | Exceptional 1.1% |
| Immigrants | Malaysia | 99.4 /100 | #59 | Exceptional 1.1% |
| Immigrants | Western Asia | 99.2 /100 | #60 | Exceptional 1.1% |
| Immigrants | Ethiopia | 99.2 /100 | #61 | Exceptional 1.1% |
| Immigrants | Switzerland | 99.2 /100 | #62 | Exceptional 1.1% |
| Immigrants | Vietnam | 99.1 /100 | #63 | Exceptional 1.1% |
| Egyptians | 98.9 /100 | #64 | Exceptional 1.1% |
| Immigrants | Korea | 98.8 /100 | #65 | Exceptional 1.1% |
| Immigrants | Indonesia | 98.7 /100 | #66 | Exceptional 1.1% |
| Immigrants | Belize | 98.7 /100 | #67 | Exceptional 1.1% |
| South Africans | 98.7 /100 | #68 | Exceptional 1.1% |
| Israelis | 98.7 /100 | #69 | Exceptional 1.1% |
| Immigrants | Ecuador | 98.6 /100 | #70 | Exceptional 1.1% |