Pueblo vs Immigrants from Afghanistan Disability Age Under 5
COMPARE
Pueblo
Immigrants from Afghanistan
Disability Age Under 5
Disability Age Under 5 Comparison
Pueblo
Immigrants from Afghanistan
1.3%
DISABILITY AGE UNDER 5
3.8/ 100
METRIC RATING
234th/ 347
METRIC RANK
0.91%
DISABILITY AGE UNDER 5
100.0/ 100
METRIC RATING
7th/ 347
METRIC RANK
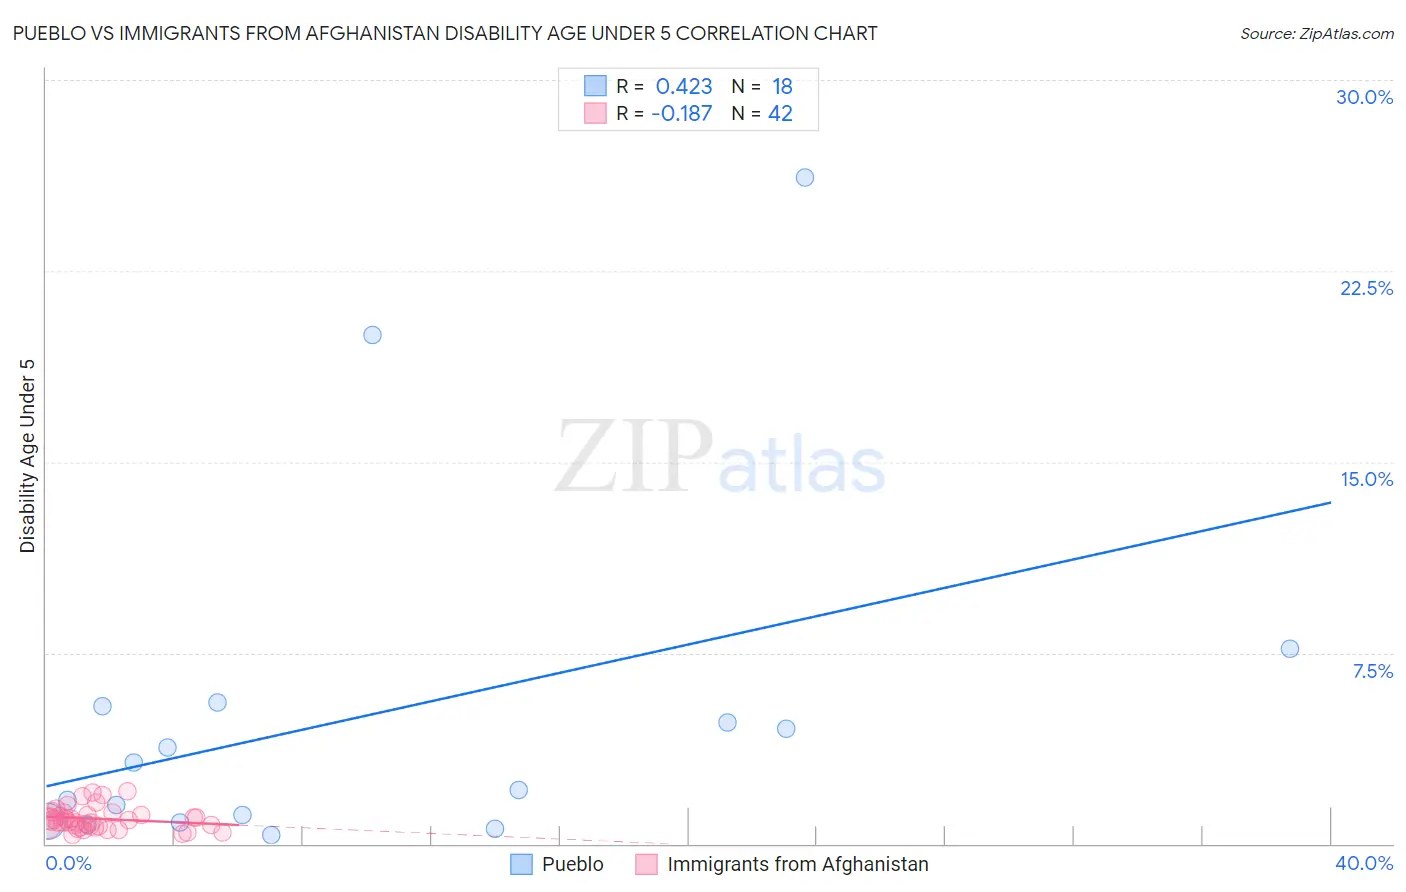
Pueblo vs Immigrants from Afghanistan Disability Age Under 5 Correlation Chart
The statistical analysis conducted on geographies consisting of 91,796,516 people shows a moderate positive correlation between the proportion of Pueblo and percentage of population with a disability under the age of 5 in the United States with a correlation coefficient (R) of 0.423 and weighted average of 1.3%. Similarly, the statistical analysis conducted on geographies consisting of 107,593,919 people shows a poor negative correlation between the proportion of Immigrants from Afghanistan and percentage of population with a disability under the age of 5 in the United States with a correlation coefficient (R) of -0.187 and weighted average of 0.91%, a difference of 46.8%.
Disability Age Under 5 Correlation Summary
| Measurement | Pueblo | Immigrants from Afghanistan |
| Minimum | 0.37% | 0.36% |
| Maximum | 26.2% | 2.1% |
| Range | 25.8% | 1.7% |
| Mean | 5.1% | 0.98% |
| Median | 2.7% | 0.88% |
| Interquartile 25% (IQ1) | 0.86% | 0.68% |
| Interquartile 75% (IQ3) | 5.4% | 1.2% |
| Interquartile Range (IQR) | 4.5% | 0.47% |
| Standard Deviation (Sample) | 7.0% | 0.44% |
| Standard Deviation (Population) | 6.8% | 0.43% |
Similar Demographics by Disability Age Under 5
Demographics Similar to Pueblo by Disability Age Under 5
In terms of disability age under 5, the demographic groups most similar to Pueblo are Central American Indian (1.3%, a difference of 0.070%), Tongan (1.3%, a difference of 0.26%), South American Indian (1.3%, a difference of 0.27%), French American Indian (1.3%, a difference of 0.38%), and Immigrants from Northern Europe (1.3%, a difference of 0.51%).
| Demographics | Rating | Rank | Disability Age Under 5 |
| Taiwanese | 6.1 /100 | #227 | Tragic 1.3% |
| Luxembourgers | 6.1 /100 | #228 | Tragic 1.3% |
| Immigrants | Costa Rica | 5.5 /100 | #229 | Tragic 1.3% |
| Lebanese | 5.3 /100 | #230 | Tragic 1.3% |
| Immigrants | Northern Europe | 4.7 /100 | #231 | Tragic 1.3% |
| French American Indians | 4.5 /100 | #232 | Tragic 1.3% |
| Tongans | 4.2 /100 | #233 | Tragic 1.3% |
| Pueblo | 3.8 /100 | #234 | Tragic 1.3% |
| Central American Indians | 3.6 /100 | #235 | Tragic 1.3% |
| South American Indians | 3.3 /100 | #236 | Tragic 1.3% |
| Basques | 3.0 /100 | #237 | Tragic 1.3% |
| Spanish American Indians | 2.4 /100 | #238 | Tragic 1.3% |
| Immigrants | Austria | 2.3 /100 | #239 | Tragic 1.3% |
| Native Hawaiians | 2.2 /100 | #240 | Tragic 1.3% |
| Maltese | 2.2 /100 | #241 | Tragic 1.3% |
Demographics Similar to Immigrants from Afghanistan by Disability Age Under 5
In terms of disability age under 5, the demographic groups most similar to Immigrants from Afghanistan are Immigrants from Yemen (0.91%, a difference of 0.13%), Immigrants from Fiji (0.92%, a difference of 1.2%), Marshallese (0.94%, a difference of 3.4%), Afghan (0.94%, a difference of 4.1%), and Immigrants from Grenada (0.94%, a difference of 4.2%).
| Demographics | Rating | Rank | Disability Age Under 5 |
| Immigrants | Armenia | 100.0 /100 | #1 | Exceptional 0.76% |
| Immigrants | St. Vincent and the Grenadines | 100.0 /100 | #2 | Exceptional 0.79% |
| Vietnamese | 100.0 /100 | #3 | Exceptional 0.81% |
| Immigrants | Uzbekistan | 100.0 /100 | #4 | Exceptional 0.85% |
| Immigrants | Bangladesh | 100.0 /100 | #5 | Exceptional 0.85% |
| Ute | 100.0 /100 | #6 | Exceptional 0.86% |
| Immigrants | Afghanistan | 100.0 /100 | #7 | Exceptional 0.91% |
| Immigrants | Yemen | 100.0 /100 | #8 | Exceptional 0.91% |
| Immigrants | Fiji | 100.0 /100 | #9 | Exceptional 0.92% |
| Marshallese | 100.0 /100 | #10 | Exceptional 0.94% |
| Afghans | 100.0 /100 | #11 | Exceptional 0.94% |
| Immigrants | Grenada | 100.0 /100 | #12 | Exceptional 0.94% |
| Soviet Union | 100.0 /100 | #13 | Exceptional 0.95% |
| Yuman | 100.0 /100 | #14 | Exceptional 0.95% |
| Immigrants | Hong Kong | 100.0 /100 | #15 | Exceptional 0.95% |