Area Code 479 Map & Demographics
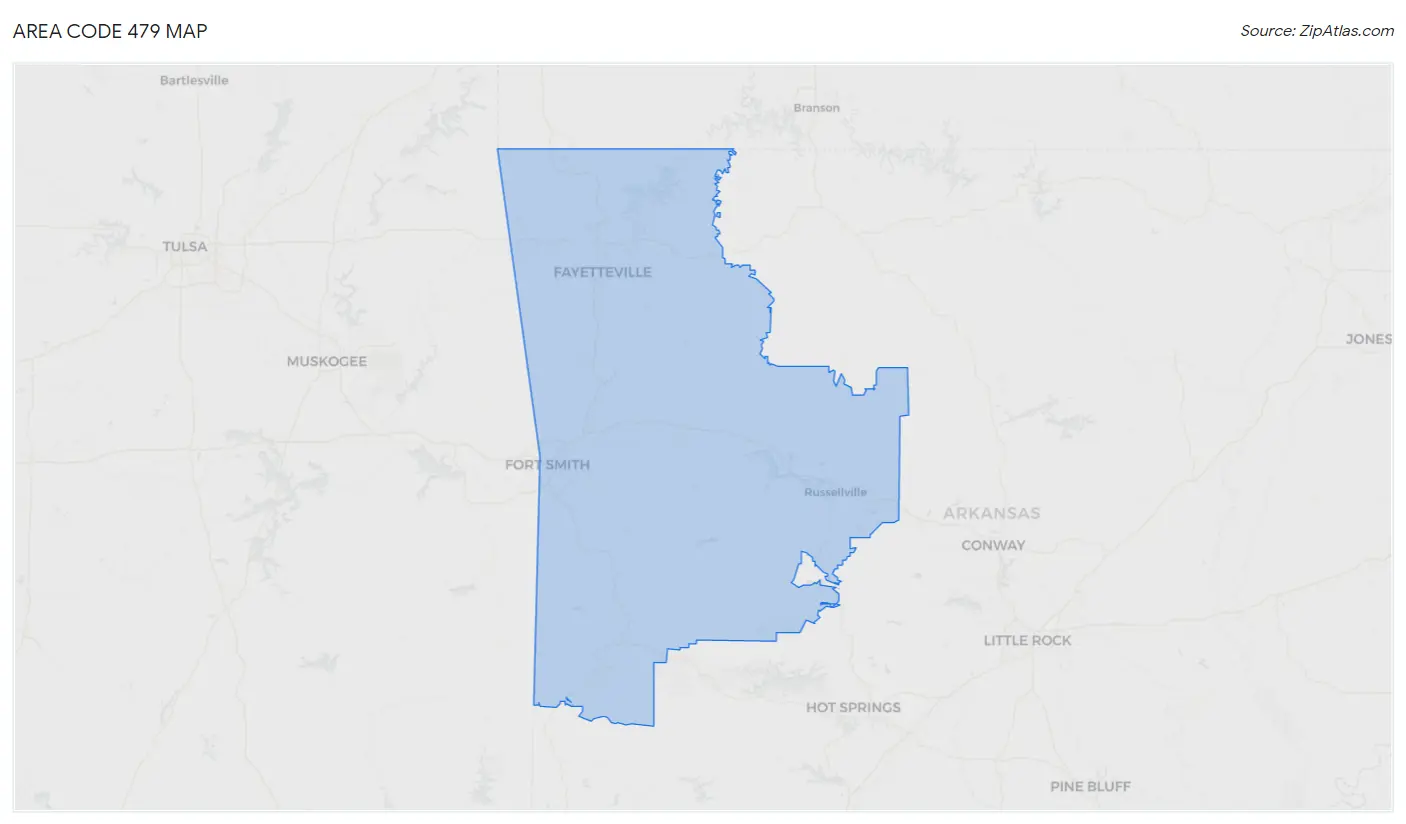
Area Code 479 Map
Area Code 479 Overview
$29,778
PER CAPITA INCOME
$69,818
AVG FAMILY INCOME
$58,367
AVG HOUSEHOLD INCOME
27.4%
WAGE / INCOME GAP [ % ]
72.6¢/ $1
WAGE / INCOME GAP [ $ ]
$9,701
FAMILY INCOME DEFICIT
44.19
INEQUALITY / GINI INDEX
895,337
TOTAL POPULATION
447,356
MALE POPULATION
447,981
FEMALE POPULATION
99.86
MALES / 100 FEMALES
100.14
FEMALES / 100 MALES
43.6
MEDIAN AGE
3.0
AVG FAMILY SIZE
2.5
AVG HOUSEHOLD SIZE
375,228
LABOR FORCE [ PEOPLE ]
53.1%
PERCENT IN LABOR FORCE
4.5%
UNEMPLOYMENT RATE
Income in Area Code 479
Income Overview in Area Code 479
Per Capita Income in Area Code 479 is $29,778, while median incomes of families and households are $69,818 and $58,367 respectively.
| Characteristic | Number | Measure |
| Per Capita Income | 895,337 | $29,778 |
| Median Family Income | 229,103 | $69,818 |
| Mean Family Income | 229,103 | $8,926,694 |
| Median Household Income | 339,554 | $58,367 |
| Mean Household Income | 339,554 | $7,788,373 |
| Income Deficit | 229,103 | $9,701 |
| Wage / Income Gap (%) | 895,337 | 27.40% |
| Wage / Income Gap ($) | 895,337 | 72.60¢ per $1 |
| Gini / Inequality Index | 895,337 | 44.19 |
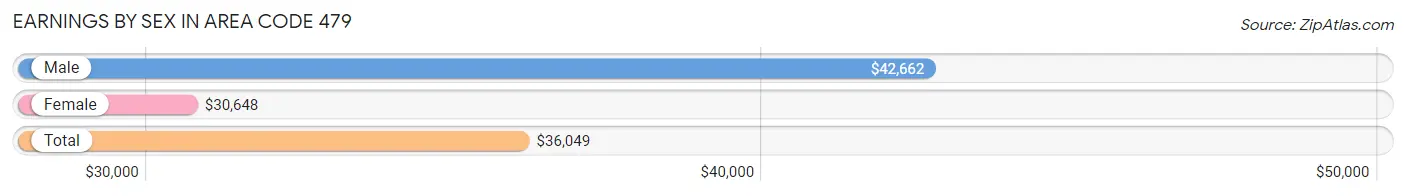
Earnings by Sex in Area Code 479
Average Earnings in Area Code 479 are $36,049, $42,662 for men and $30,648 for women, a difference of 28.2%.
| Sex | Number | Average Earnings |
| Male | 245,316 (54.1%) | $42,662 |
| Female | 208,305 (45.9%) | $30,648 |
| Total | 453,621 (100.0%) | $36,049 |
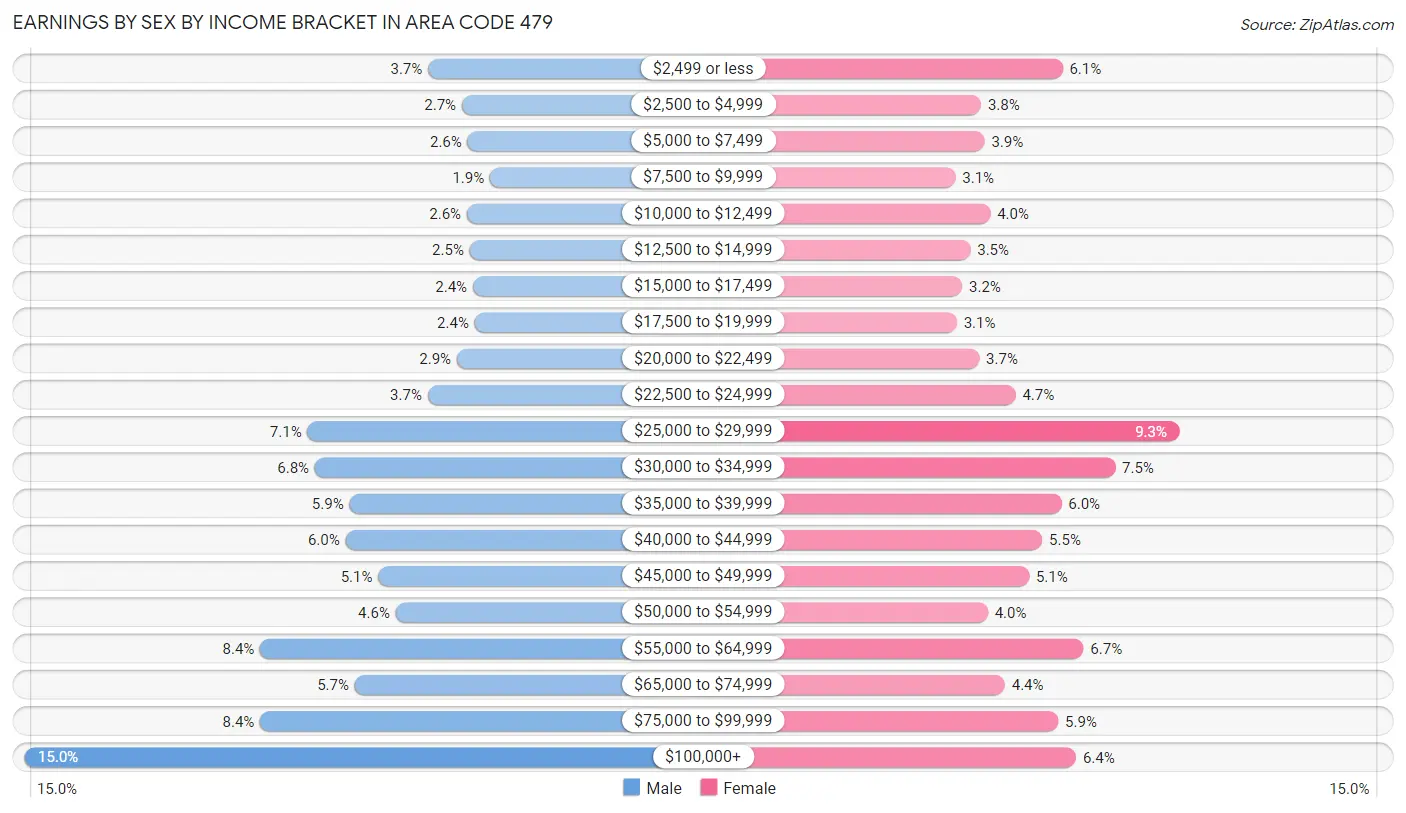
Earnings by Sex by Income Bracket in Area Code 479
The most common earnings brackets in Area Code 479 are $100,000+ for men (36,772 | 15.0%) and $25,000 to $29,999 for women (19,442 | 9.3%).
| Income | Male | Female |
| $2,499 or less | 8,968 (3.7%) | 12,626 (6.1%) |
| $2,500 to $4,999 | 6,656 (2.7%) | 7,849 (3.8%) |
| $5,000 to $7,499 | 6,261 (2.5%) | 8,056 (3.9%) |
| $7,500 to $9,999 | 4,702 (1.9%) | 6,355 (3.0%) |
| $10,000 to $12,499 | 6,294 (2.6%) | 8,392 (4.0%) |
| $12,500 to $14,999 | 6,103 (2.5%) | 7,237 (3.5%) |
| $15,000 to $17,499 | 5,893 (2.4%) | 6,755 (3.2%) |
| $17,500 to $19,999 | 5,774 (2.4%) | 6,444 (3.1%) |
| $20,000 to $22,499 | 6,995 (2.9%) | 7,754 (3.7%) |
| $22,500 to $24,999 | 8,992 (3.7%) | 9,877 (4.7%) |
| $25,000 to $29,999 | 17,296 (7.0%) | 19,442 (9.3%) |
| $30,000 to $34,999 | 16,781 (6.8%) | 15,707 (7.5%) |
| $35,000 to $39,999 | 14,389 (5.9%) | 12,568 (6.0%) |
| $40,000 to $44,999 | 14,659 (6.0%) | 11,429 (5.5%) |
| $45,000 to $49,999 | 12,412 (5.1%) | 10,666 (5.1%) |
| $50,000 to $54,999 | 11,215 (4.6%) | 8,250 (4.0%) |
| $55,000 to $64,999 | 20,548 (8.4%) | 13,855 (6.7%) |
| $65,000 to $74,999 | 14,038 (5.7%) | 9,253 (4.4%) |
| $75,000 to $99,999 | 20,568 (8.4%) | 12,369 (5.9%) |
| $100,000+ | 36,772 (15.0%) | 13,421 (6.4%) |
| Total | 245,316 (100.0%) | 208,305 (100.0%) |
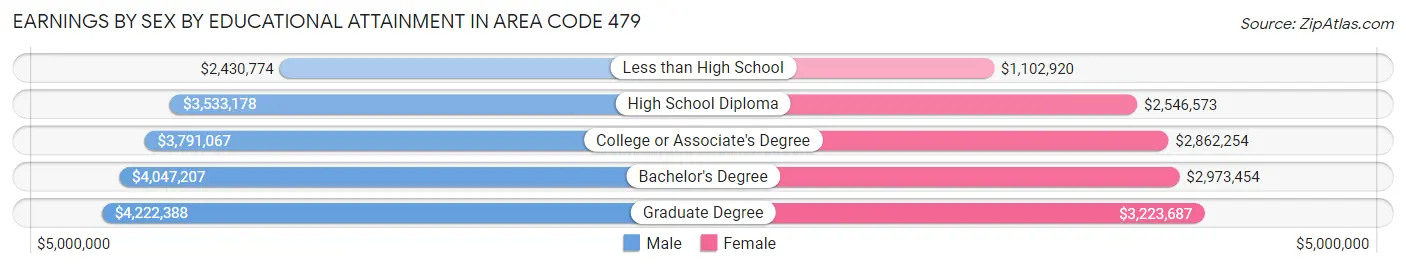
Earnings by Sex by Educational Attainment in Area Code 479
Average earnings in Area Code 479 are $4,365,539 for men and $3,022,118 for women, a difference of 30.8%. Men with an educational attainment of graduate degree enjoy the highest average annual earnings of $4,222,388, while those with less than high school education earn the least with $2,430,774. Women with an educational attainment of graduate degree earn the most with the average annual earnings of $3,223,687, while those with less than high school education have the smallest earnings of $1,102,920.
| Educational Attainment | Male Income | Female Income |
| Less than High School | $2,430,774 | $1,102,920 |
| High School Diploma | $3,533,178 | $2,546,573 |
| College or Associate's Degree | $3,791,067 | $2,862,254 |
| Bachelor's Degree | $4,047,207 | $2,973,454 |
| Graduate Degree | $4,222,388 | $3,223,687 |
| Total | $4,365,539 | $3,022,118 |
Family Income in Area Code 479
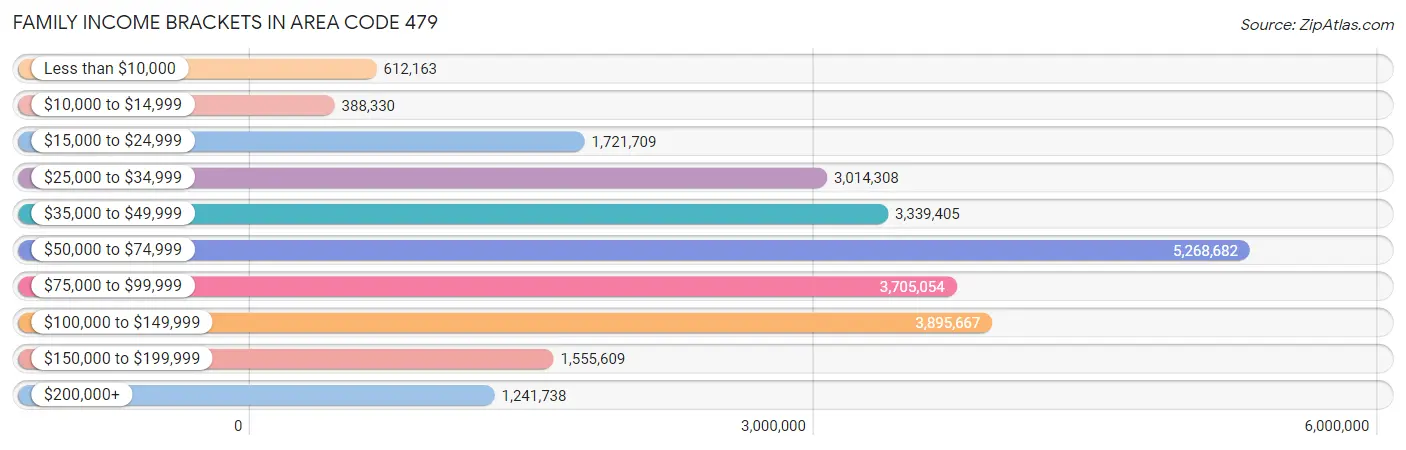
Family Income Brackets in Area Code 479
According to the Area Code 479 family income data, there are 5,268,682 families falling into the $50,000 to $74,999 income range, which is the most common income bracket and makes up 2,299.7% of all families. Conversely, the $10,000 to $14,999 income bracket is the least frequent group with only 388,330 families (169.5%) belonging to this category.
| Income Bracket | # Families | % Families |
| Less than $10,000 | 612,163 | 267.2% |
| $10,000 to $14,999 | 388,330 | 169.5% |
| $15,000 to $24,999 | 1,721,709 | 751.5% |
| $25,000 to $34,999 | 3,014,308 | 1,315.7% |
| $35,000 to $49,999 | 3,339,405 | 1,457.6% |
| $50,000 to $74,999 | 5,268,682 | 2,299.7% |
| $75,000 to $99,999 | 3,705,054 | 1,617.2% |
| $100,000 to $149,999 | 3,895,667 | 1,700.4% |
| $150,000 to $199,999 | 1,555,609 | 679.0% |
| $200,000+ | 1,241,738 | 542.0% |
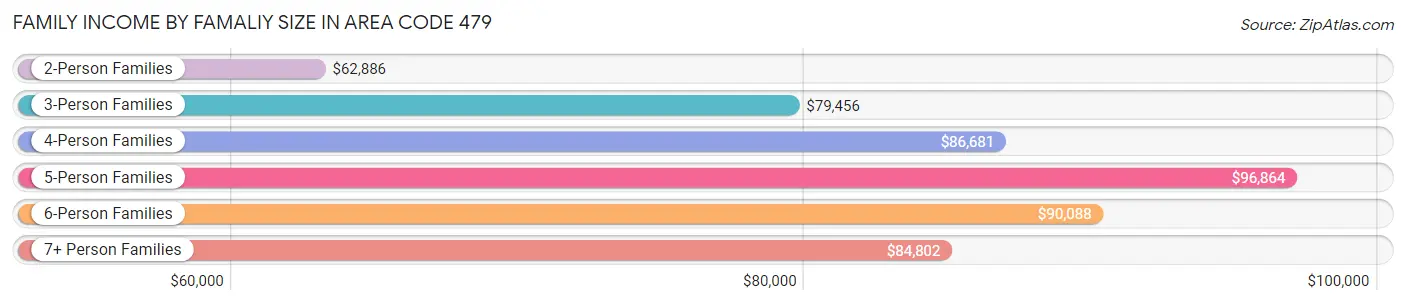
Family Income by Famaliy Size in Area Code 479
5-person families (20,006 | 8.7%) account for the highest median family income in Area Code 479 with $96,864 per family, while 2-person families (106,665 | 46.6%) have the highest median income of $31,443 per family member.
| Income Bracket | # Families | Median Income |
| 2-Person Families | 106,665 (46.6%) | $62,886 |
| 3-Person Families | 50,803 (22.2%) | $79,456 |
| 4-Person Families | 38,983 (17.0%) | $86,681 |
| 5-Person Families | 20,006 (8.7%) | $96,864 |
| 6-Person Families | 8,386 (3.7%) | $90,088 |
| 7+ Person Families | 4,260 (1.9%) | $84,802 |
| Total | 229,103 (100.0%) | $69,818 |
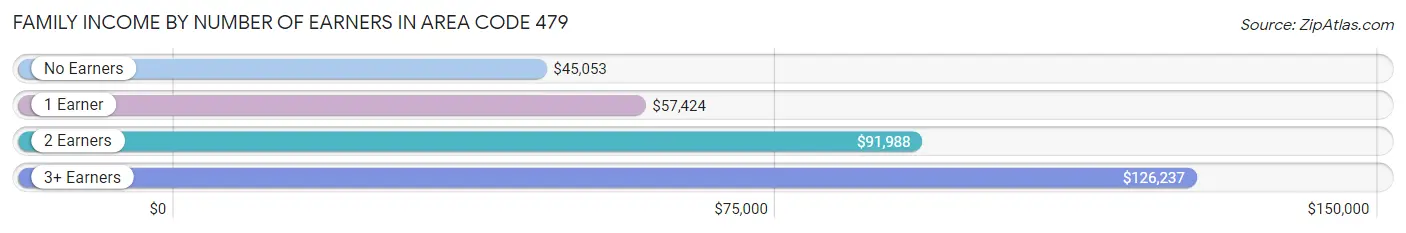
Family Income by Number of Earners in Area Code 479
The median family income in Area Code 479 is $69,818, with families comprising 3+ earners (20,460) having the highest median family income of $126,237, while families with no earners (35,576) have the lowest median family income of $45,053, accounting for 8.9% and 15.5% of families, respectively.
| Number of Earners | # Families | Median Income |
| No Earners | 35,576 (15.5%) | $45,053 |
| 1 Earner | 77,362 (33.8%) | $57,424 |
| 2 Earners | 95,705 (41.8%) | $91,988 |
| 3+ Earners | 20,460 (8.9%) | $126,237 |
| Total | 229,103 (100.0%) | $69,818 |
Household Income in Area Code 479
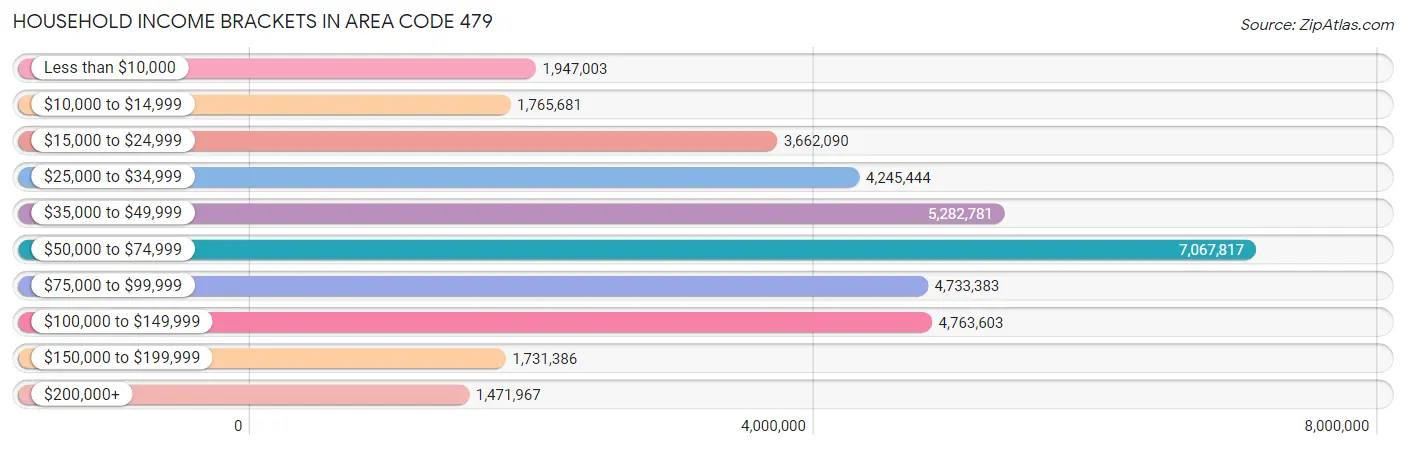
Household Income Brackets in Area Code 479
With 7,067,817 households falling in the category, the $50,000 to $74,999 income range is the most frequent in Area Code 479, accounting for 2,081.5% of all households. In contrast, only 1,471,967 households (433.5%) fall into the $200,000+ income bracket, making it the least populous group.
| Income Bracket | # Households | % Households |
| Less than $10,000 | 1,947,003 | 573.4% |
| $10,000 to $14,999 | 1,765,681 | 520.0% |
| $15,000 to $24,999 | 3,662,090 | 1,078.5% |
| $25,000 to $34,999 | 4,245,444 | 1,250.3% |
| $35,000 to $49,999 | 5,282,781 | 1,555.8% |
| $50,000 to $74,999 | 7,067,817 | 2,081.5% |
| $75,000 to $99,999 | 4,733,383 | 1,394.0% |
| $100,000 to $149,999 | 4,763,603 | 1,402.9% |
| $150,000 to $199,999 | 1,731,386 | 509.9% |
| $200,000+ | 1,471,967 | 433.5% |
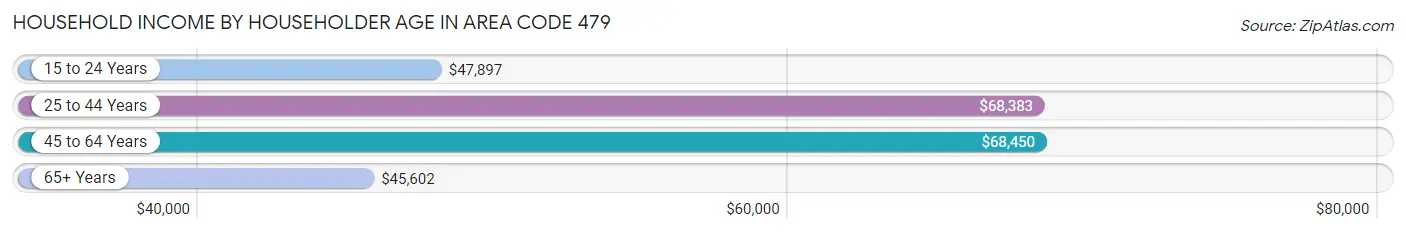
Household Income by Householder Age in Area Code 479
The median household income in Area Code 479 is $58,367, with the highest median household income of $68,450 found in the 45 to 64 years age bracket for the primary householder. A total of 120,323 households (35.4%) fall into this category. Meanwhile, the 65+ years age bracket for the primary householder has the lowest median household income of $45,602, with 83,668 households (24.6%) in this group.
| Income Bracket | # Households | Median Income |
| 15 to 24 Years | 20,537 (6.0%) | $47,897 |
| 25 to 44 Years | 115,026 (33.9%) | $68,383 |
| 45 to 64 Years | 120,323 (35.4%) | $68,450 |
| 65+ Years | 83,668 (24.6%) | $45,602 |
| Total | 339,554 (100.0%) | $58,367 |
Poverty in Area Code 479
Income Below Poverty by Sex and Age in Area Code 479
With 12.5% poverty level for males and 15.1% for females among the residents of Area Code 479, under 5 year old males and 18 to 24 year old females are the most vulnerable to poverty, with 6,295 males (22.4%) and 11,518 females (28.7%) in their respective age groups living below the poverty level.
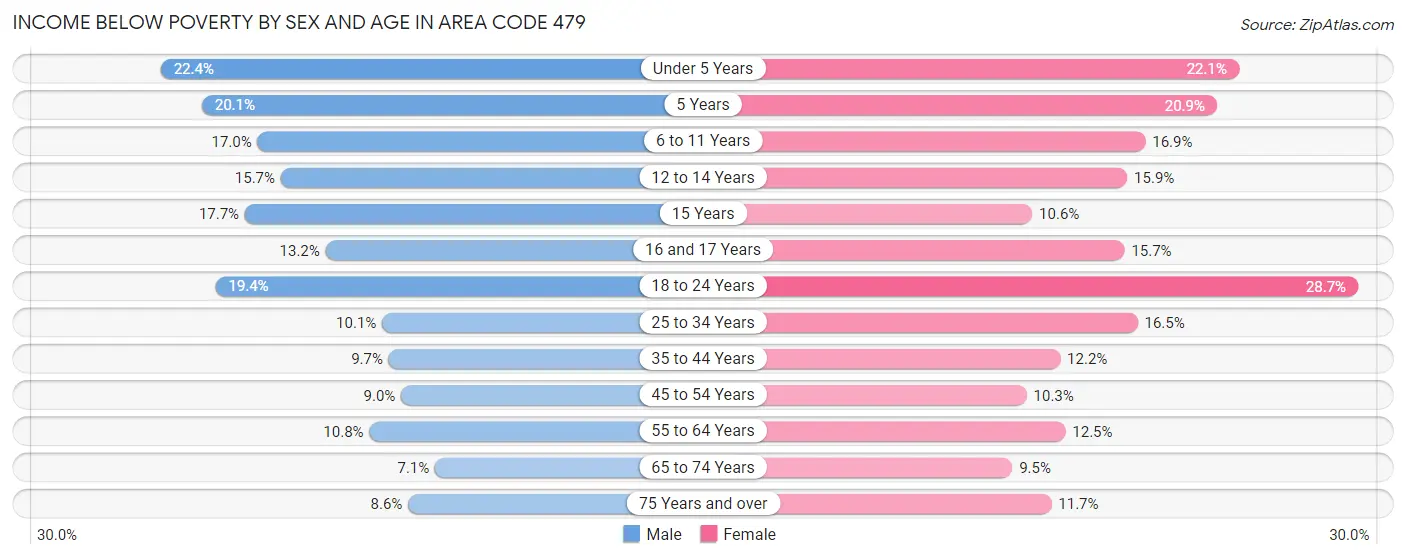
| Age Bracket | Male | Female |
| Under 5 Years | 6,295 (22.4%) | 5,911 (22.1%) |
| 5 Years | 1,135 (20.1%) | 1,182 (20.9%) |
| 6 to 11 Years | 6,301 (17.0%) | 5,926 (16.9%) |
| 12 to 14 Years | 2,823 (15.7%) | 2,714 (15.9%) |
| 15 Years | 1,084 (17.7%) | 662 (10.6%) |
| 16 and 17 Years | 1,708 (13.2%) | 1,911 (15.7%) |
| 18 to 24 Years | 8,438 (19.4%) | 11,518 (28.7%) |
| 25 to 34 Years | 6,130 (10.1%) | 9,748 (16.5%) |
| 35 to 44 Years | 5,677 (9.7%) | 6,862 (12.2%) |
| 45 to 54 Years | 4,854 (9.0%) | 5,449 (10.3%) |
| 55 to 64 Years | 5,690 (10.8%) | 6,643 (12.4%) |
| 65 to 74 Years | 2,696 (7.1%) | 3,940 (9.5%) |
| 75 Years and over | 1,939 (8.6%) | 3,566 (11.7%) |
| Total | 54,770 (12.5%) | 66,032 (15.1%) |
Income Above Poverty by Sex and Age in Area Code 479
According to the poverty statistics in Area Code 479, males aged 65 to 74 years and females aged 65 to 74 years are the age groups that are most secure financially, with 92.9% of males and 90.5% of females in these age groups living above the poverty line.
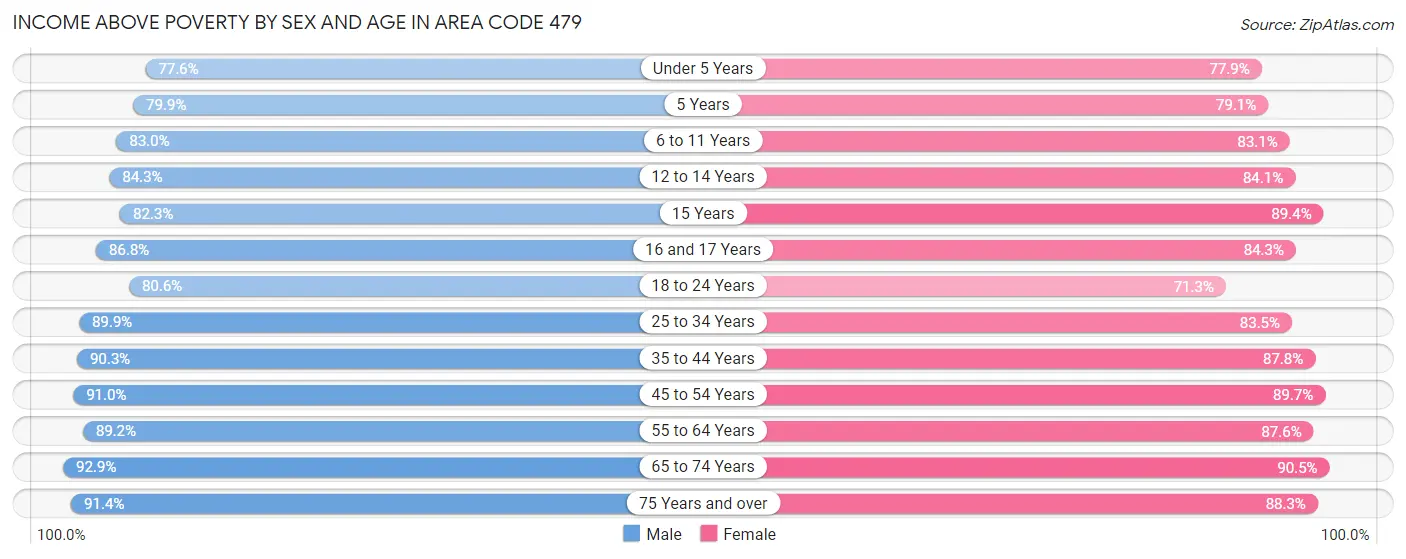
| Age Bracket | Male | Female |
| Under 5 Years | 21,777 (77.6%) | 20,831 (77.9%) |
| 5 Years | 4,503 (79.9%) | 4,480 (79.1%) |
| 6 to 11 Years | 30,691 (83.0%) | 29,134 (83.1%) |
| 12 to 14 Years | 15,118 (84.3%) | 14,364 (84.1%) |
| 15 Years | 5,029 (82.3%) | 5,586 (89.4%) |
| 16 and 17 Years | 11,197 (86.8%) | 10,231 (84.3%) |
| 18 to 24 Years | 35,134 (80.6%) | 28,564 (71.3%) |
| 25 to 34 Years | 54,609 (89.9%) | 49,435 (83.5%) |
| 35 to 44 Years | 52,714 (90.3%) | 49,553 (87.8%) |
| 45 to 54 Years | 48,880 (91.0%) | 47,521 (89.7%) |
| 55 to 64 Years | 47,015 (89.2%) | 46,699 (87.5%) |
| 65 to 74 Years | 35,062 (92.9%) | 37,568 (90.5%) |
| 75 Years and over | 20,516 (91.4%) | 26,993 (88.3%) |
| Total | 382,245 (87.5%) | 370,959 (84.9%) |
Income Below Poverty Among Married-Couple Families in Area Code 479
The poverty statistics for married-couple families in Area Code 479 show that 5.1% or 8,966 of the total 174,690 families live below the poverty line. Families with 5 or more children have the highest poverty rate of 25.3%, comprising of 441 families. On the other hand, families with no children have the lowest poverty rate of 3.2%, which includes 3,165 families.
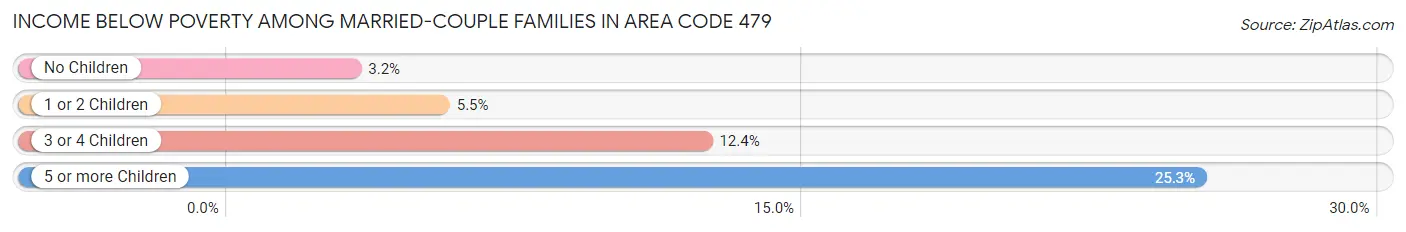
| Children | Above Poverty | Below Poverty |
| No Children | 95,278 (96.8%) | 3,165 (3.2%) |
| 1 or 2 Children | 53,322 (94.5%) | 3,123 (5.5%) |
| 3 or 4 Children | 15,822 (87.6%) | 2,237 (12.4%) |
| 5 or more Children | 1,302 (74.7%) | 441 (25.3%) |
| Total | 165,724 (94.9%) | 8,966 (5.1%) |
Income Below Poverty Among Single-Parent Households in Area Code 479
According to the poverty data in Area Code 479, 15.7% or 2,656 single-father households and 25.2% or 9,470 single-mother households are living below the poverty line. Among single-father households, those with 5 or more children have the highest poverty rate, with 244 households (69.1%) experiencing poverty. Likewise, among single-mother households, those with 3 or 4 children have the highest poverty rate, with 2,762 households (55.2%) falling below the poverty line.
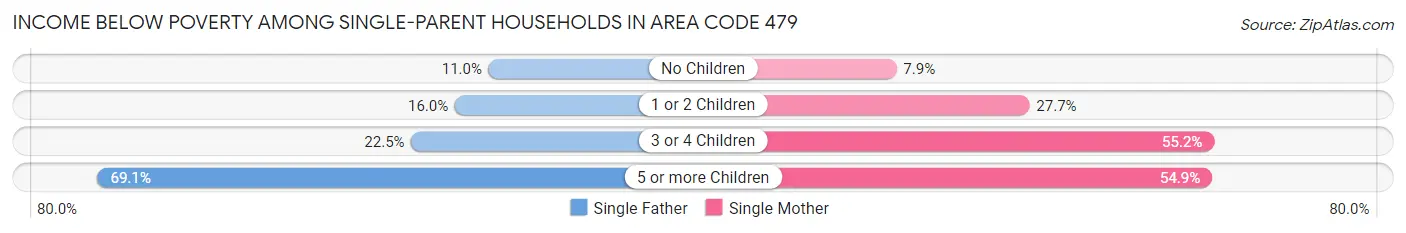
| Children | Single Father | Single Mother |
| No Children | 681 (11.0%) | 964 (7.9%) |
| 1 or 2 Children | 1,467 (16.0%) | 5,469 (27.7%) |
| 3 or 4 Children | 264 (22.5%) | 2,762 (55.2%) |
| 5 or more Children | 244 (69.1%) | 275 (54.9%) |
| Total | 2,656 (15.7%) | 9,470 (25.2%) |
Income Below Poverty Among Married-Couple vs Single-Parent Households in Area Code 479
The poverty data for Area Code 479 shows that 8,966 of the married-couple family households (5.1%) and 12,126 of the single-parent households (22.3%) are living below the poverty level. Within the married-couple family households, those with 5 or more children have the highest poverty rate, with 441 households (25.3%) falling below the poverty line. Among the single-parent households, those with 5 or more children have the highest poverty rate, with 519 household (60.8%) living below poverty.
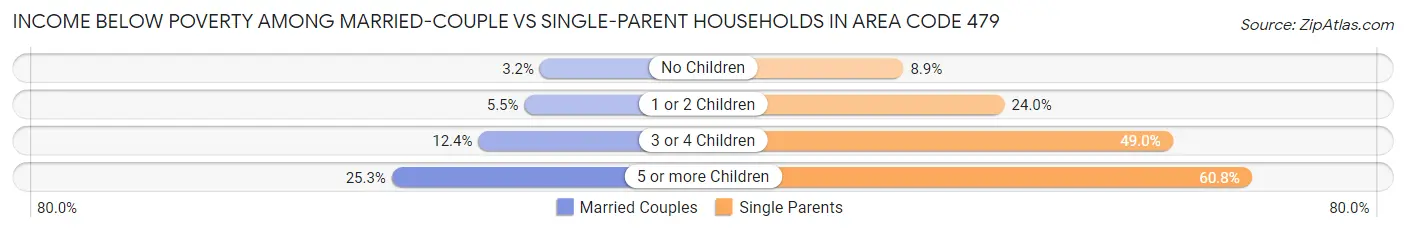
| Children | Married-Couple Families | Single-Parent Households |
| No Children | 3,165 (3.2%) | 1,645 (8.9%) |
| 1 or 2 Children | 3,123 (5.5%) | 6,936 (24.0%) |
| 3 or 4 Children | 2,237 (12.4%) | 3,026 (49.0%) |
| 5 or more Children | 441 (25.3%) | 519 (60.8%) |
| Total | 8,966 (5.1%) | 12,126 (22.3%) |
Race in Area Code 479
The most populous races in Area Code 479 are White / Caucasian (676,263 | 75.5%), Hispanic or Latino (132,792 | 14.8%), and Two or more Races (106,165 | 11.9%).
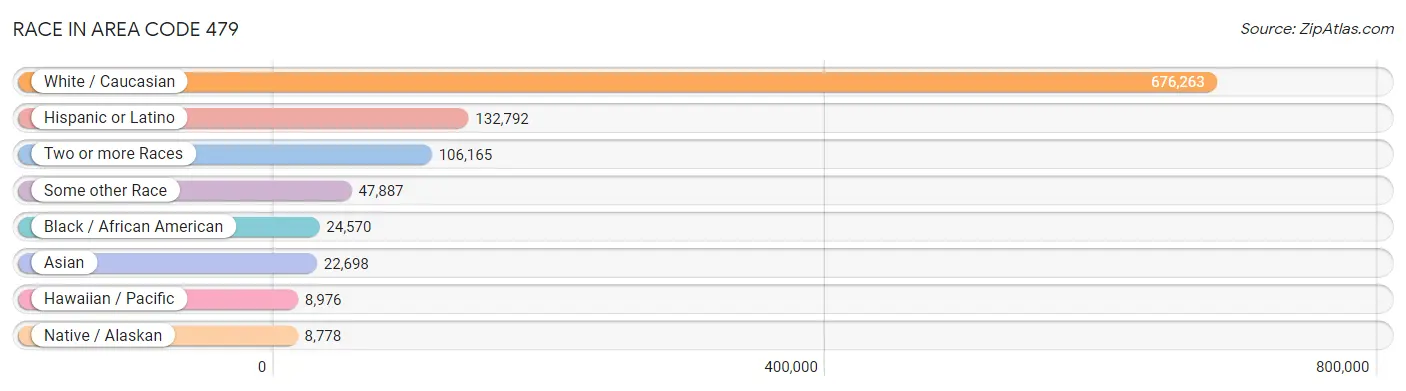
| Race | # Population | % Population |
| Asian | 22,698 | 2.5% |
| Black / African American | 24,570 | 2.7% |
| Hawaiian / Pacific | 8,976 | 1.0% |
| Hispanic or Latino | 132,792 | 14.8% |
| Native / Alaskan | 8,778 | 1.0% |
| White / Caucasian | 676,263 | 75.5% |
| Two or more Races | 106,165 | 11.9% |
| Some other Race | 47,887 | 5.3% |
| Total | 895,337 | 100.0% |
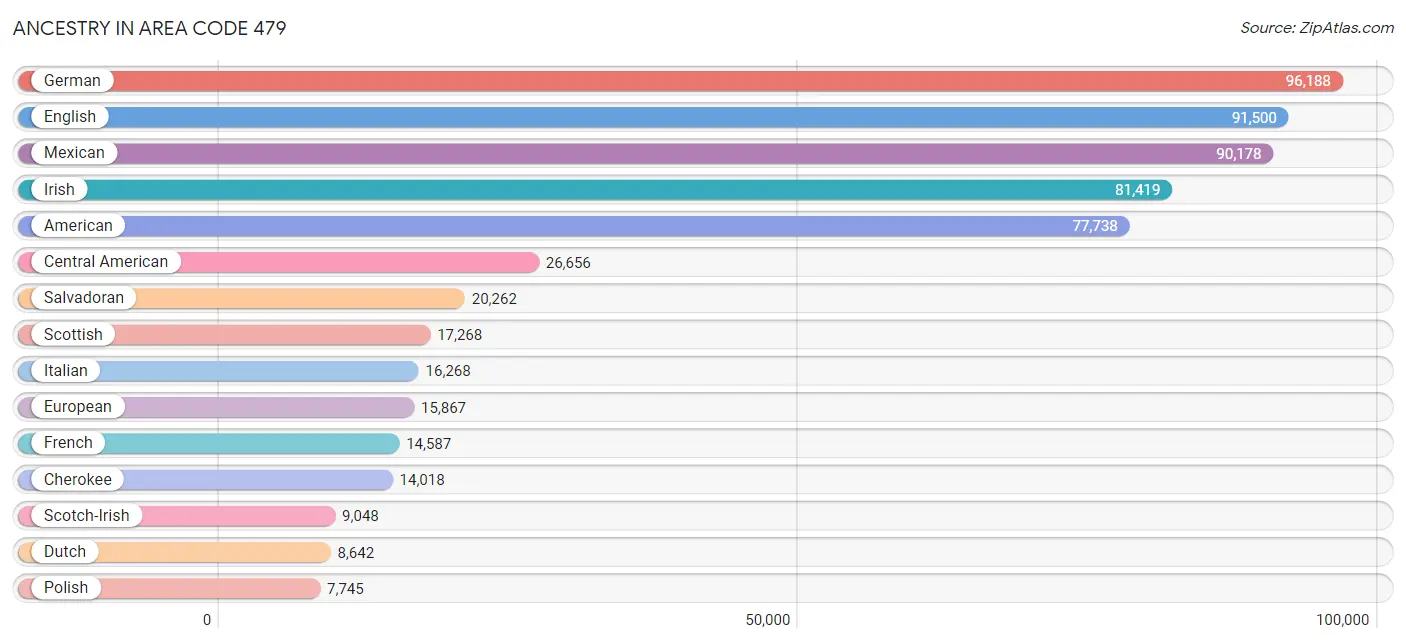
Ancestry in Area Code 479
The most populous ancestries reported in Area Code 479 are German (96,188 | 10.7%), English (91,500 | 10.2%), Mexican (90,178 | 10.1%), Irish (81,419 | 9.1%), and American (77,738 | 8.7%), together accounting for 48.8% of all Area Code 479 residents.
| Ancestry | # Population | % Population |
| Afghan | 29 | 0.0% |
| African | 1,102 | 0.1% |
| Alaska Native | 26 | 0.0% |
| Alaskan Athabascan | 12 | 0.0% |
| Albanian | 49 | 0.0% |
| Aleut | 260 | 0.0% |
| Alsatian | 12 | 0.0% |
| American | 77,738 | 8.7% |
| Apache | 535 | 0.1% |
| Arab | 2,001 | 0.2% |
| Arapaho | 2 | 0.0% |
| Argentinean | 157 | 0.0% |
| Armenian | 242 | 0.0% |
| Australian | 147 | 0.0% |
| Austrian | 1,112 | 0.1% |
| Bahamian | 28 | 0.0% |
| Bangladeshi | 1,741 | 0.2% |
| Barbadian | 14 | 0.0% |
| Basque | 2 | 0.0% |
| Belgian | 272 | 0.0% |
| Belizean | 76 | 0.0% |
| Bermudan | 9 | 0.0% |
| Bhutanese | 1,777 | 0.2% |
| Blackfeet | 508 | 0.1% |
| Bolivian | 136 | 0.0% |
| Brazilian | 659 | 0.1% |
| British | 6,395 | 0.7% |
| Bulgarian | 87 | 0.0% |
| Burmese | 1,650 | 0.2% |
| Cajun | 455 | 0.1% |
| Canadian | 938 | 0.1% |
| Celtic | 183 | 0.0% |
| Central American | 26,656 | 3.0% |
| Central American Indian | 937 | 0.1% |
| Cherokee | 14,018 | 1.6% |
| Cheyenne | 34 | 0.0% |
| Chickasaw | 253 | 0.0% |
| Chilean | 120 | 0.0% |
| Chinese | 66 | 0.0% |
| Chippewa | 142 | 0.0% |
| Choctaw | 3,294 | 0.4% |
| Colombian | 847 | 0.1% |
| Comanche | 142 | 0.0% |
| Costa Rican | 404 | 0.1% |
| Cree | 4 | 0.0% |
| Creek | 583 | 0.1% |
| Croatian | 135 | 0.0% |
| Cuban | 881 | 0.1% |
| Czech | 2,826 | 0.3% |
| Czechoslovakian | 452 | 0.1% |
| Danish | 1,829 | 0.2% |
| Delaware | 131 | 0.0% |
| Dominican | 783 | 0.1% |
| Dutch | 8,642 | 1.0% |
| Dutch West Indian | 542 | 0.1% |
| Eastern European | 1,183 | 0.1% |
| Ecuadorian | 276 | 0.0% |
| Egyptian | 339 | 0.0% |
| English | 91,500 | 10.2% |
| Estonian | 36 | 0.0% |
| Ethiopian | 24 | 0.0% |
| European | 15,867 | 1.8% |
| Fijian | 7,523 | 0.8% |
| Filipino | 147 | 0.0% |
| Finnish | 794 | 0.1% |
| French | 14,587 | 1.6% |
| French American Indian | 13 | 0.0% |
| French Canadian | 1,751 | 0.2% |
| German | 96,188 | 10.7% |
| German Russian | 8 | 0.0% |
| Greek | 1,139 | 0.1% |
| Guamanian / Chamorro | 132 | 0.0% |
| Guatemalan | 3,556 | 0.4% |
| Haitian | 417 | 0.1% |
| Honduran | 1,917 | 0.2% |
| Hopi | 1 | 0.0% |
| Houma | 16 | 0.0% |
| Hungarian | 1,027 | 0.1% |
| Icelander | 72 | 0.0% |
| Indian (Asian) | 3,198 | 0.4% |
| Indonesian | 497 | 0.1% |
| Inupiat | 34 | 0.0% |
| Iranian | 372 | 0.0% |
| Iraqi | 188 | 0.0% |
| Irish | 81,419 | 9.1% |
| Iroquois | 77 | 0.0% |
| Israeli | 61 | 0.0% |
| Italian | 16,268 | 1.8% |
| Jamaican | 239 | 0.0% |
| Japanese | 176 | 0.0% |
| Jordanian | 63 | 0.0% |
| Kenyan | 75 | 0.0% |
| Kiowa | 10 | 0.0% |
| Korean | 4,029 | 0.4% |
| Laotian | 70 | 0.0% |
| Latvian | 60 | 0.0% |
| Lebanese | 553 | 0.1% |
| Liberian | 20 | 0.0% |
| Lithuanian | 362 | 0.0% |
| Lumbee | 29 | 0.0% |
| Luxembourger | 22 | 0.0% |
| Macedonian | 6 | 0.0% |
| Malaysian | 5,827 | 0.6% |
| Maltese | 49 | 0.0% |
| Marshallese | 125 | 0.0% |
| Mexican | 90,178 | 10.1% |
| Mexican American Indian | 1,704 | 0.2% |
| Mongolian | 82 | 0.0% |
| Moroccan | 7 | 0.0% |
| Native Hawaiian | 843 | 0.1% |
| Navajo | 221 | 0.0% |
| New Zealander | 107 | 0.0% |
| Nicaraguan | 235 | 0.0% |
| Nigerian | 168 | 0.0% |
| Northern European | 1,321 | 0.2% |
| Norwegian | 5,628 | 0.6% |
| Okinawan | 159 | 0.0% |
| Osage | 208 | 0.0% |
| Ottawa | 18 | 0.0% |
| Paiute | 31 | 0.0% |
| Pakistani | 792 | 0.1% |
| Palestinian | 107 | 0.0% |
| Panamanian | 282 | 0.0% |
| Pennsylvania German | 192 | 0.0% |
| Peruvian | 426 | 0.1% |
| Polish | 7,745 | 0.9% |
| Portuguese | 1,161 | 0.1% |
| Potawatomi | 510 | 0.1% |
| Pueblo | 15 | 0.0% |
| Puerto Rican | 4,533 | 0.5% |
| Romanian | 428 | 0.1% |
| Russian | 1,288 | 0.1% |
| Salvadoran | 20,262 | 2.3% |
| Samoan | 630 | 0.1% |
| Scandinavian | 2,432 | 0.3% |
| Scotch-Irish | 9,048 | 1.0% |
| Scottish | 17,268 | 1.9% |
| Seminole | 111 | 0.0% |
| Senegalese | 132 | 0.0% |
| Serbian | 184 | 0.0% |
| Shoshone | 31 | 0.0% |
| Sioux | 181 | 0.0% |
| Slavic | 104 | 0.0% |
| Slovak | 211 | 0.0% |
| Slovene | 20 | 0.0% |
| South African | 286 | 0.0% |
| South American | 2,575 | 0.3% |
| South American Indian | 13 | 0.0% |
| Spaniard | 1,683 | 0.2% |
| Spanish | 1,195 | 0.1% |
| Spanish American | 132 | 0.0% |
| Sri Lankan | 4,577 | 0.5% |
| Subsaharan African | 2,305 | 0.3% |
| Swedish | 5,177 | 0.6% |
| Swiss | 1,711 | 0.2% |
| Syrian | 142 | 0.0% |
| Thai | 4,256 | 0.5% |
| Tlingit-Haida | 16 | 0.0% |
| Tohono O'Odham | 35 | 0.0% |
| Tongan | 197 | 0.0% |
| Trinidadian and Tobagonian | 354 | 0.0% |
| Turkish | 120 | 0.0% |
| Ugandan | 7 | 0.0% |
| Ukrainian | 738 | 0.1% |
| Uruguayan | 27 | 0.0% |
| Venezuelan | 530 | 0.1% |
| Vietnamese | 247 | 0.0% |
| Welsh | 5,091 | 0.6% |
| West Indian | 461 | 0.1% |
| Yakama | 10 | 0.0% |
| Yugoslavian | 106 | 0.0% |
| Yup'ik | 77 | 0.0% |
| Zimbabwean | 44 | 0.0% | View All 173 Rows |
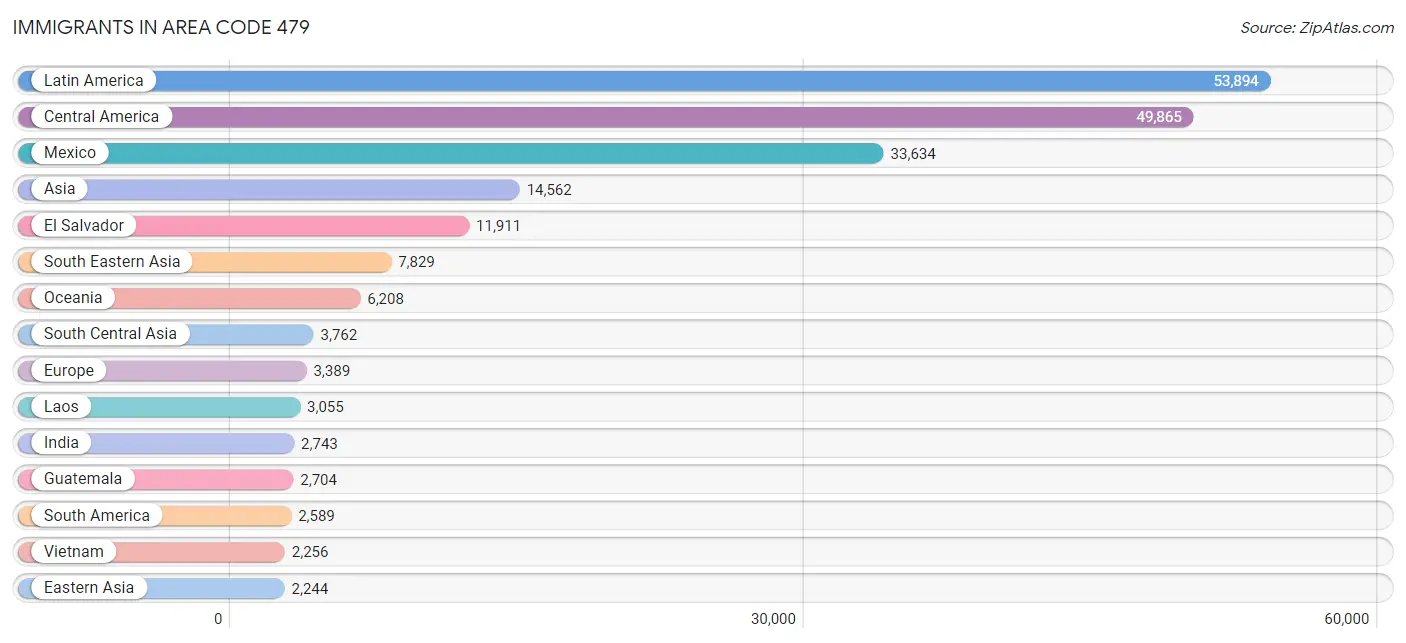
Immigrants in Area Code 479
The most numerous immigrant groups reported in Area Code 479 came from Latin America (53,894 | 6.0%), Central America (49,865 | 5.6%), Mexico (33,634 | 3.8%), Asia (14,562 | 1.6%), and El Salvador (11,911 | 1.3%), together accounting for 18.3% of all Area Code 479 residents.
| Immigration Origin | # Population | % Population |
| Afghanistan | 29 | 0.0% |
| Africa | 1,384 | 0.2% |
| Argentina | 129 | 0.0% |
| Asia | 14,562 | 1.6% |
| Australia | 262 | 0.0% |
| Austria | 45 | 0.0% |
| Bahamas | 96 | 0.0% |
| Bangladesh | 280 | 0.0% |
| Barbados | 14 | 0.0% |
| Belarus | 3 | 0.0% |
| Belgium | 16 | 0.0% |
| Belize | 17 | 0.0% |
| Bolivia | 37 | 0.0% |
| Bosnia and Herzegovina | 7 | 0.0% |
| Brazil | 863 | 0.1% |
| Bulgaria | 20 | 0.0% |
| Cambodia | 197 | 0.0% |
| Cameroon | 205 | 0.0% |
| Canada | 930 | 0.1% |
| Caribbean | 1,440 | 0.2% |
| Central America | 49,865 | 5.6% |
| Chile | 48 | 0.0% |
| China | 1,375 | 0.2% |
| Colombia | 628 | 0.1% |
| Congo | 10 | 0.0% |
| Costa Rica | 549 | 0.1% |
| Cuba | 150 | 0.0% |
| Czechoslovakia | 142 | 0.0% |
| Denmark | 92 | 0.0% |
| Dominica | 7 | 0.0% |
| Dominican Republic | 295 | 0.0% |
| Eastern Africa | 332 | 0.0% |
| Eastern Asia | 2,244 | 0.3% |
| Eastern Europe | 655 | 0.1% |
| Ecuador | 244 | 0.0% |
| Egypt | 118 | 0.0% |
| El Salvador | 11,911 | 1.3% |
| England | 458 | 0.1% |
| Ethiopia | 24 | 0.0% |
| Europe | 3,389 | 0.4% |
| France | 118 | 0.0% |
| Germany | 833 | 0.1% |
| Greece | 53 | 0.0% |
| Grenada | 19 | 0.0% |
| Guatemala | 2,704 | 0.3% |
| Haiti | 412 | 0.1% |
| Honduras | 707 | 0.1% |
| Hong Kong | 2 | 0.0% |
| Hungary | 45 | 0.0% |
| India | 2,743 | 0.3% |
| Indonesia | 181 | 0.0% |
| Iran | 250 | 0.0% |
| Iraq | 166 | 0.0% |
| Ireland | 43 | 0.0% |
| Israel | 6 | 0.0% |
| Italy | 84 | 0.0% |
| Jamaica | 159 | 0.0% |
| Japan | 345 | 0.0% |
| Jordan | 185 | 0.0% |
| Kenya | 87 | 0.0% |
| Korea | 524 | 0.1% |
| Kuwait | 49 | 0.0% |
| Laos | 3,055 | 0.3% |
| Latin America | 53,894 | 6.0% |
| Malaysia | 84 | 0.0% |
| Mexico | 33,634 | 3.8% |
| Micronesia | 54 | 0.0% |
| Middle Africa | 288 | 0.0% |
| Moldova | 40 | 0.0% |
| Morocco | 7 | 0.0% |
| Nepal | 121 | 0.0% |
| Netherlands | 120 | 0.0% |
| Nicaragua | 143 | 0.0% |
| Nigeria | 125 | 0.0% |
| Northern Africa | 189 | 0.0% |
| Northern Europe | 1,365 | 0.2% |
| Oceania | 6,208 | 0.7% |
| Pakistan | 282 | 0.0% |
| Panama | 179 | 0.0% |
| Peru | 319 | 0.0% |
| Philippines | 1,163 | 0.1% |
| Poland | 156 | 0.0% |
| Portugal | 21 | 0.0% |
| Romania | 44 | 0.0% |
| Russia | 83 | 0.0% |
| Saudi Arabia | 123 | 0.0% |
| Scotland | 103 | 0.0% |
| Singapore | 62 | 0.0% |
| South Africa | 341 | 0.0% |
| South America | 2,589 | 0.3% |
| South Central Asia | 3,762 | 0.4% |
| South Eastern Asia | 7,829 | 0.9% |
| Southern Europe | 224 | 0.0% |
| Spain | 66 | 0.0% |
| Sri Lanka | 47 | 0.0% |
| Sweden | 45 | 0.0% |
| Taiwan | 151 | 0.0% |
| Thailand | 594 | 0.1% |
| Trinidad and Tobago | 288 | 0.0% |
| Turkey | 109 | 0.0% |
| Uganda | 7 | 0.0% |
| Ukraine | 46 | 0.0% |
| Uzbekistan | 10 | 0.0% |
| Venezuela | 236 | 0.0% |
| Vietnam | 2,256 | 0.3% |
| Western Africa | 178 | 0.0% |
| Western Asia | 727 | 0.1% |
| Western Europe | 1,132 | 0.1% |
| Zaire | 73 | 0.0% |
| Zimbabwe | 44 | 0.0% | View All 110 Rows |
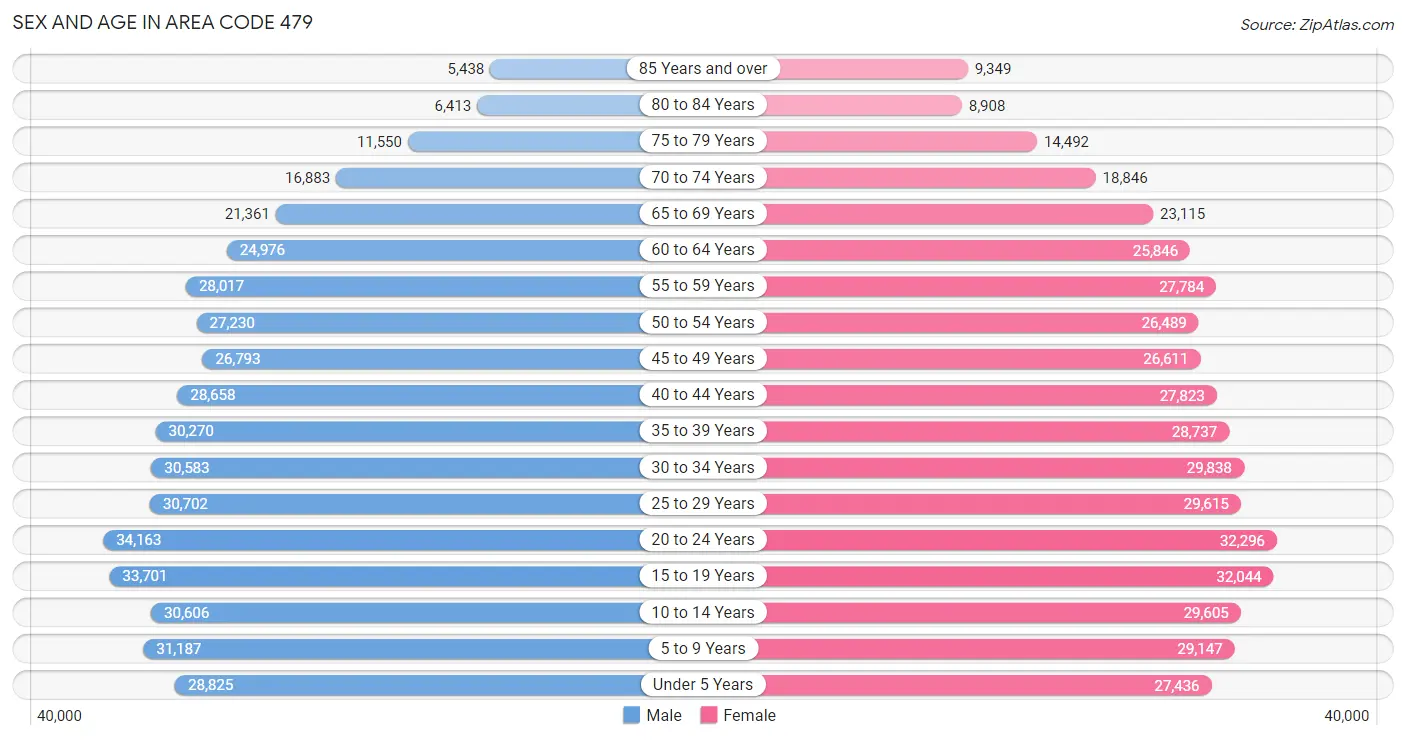
Sex and Age in Area Code 479
Sex and Age in Area Code 479
The most populous age groups in Area Code 479 are 20 to 24 Years (34,163 | 7.6%) for men and 20 to 24 Years (32,296 | 7.2%) for women.
| Age Bracket | Male | Female |
| Under 5 Years | 28,825 (6.4%) | 27,436 (6.1%) |
| 5 to 9 Years | 31,187 (7.0%) | 29,147 (6.5%) |
| 10 to 14 Years | 30,606 (6.8%) | 29,605 (6.6%) |
| 15 to 19 Years | 33,701 (7.5%) | 32,044 (7.1%) |
| 20 to 24 Years | 34,163 (7.6%) | 32,296 (7.2%) |
| 25 to 29 Years | 30,702 (6.9%) | 29,615 (6.6%) |
| 30 to 34 Years | 30,583 (6.8%) | 29,838 (6.7%) |
| 35 to 39 Years | 30,270 (6.8%) | 28,737 (6.4%) |
| 40 to 44 Years | 28,658 (6.4%) | 27,823 (6.2%) |
| 45 to 49 Years | 26,793 (6.0%) | 26,611 (5.9%) |
| 50 to 54 Years | 27,230 (6.1%) | 26,489 (5.9%) |
| 55 to 59 Years | 28,017 (6.3%) | 27,784 (6.2%) |
| 60 to 64 Years | 24,976 (5.6%) | 25,846 (5.8%) |
| 65 to 69 Years | 21,361 (4.8%) | 23,115 (5.2%) |
| 70 to 74 Years | 16,883 (3.8%) | 18,846 (4.2%) |
| 75 to 79 Years | 11,550 (2.6%) | 14,492 (3.2%) |
| 80 to 84 Years | 6,413 (1.4%) | 8,908 (2.0%) |
| 85 Years and over | 5,438 (1.2%) | 9,349 (2.1%) |
| Total | 447,356 (100.0%) | 447,981 (100.0%) |
Families and Households in Area Code 479
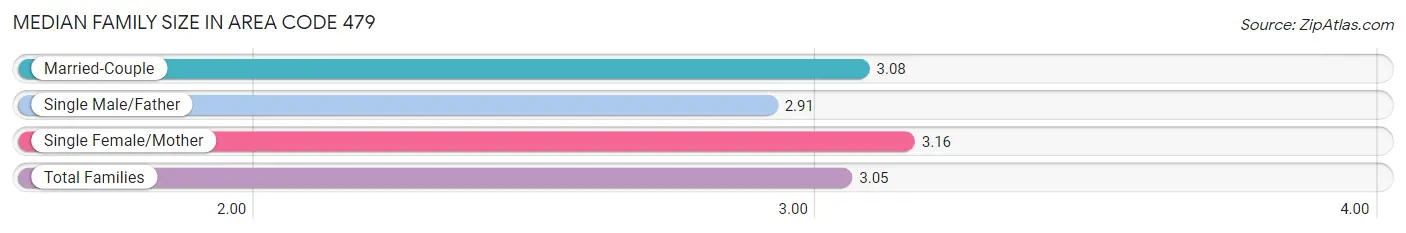
Median Family Size in Area Code 479
The median family size in Area Code 479 is 3.05 persons per family, with single female/mother families (37,520 | 16.4%) accounting for the largest median family size of 3.1581 persons per family. On the other hand, single male/father families (16,893 | 7.4%) represent the smallest median family size with 2.91 persons per family.
| Family Type | # Families | Family Size |
| Married-Couple | 174,690 (76.2%) | 3.08 |
| Single Male/Father | 16,893 (7.4%) | 2.91 |
| Single Female/Mother | 37,520 (16.4%) | 3.16 |
| Total Families | 229,103 (100.0%) | 3.05 |
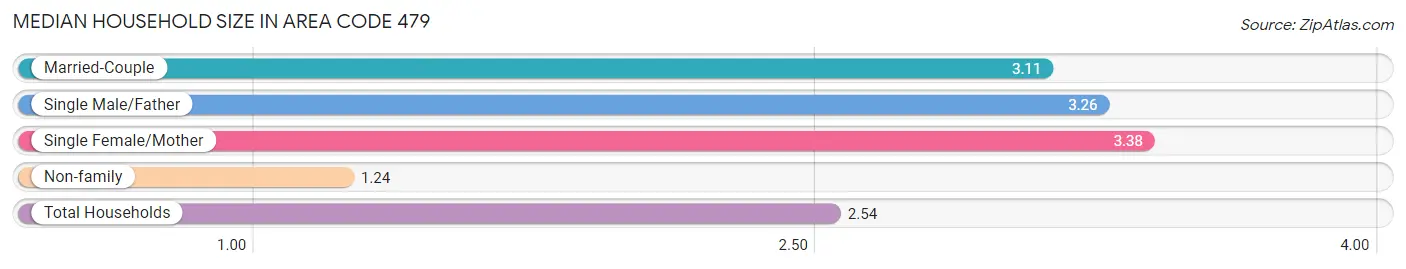
Median Household Size in Area Code 479
The median household size in Area Code 479 is 2.54 persons per household, with single female/mother households (37,520 | 11.1%) accounting for the largest median household size of 3.37894 persons per household. non-family households (110,451 | 32.5%) represent the smallest median household size with 1.24 persons per household.
| Household Type | # Households | Household Size |
| Married-Couple | 174,690 (51.4%) | 3.11 |
| Single Male/Father | 16,893 (5.0%) | 3.26 |
| Single Female/Mother | 37,520 (11.1%) | 3.38 |
| Non-family | 110,451 (32.5%) | 1.24 |
| Total Households | 339,554 (100.0%) | 2.54 |
Household Size by Marriage Status in Area Code 479
Out of a total of 339,554 households in Area Code 479, 229,103 (67.5%) are family households, while 110,451 (32.5%) are nonfamily households. The most numerous type of family households are 2-person households, comprising 100,073, and the most common type of nonfamily households are 1-person households, comprising 88,651.
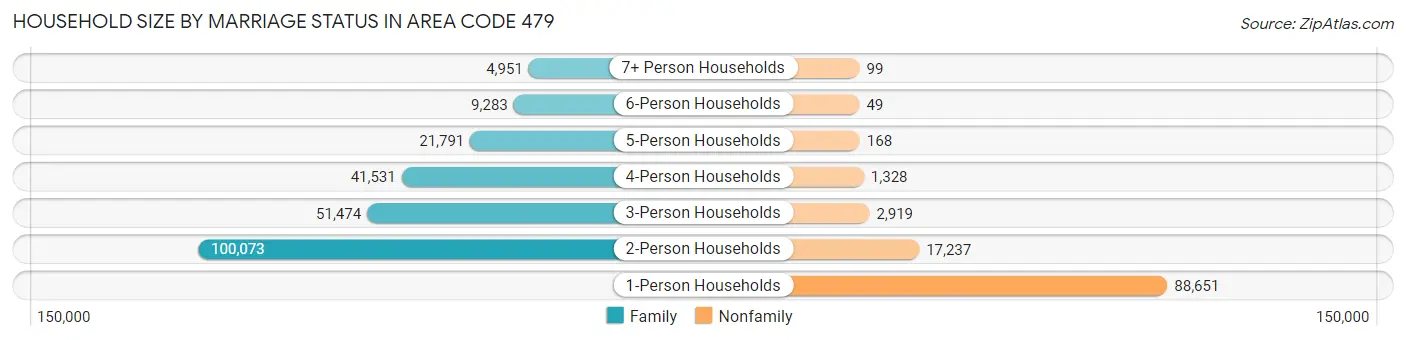
| Household Size | Family Households | Nonfamily Households |
| 1-Person Households | - | 88,651 (26.1%) |
| 2-Person Households | 100,073 (29.5%) | 17,237 (5.1%) |
| 3-Person Households | 51,474 (15.2%) | 2,919 (0.9%) |
| 4-Person Households | 41,531 (12.2%) | 1,328 (0.4%) |
| 5-Person Households | 21,791 (6.4%) | 168 (0.1%) |
| 6-Person Households | 9,283 (2.7%) | 49 (0.0%) |
| 7+ Person Households | 4,951 (1.5%) | 99 (0.0%) |
| Total | 229,103 (67.5%) | 110,451 (32.5%) |
Female Fertility in Area Code 479
Fertility by Age in Area Code 479
Average fertility rate in Area Code 479 is 71.0 births per 1,000 women. Women in the age bracket of 20 to 34 years have the highest fertility rate with 160.0 births per 1,000 women. Women in the age bracket of 20 to 34 years acount for 79.6% of all women with births.
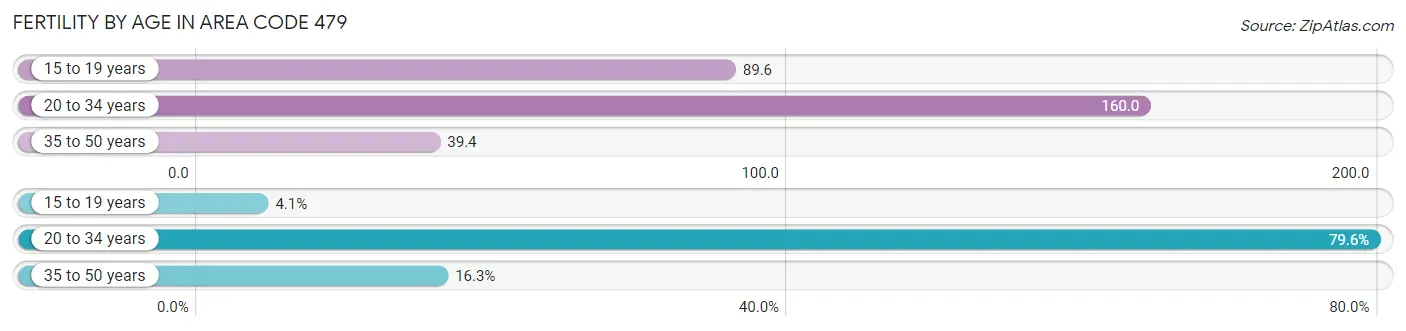
| Age Bracket | Women with Births | Births / 1,000 Women |
| 15 to 19 years | 493 (4.1%) | 89.6 |
| 20 to 34 years | 9,582 (79.6%) | 160.0 |
| 35 to 50 years | 1,962 (16.3%) | 39.4 |
| Total | 12,037 (100.0%) | 71.0 |
Fertility by Age by Marriage Status in Area Code 479
54.1% of women with births (12,037) in Area Code 479 are married. The highest percentage of unmarried women with births falls into 15 to 19 years age bracket with 91.7% of them unmarried at the time of birth, while the lowest percentage of unmarried women with births belong to 20 to 34 years age bracket with 47.0% of them unmarried.
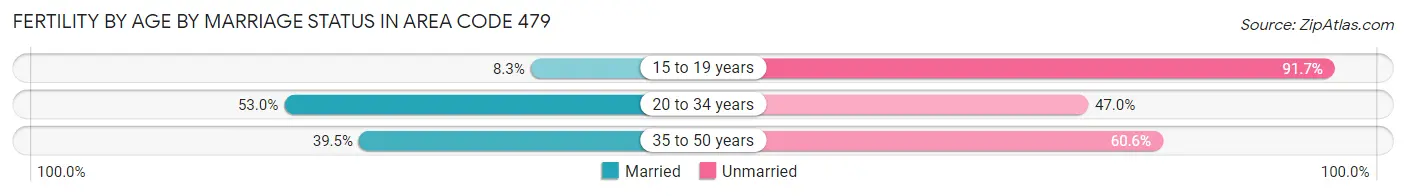
| Age Bracket | Married | Unmarried |
| 15 to 19 years | 41 (8.3%) | 452 (91.7%) |
| 20 to 34 years | 5,078 (53.0%) | 4,504 (47.0%) |
| 35 to 50 years | 774 (39.5%) | 1,188 (60.6%) |
| Total | 6,507 (54.1%) | 5,530 (45.9%) |
Fertility by Education in Area Code 479
Average fertility rate in Area Code 479 is 71.0 births per 1,000 women. Women with the education attainment of graduate degree have the highest fertility rate of 185.4 births per 1,000 women, while women with the education attainment of less than high school have the lowest fertility at 71.5 births per 1,000 women. Women with the education attainment of high school diploma represent 32.4% of all women with births.
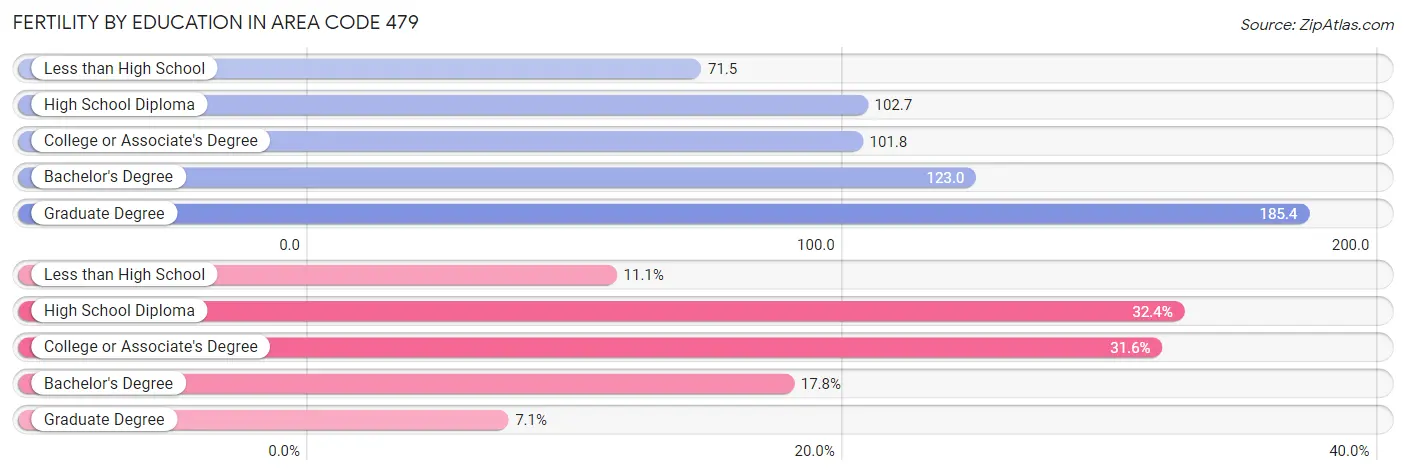
| Educational Attainment | Women with Births | Births / 1,000 Women |
| Less than High School | 1,341 (11.1%) | 71.5 |
| High School Diploma | 3,902 (32.4%) | 102.7 |
| College or Associate's Degree | 3,802 (31.6%) | 101.8 |
| Bachelor's Degree | 2,140 (17.8%) | 123.0 |
| Graduate Degree | 852 (7.1%) | 185.4 |
| Total | 12,037 (100.0%) | 71.0 |
Fertility by Education by Marriage Status in Area Code 479
45.9% of women with births in Area Code 479 are unmarried. Women with the educational attainment of bachelor's degree are most likely to be married with 49.2% of them married at childbirth, while women with the educational attainment of high school diploma are least likely to be married with 69.4% of them unmarried at childbirth.
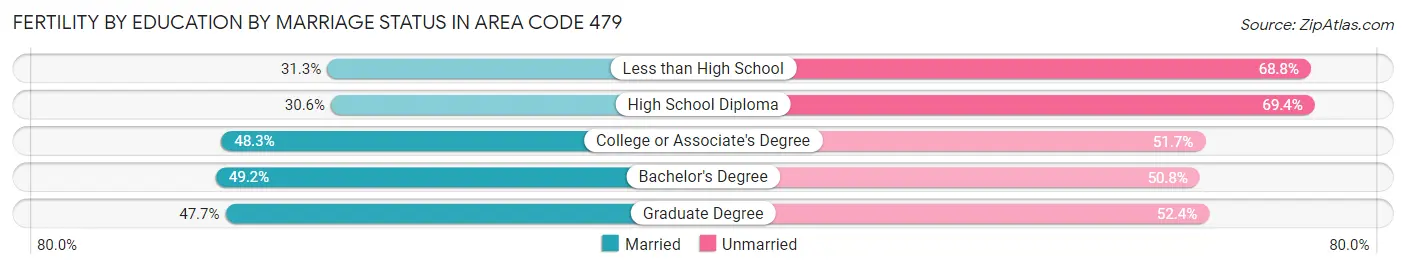
| Educational Attainment | Married | Unmarried |
| Less than High School | 419 (31.2%) | 922 (68.8%) |
| High School Diploma | 1,195 (30.6%) | 2,707 (69.4%) |
| College or Associate's Degree | 1,836 (48.3%) | 1,966 (51.7%) |
| Bachelor's Degree | 1,052 (49.2%) | 1,088 (50.8%) |
| Graduate Degree | 406 (47.6%) | 446 (52.3%) |
| Total | 6,507 (54.1%) | 5,530 (45.9%) |
Employment Characteristics in Area Code 479
Employment by Class of Employer in Area Code 479
Among the 410,125 employed individuals in Area Code 479, private company employees (285,576 | 69.6%), not-for-profit organizations (31,245 | 7.6%), and self-employed (not incorporated) (27,712 | 6.8%) make up the most common classes of employment.
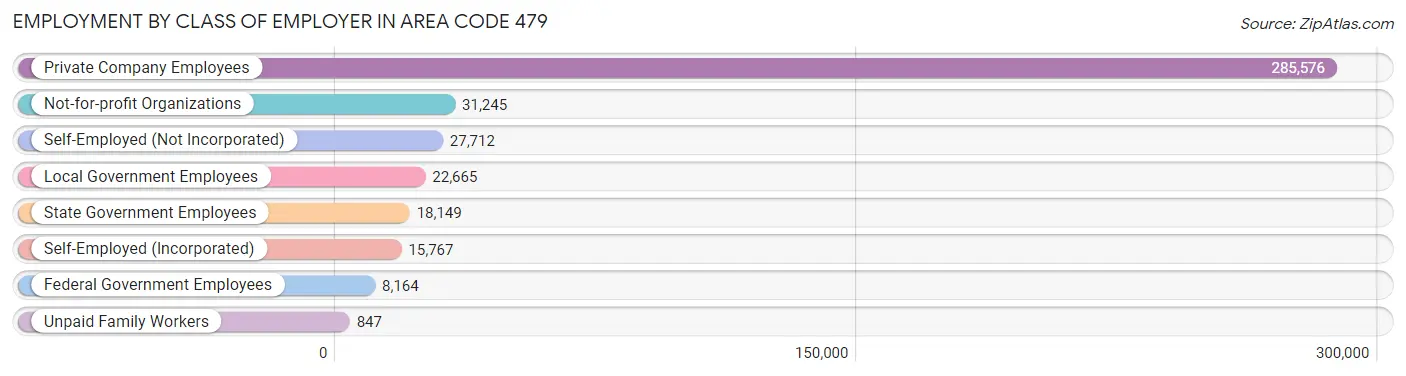
| Employer Class | # Employees | % Employees |
| Private Company Employees | 285,576 | 69.6% |
| Self-Employed (Incorporated) | 15,767 | 3.8% |
| Self-Employed (Not Incorporated) | 27,712 | 6.8% |
| Not-for-profit Organizations | 31,245 | 7.6% |
| Local Government Employees | 22,665 | 5.5% |
| State Government Employees | 18,149 | 4.4% |
| Federal Government Employees | 8,164 | 2.0% |
| Unpaid Family Workers | 847 | 0.2% |
| Total | 410,125 | 100.0% |
Employment Status by Age in Area Code 479
According to the labor force statistics for Area Code 479, out of the total population over 16 years of age (706,115), 53.1% or 375,230 individuals are in the labor force, with 4.5% or 16,810 of them unemployed. The age group with the highest labor force participation rate is 25 to 29 years, with 82.2% or 49,605 individuals in the labor force. Within the labor force, the 16 to 19 years age range has the highest percentage of unemployed individuals, with 1,206.0% or 237,317 of them being unemployed.
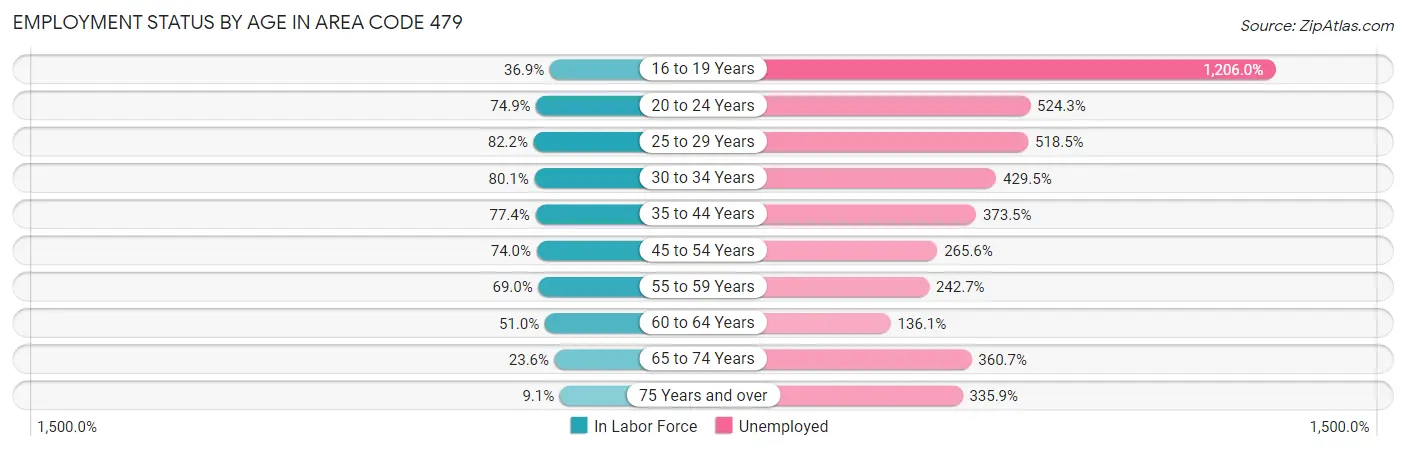
| Age Bracket | In Labor Force | Unemployed |
| 16 to 19 Years | 19,680 (36.9%) | 237,317 (1,206.0%) |
| 20 to 24 Years | 49,806 (74.9%) | 261,122 (524.3%) |
| 25 to 29 Years | 49,607 (82.2%) | 257,202 (518.5%) |
| 30 to 34 Years | 48,377 (80.1%) | 207,788 (429.5%) |
| 35 to 44 Years | 89,426 (77.4%) | 333,991 (373.5%) |
| 45 to 54 Years | 79,232 (74.0%) | 210,430 (265.6%) |
| 55 to 59 Years | 38,497 (69.0%) | 93,432 (242.7%) |
| 60 to 64 Years | 25,918 (51.0%) | 35,276 (136.1%) |
| 65 to 74 Years | 18,894 (23.6%) | 68,158 (360.7%) |
| 75 Years and over | 5,103 (9.1%) | 17,144 (335.9%) |
| Total | 375,228 (53.1%) | 16,802 (4.5%) |
Employment Status by Educational Attainment in Area Code 479
According to labor force statistics for Area Code 479, 69.1% of individuals (311,111) out of the total population between 25 and 64 years of age (449,972) are in the labor force, with 331.8% or 1,032,266 of them being unemployed. The group with the highest labor force participation rate are those with the educational attainment of bachelor's degree or higher, with 82.4% or 107,726 individuals in the labor force. Within the labor force, individuals with less than high school education have the highest percentage of unemployment, with 465.1% or 154,995 of them being unemployed.
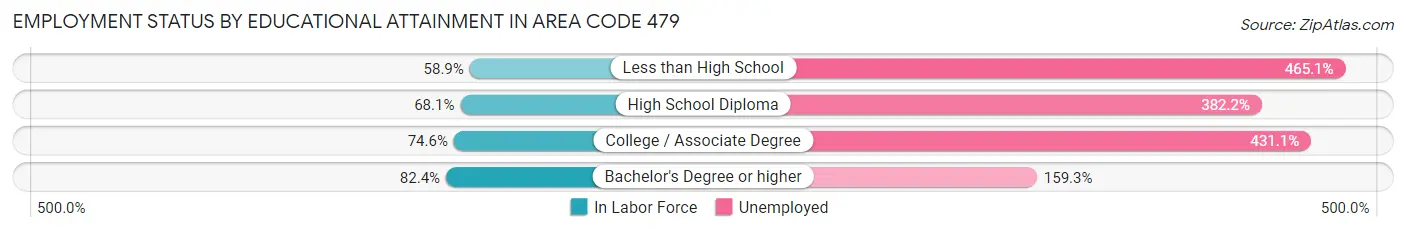
| Educational Attainment | In Labor Force | Unemployed |
| Less than High School | 33,323 (58.9%) | 263,326 (465.1%) |
| High School Diploma | 93,553 (68.1%) | 524,841 (382.2%) |
| College / Associate Degree | 93,398 (74.6%) | 539,888 (431.1%) |
| Bachelor's Degree or higher | 107,728 (82.4%) | 208,363 (159.3%) |
| Total | 311,099 (69.1%) | 1,493,007 (331.8%) |
Employment Occupations by Sex in Area Code 479
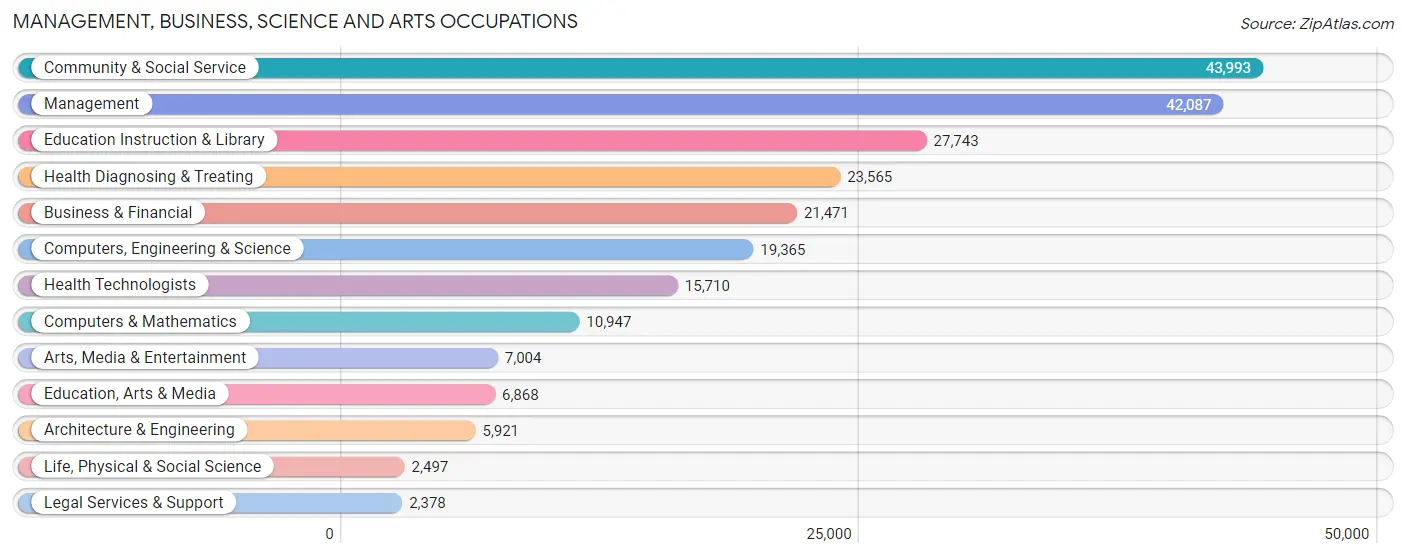
Management, Business, Science and Arts Occupations
The most common Management, Business, Science and Arts occupations in Area Code 479 are Community & Social Service (43,993 | 10.6%), Management (42,087 | 10.1%), Education Instruction & Library (27,743 | 6.7%), Health Diagnosing & Treating (23,565 | 5.7%), and Business & Financial (21,471 | 5.2%).
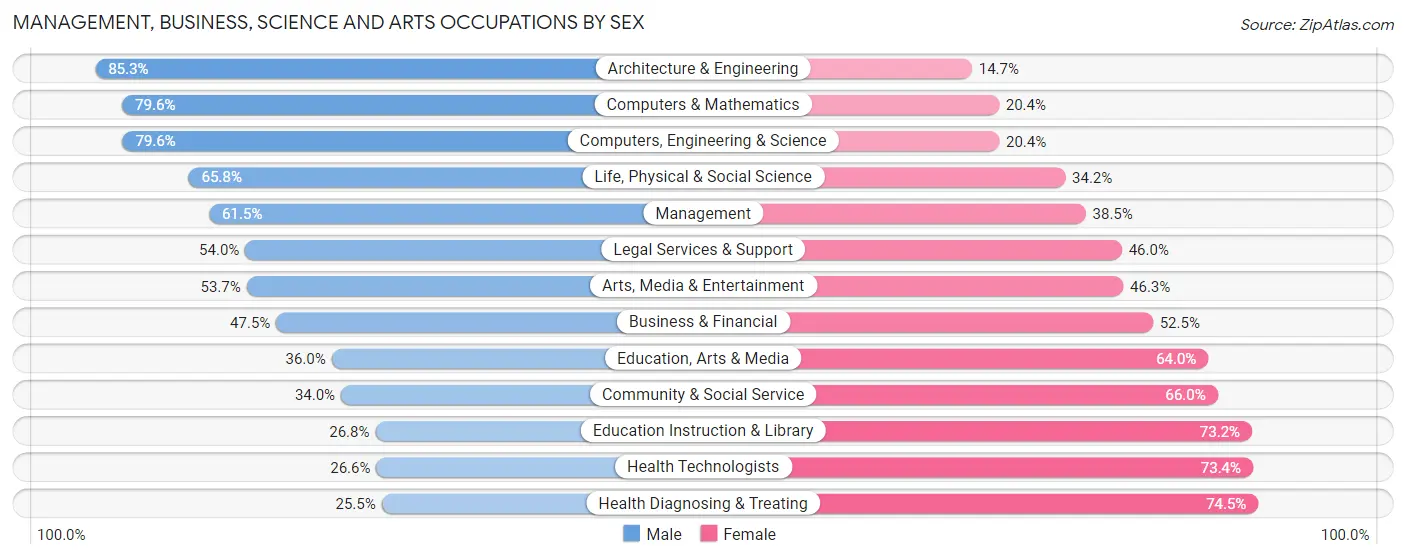
Management, Business, Science and Arts Occupations by Sex
Within the Management, Business, Science and Arts occupations in Area Code 479, the most male-oriented occupations are Architecture & Engineering (85.3%), Computers & Mathematics (79.6%), and Computers, Engineering & Science (79.6%), while the most female-oriented occupations are Health Diagnosing & Treating (74.5%), Health Technologists (73.4%), and Education Instruction & Library (73.2%).
| Occupation | Male | Female |
| Management | 25,896 (61.5%) | 16,191 (38.5%) |
| Business & Financial | 10,202 (47.5%) | 11,269 (52.5%) |
| Computers, Engineering & Science | 15,410 (79.6%) | 3,955 (20.4%) |
| Computers & Mathematics | 8,718 (79.6%) | 2,229 (20.4%) |
| Architecture & Engineering | 5,049 (85.3%) | 872 (14.7%) |
| Life, Physical & Social Science | 1,643 (65.8%) | 854 (34.2%) |
| Community & Social Service | 14,962 (34.0%) | 29,031 (66.0%) |
| Education, Arts & Media | 2,470 (36.0%) | 4,398 (64.0%) |
| Legal Services & Support | 1,284 (54.0%) | 1,094 (46.0%) |
| Education Instruction & Library | 7,447 (26.8%) | 20,296 (73.2%) |
| Arts, Media & Entertainment | 3,761 (53.7%) | 3,243 (46.3%) |
| Health Diagnosing & Treating | 6,016 (25.5%) | 17,549 (74.5%) |
| Health Technologists | 4,185 (26.6%) | 11,525 (73.4%) |
| Total (Category) | 72,486 (48.2%) | 77,995 (51.8%) |
| Total (Overall) | 226,070 (54.5%) | 188,994 (45.5%) |
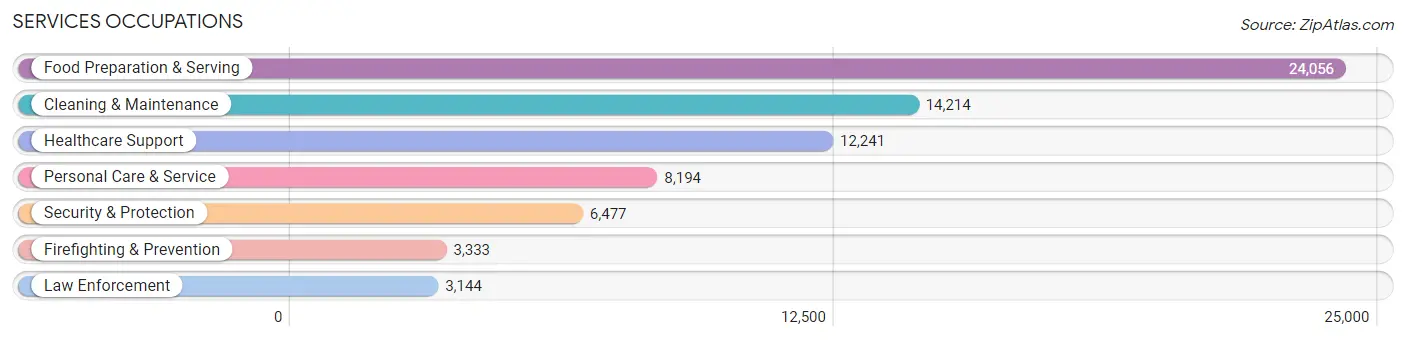
Services Occupations
The most common Services occupations in Area Code 479 are Food Preparation & Serving (24,056 | 5.8%), Cleaning & Maintenance (14,214 | 3.4%), Healthcare Support (12,241 | 2.9%), Personal Care & Service (8,194 | 2.0%), and Security & Protection (6,477 | 1.6%).
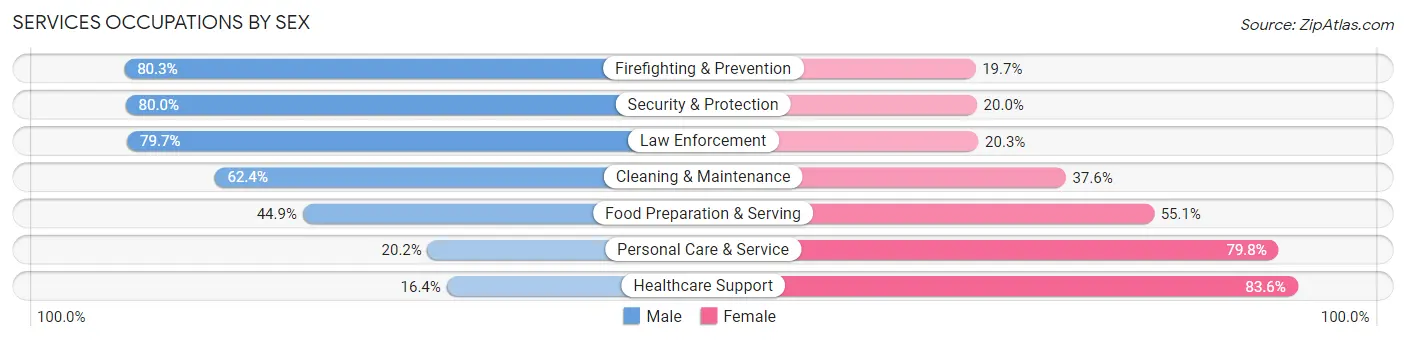
Services Occupations by Sex
Within the Services occupations in Area Code 479, the most male-oriented occupations are Firefighting & Prevention (80.3%), Security & Protection (80.0%), and Law Enforcement (79.7%), while the most female-oriented occupations are Healthcare Support (83.6%), Personal Care & Service (79.8%), and Food Preparation & Serving (55.1%).
| Occupation | Male | Female |
| Healthcare Support | 2,011 (16.4%) | 10,230 (83.6%) |
| Security & Protection | 5,180 (80.0%) | 1,297 (20.0%) |
| Firefighting & Prevention | 2,675 (80.3%) | 658 (19.7%) |
| Law Enforcement | 2,505 (79.7%) | 639 (20.3%) |
| Food Preparation & Serving | 10,805 (44.9%) | 13,251 (55.1%) |
| Cleaning & Maintenance | 8,868 (62.4%) | 5,346 (37.6%) |
| Personal Care & Service | 1,655 (20.2%) | 6,539 (79.8%) |
| Total (Category) | 28,519 (43.8%) | 36,663 (56.2%) |
| Total (Overall) | 226,070 (54.5%) | 188,994 (45.5%) |
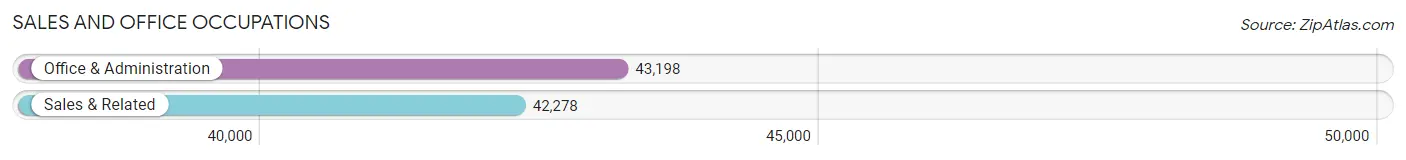
Sales and Office Occupations
The most common Sales and Office occupations in Area Code 479 are Office & Administration (43,198 | 10.4%), and Sales & Related (42,278 | 10.2%).
Sales and Office Occupations by Sex
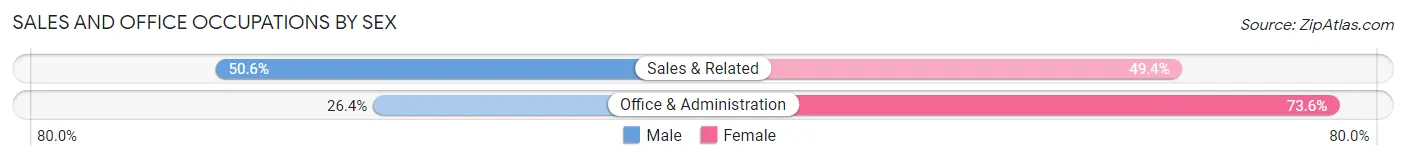
| Occupation | Male | Female |
| Sales & Related | 21,397 (50.6%) | 20,881 (49.4%) |
| Office & Administration | 11,398 (26.4%) | 31,800 (73.6%) |
| Total (Category) | 32,795 (38.4%) | 52,681 (61.6%) |
| Total (Overall) | 226,070 (54.5%) | 188,994 (45.5%) |
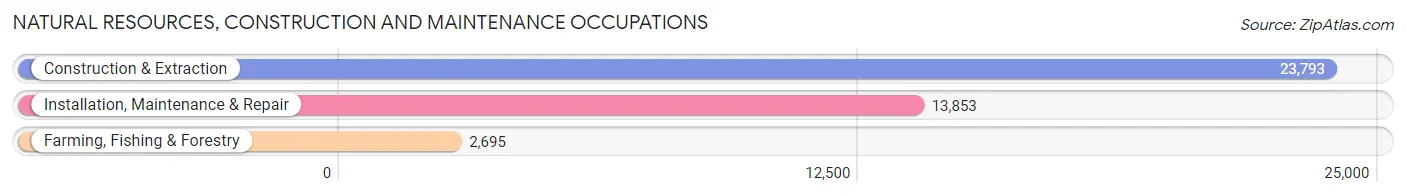
Natural Resources, Construction and Maintenance Occupations
The most common Natural Resources, Construction and Maintenance occupations in Area Code 479 are Construction & Extraction (23,793 | 5.7%), Installation, Maintenance & Repair (13,853 | 3.3%), and Farming, Fishing & Forestry (2,695 | 0.6%).
Natural Resources, Construction and Maintenance Occupations by Sex
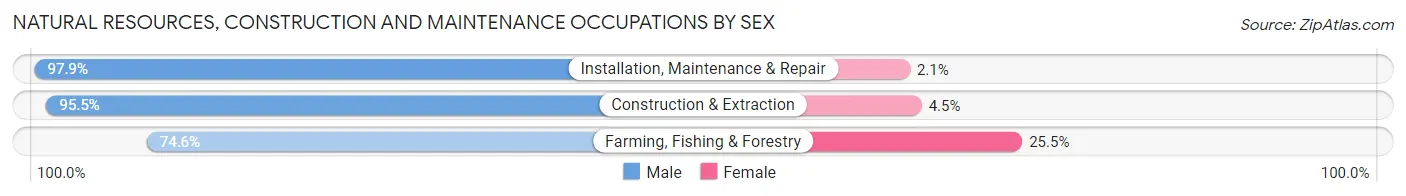
| Occupation | Male | Female |
| Farming, Fishing & Forestry | 2,009 (74.6%) | 686 (25.5%) |
| Construction & Extraction | 22,713 (95.5%) | 1,080 (4.5%) |
| Installation, Maintenance & Repair | 13,564 (97.9%) | 289 (2.1%) |
| Total (Category) | 38,286 (94.9%) | 2,055 (5.1%) |
| Total (Overall) | 226,070 (54.5%) | 188,994 (45.5%) |
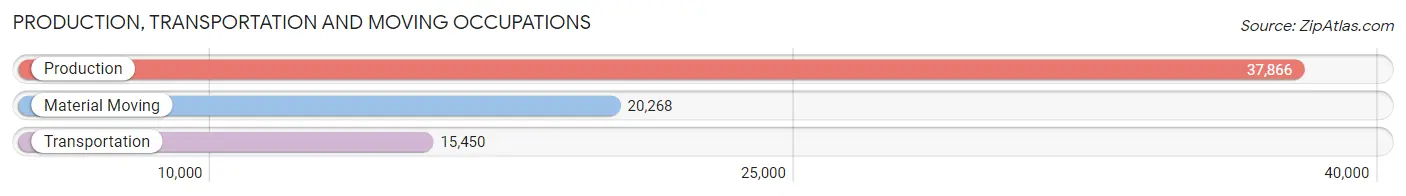
Production, Transportation and Moving Occupations
The most common Production, Transportation and Moving occupations in Area Code 479 are Production (37,866 | 9.1%), Material Moving (20,268 | 4.9%), and Transportation (15,450 | 3.7%).
Production, Transportation and Moving Occupations by Sex
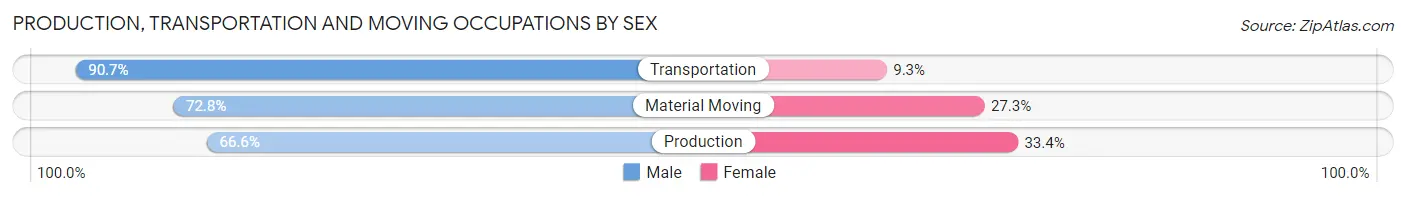
| Occupation | Male | Female |
| Production | 25,227 (66.6%) | 12,639 (33.4%) |
| Transportation | 14,012 (90.7%) | 1,438 (9.3%) |
| Material Moving | 14,745 (72.8%) | 5,523 (27.3%) |
| Total (Category) | 53,984 (73.4%) | 19,600 (26.6%) |
| Total (Overall) | 226,070 (54.5%) | 188,994 (45.5%) |
Employment Industries by Sex in Area Code 479
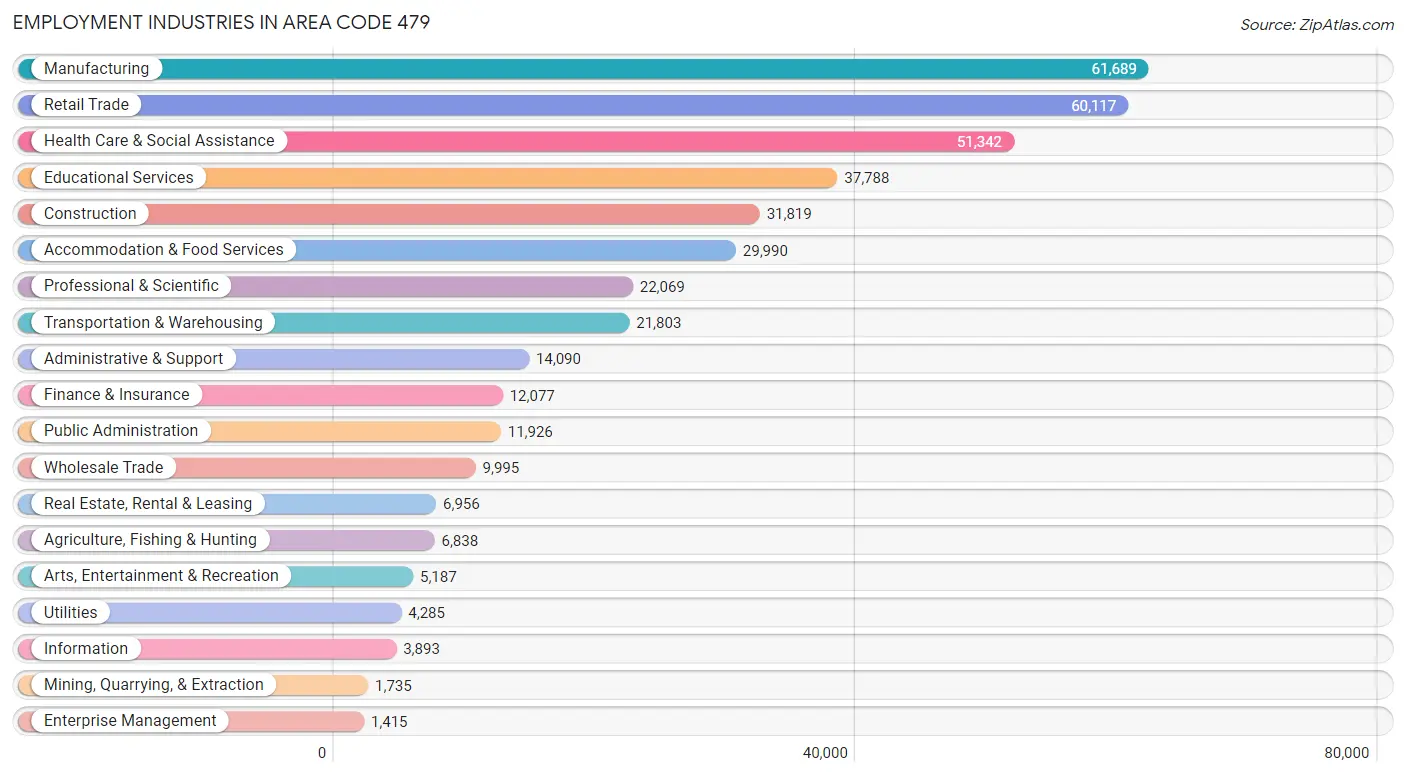
Employment Industries in Area Code 479
The major employment industries in Area Code 479 include Manufacturing (61,689 | 14.9%), Retail Trade (60,117 | 14.5%), Health Care & Social Assistance (51,342 | 12.4%), Educational Services (37,788 | 9.1%), and Construction (31,819 | 7.7%).
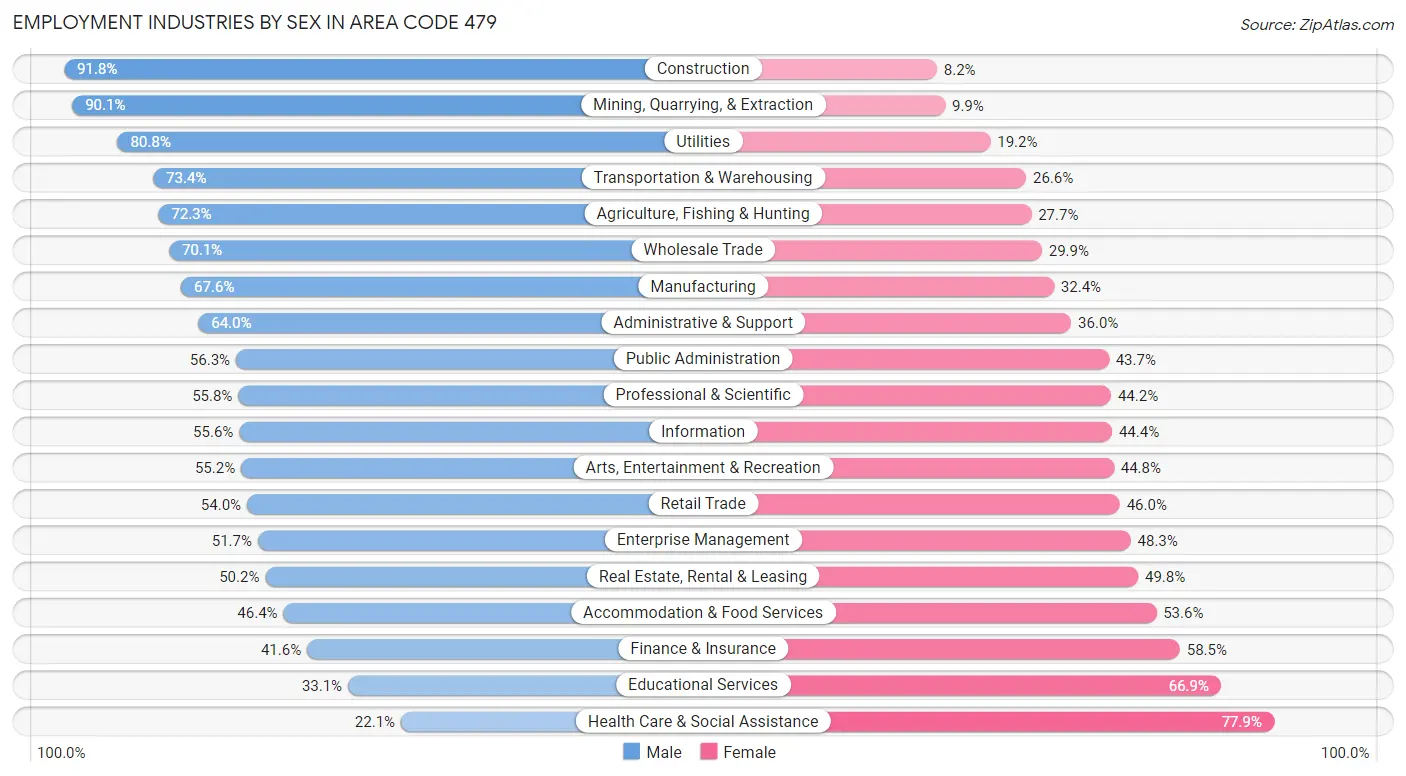
Employment Industries by Sex in Area Code 479
The Area Code 479 industries that see more men than women are Construction (91.8%), Mining, Quarrying, & Extraction (90.1%), and Utilities (80.8%), whereas the industries that tend to have a higher number of women are Health Care & Social Assistance (77.9%), Educational Services (66.9%), and Finance & Insurance (58.5%).
| Industry | Male | Female |
| Agriculture, Fishing & Hunting | 4,944 (72.3%) | 1,894 (27.7%) |
| Mining, Quarrying, & Extraction | 1,564 (90.1%) | 171 (9.9%) |
| Construction | 29,222 (91.8%) | 2,597 (8.2%) |
| Manufacturing | 41,707 (67.6%) | 19,982 (32.4%) |
| Wholesale Trade | 7,008 (70.1%) | 2,987 (29.9%) |
| Retail Trade | 32,455 (54.0%) | 27,662 (46.0%) |
| Transportation & Warehousing | 15,999 (73.4%) | 5,804 (26.6%) |
| Utilities | 3,461 (80.8%) | 824 (19.2%) |
| Information | 2,164 (55.6%) | 1,729 (44.4%) |
| Finance & Insurance | 5,018 (41.5%) | 7,059 (58.5%) |
| Real Estate, Rental & Leasing | 3,491 (50.2%) | 3,465 (49.8%) |
| Professional & Scientific | 12,312 (55.8%) | 9,757 (44.2%) |
| Enterprise Management | 732 (51.7%) | 683 (48.3%) |
| Administrative & Support | 9,023 (64.0%) | 5,067 (36.0%) |
| Educational Services | 12,498 (33.1%) | 25,290 (66.9%) |
| Health Care & Social Assistance | 11,354 (22.1%) | 39,988 (77.9%) |
| Arts, Entertainment & Recreation | 2,864 (55.2%) | 2,323 (44.8%) |
| Accommodation & Food Services | 13,924 (46.4%) | 16,066 (53.6%) |
| Public Administration | 6,709 (56.3%) | 5,217 (43.7%) |
| Total | 226,070 (54.5%) | 188,994 (45.5%) |
Education in Area Code 479
School Enrollment in Area Code 479
The most common levels of schooling among the 224,160 students in Area Code 479 are college / undergraduate (48,043 | 21.4%), high school (47,938 | 21.4%), and elementary school (47,850 | 21.3%).
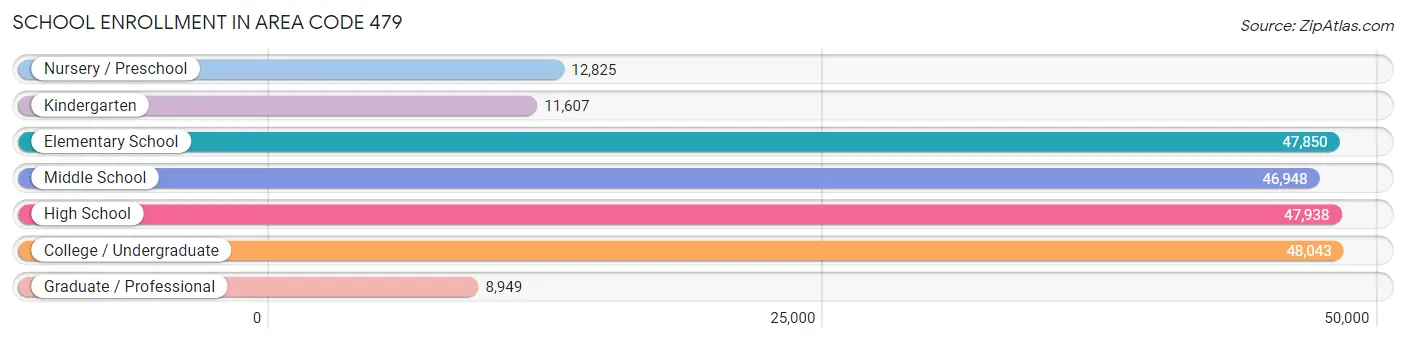
| School Level | # Students | % Students |
| Nursery / Preschool | 12,825 | 5.7% |
| Kindergarten | 11,607 | 5.2% |
| Elementary School | 47,850 | 21.3% |
| Middle School | 46,948 | 20.9% |
| High School | 47,938 | 21.4% |
| College / Undergraduate | 48,043 | 21.4% |
| Graduate / Professional | 8,949 | 4.0% |
| Total | 224,160 | 100.0% |
School Enrollment by Age by Funding Source in Area Code 479
Out of a total of 224,160 students who are enrolled in schools in Area Code 479, 27,486 (12.3%) attend a private institution, while the remaining 196,674 (87.7%) are enrolled in public schools. The age group of 3 to 4 year olds has the highest likelihood of being enrolled in private schools, with 3,761 (40.6% in the age bracket) enrolled. Conversely, the age group of 15 to 17 year olds has the lowest likelihood of being enrolled in a private school, with 33,420 (92.3% in the age bracket) attending a public institution.
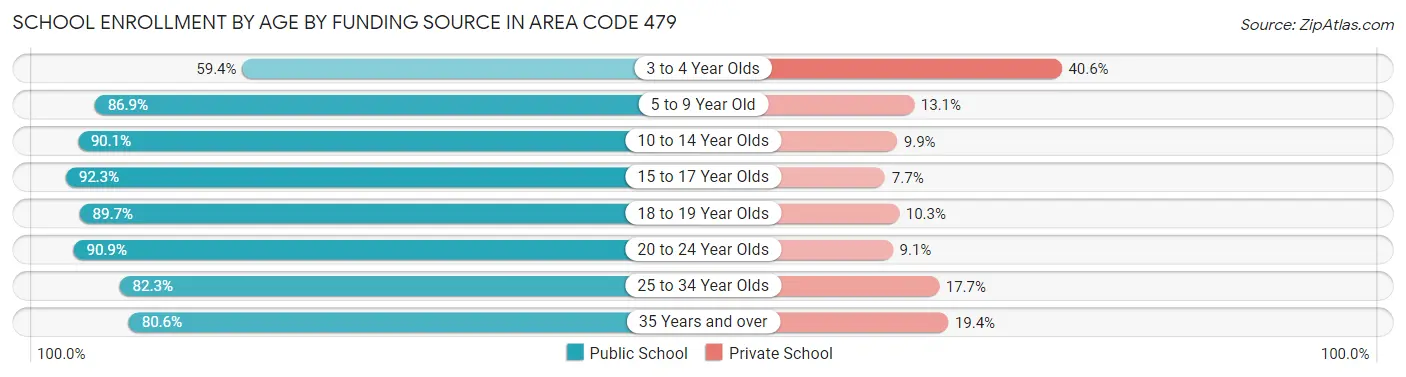
| Age Bracket | Public School | Private School |
| 3 to 4 Year Olds | 5,511 (59.4%) | 3,761 (40.6%) |
| 5 to 9 Year Old | 48,598 (86.9%) | 7,308 (13.1%) |
| 10 to 14 Year Olds | 52,761 (90.1%) | 5,797 (9.9%) |
| 15 to 17 Year Olds | 33,420 (92.3%) | 2,780 (7.7%) |
| 18 to 19 Year Olds | 17,642 (89.7%) | 2,018 (10.3%) |
| 20 to 24 Year Olds | 23,200 (90.9%) | 2,327 (9.1%) |
| 25 to 34 Year Olds | 9,284 (82.3%) | 1,998 (17.7%) |
| 35 Years and over | 6,249 (80.6%) | 1,506 (19.4%) |
| Total | 196,674 (87.7%) | 27,486 (12.3%) |
Educational Attainment by Field of Study in Area Code 479
Business (38,239 | 21.8%), education (27,312 | 15.6%), science & technology (17,294 | 9.9%), bio, nature & agricultural (13,501 | 7.7%), and arts & humanities (10,589 | 6.0%) are the most common fields of study among 175,183 individuals in Area Code 479 who have obtained a bachelor's degree or higher.
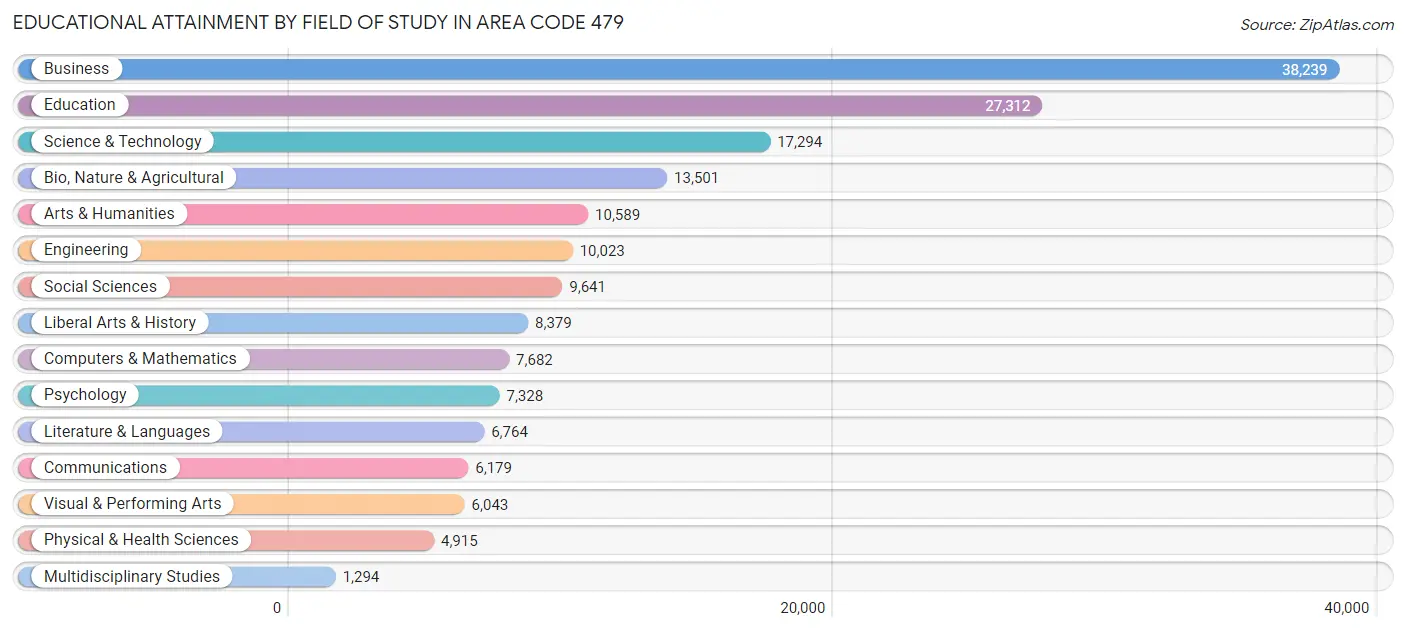
| Field of Study | # Graduates | % Graduates |
| Computers & Mathematics | 7,682 | 4.4% |
| Bio, Nature & Agricultural | 13,501 | 7.7% |
| Physical & Health Sciences | 4,915 | 2.8% |
| Psychology | 7,328 | 4.2% |
| Social Sciences | 9,641 | 5.5% |
| Engineering | 10,023 | 5.7% |
| Multidisciplinary Studies | 1,294 | 0.7% |
| Science & Technology | 17,294 | 9.9% |
| Business | 38,239 | 21.8% |
| Education | 27,312 | 15.6% |
| Literature & Languages | 6,764 | 3.9% |
| Liberal Arts & History | 8,379 | 4.8% |
| Visual & Performing Arts | 6,043 | 3.5% |
| Communications | 6,179 | 3.5% |
| Arts & Humanities | 10,589 | 6.0% |
| Total | 175,183 | 100.0% |
Transportation & Commute in Area Code 479
Vehicle Availability by Sex in Area Code 479
The most prevalent vehicle ownership categories in Area Code 479 are males with 2 vehicles (94,357, accounting for 42.5%) and females with 2 vehicles (79,456, making up 51.0%).
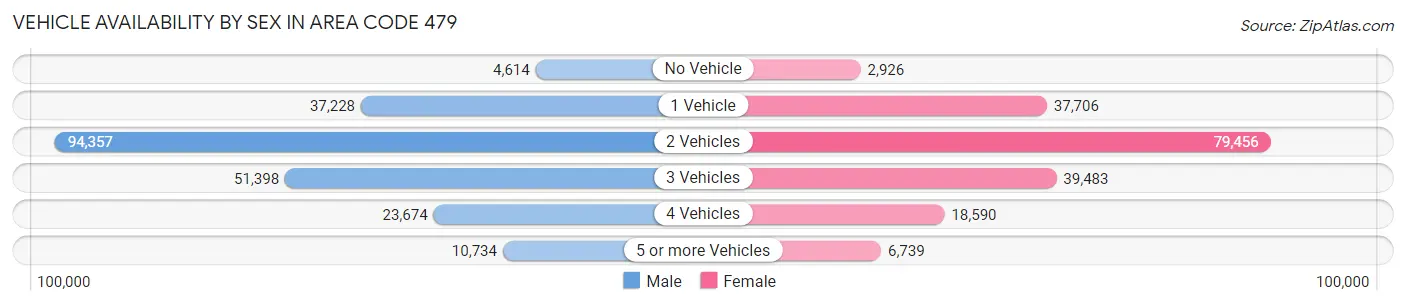
| Vehicles Available | Male | Female |
| No Vehicle | 4,614 (2.1%) | 2,926 (1.6%) |
| 1 Vehicle | 37,228 (16.8%) | 37,706 (20.4%) |
| 2 Vehicles | 94,357 (42.5%) | 79,456 (43.0%) |
| 3 Vehicles | 51,398 (23.2%) | 39,483 (21.3%) |
| 4 Vehicles | 23,674 (10.7%) | 18,590 (10.1%) |
| 5 or more Vehicles | 10,734 (4.8%) | 6,739 (3.6%) |
| Total | 222,005 (100.0%) | 184,900 (100.0%) |
Commute Time in Area Code 479
The most frequently occuring commute durations in Area Code 479 are 15 to 19 minutes (69,119 commuters, 18.4%), 10 to 14 minutes (67,777 commuters, 18.1%), and 20 to 24 minutes (58,688 commuters, 15.7%).
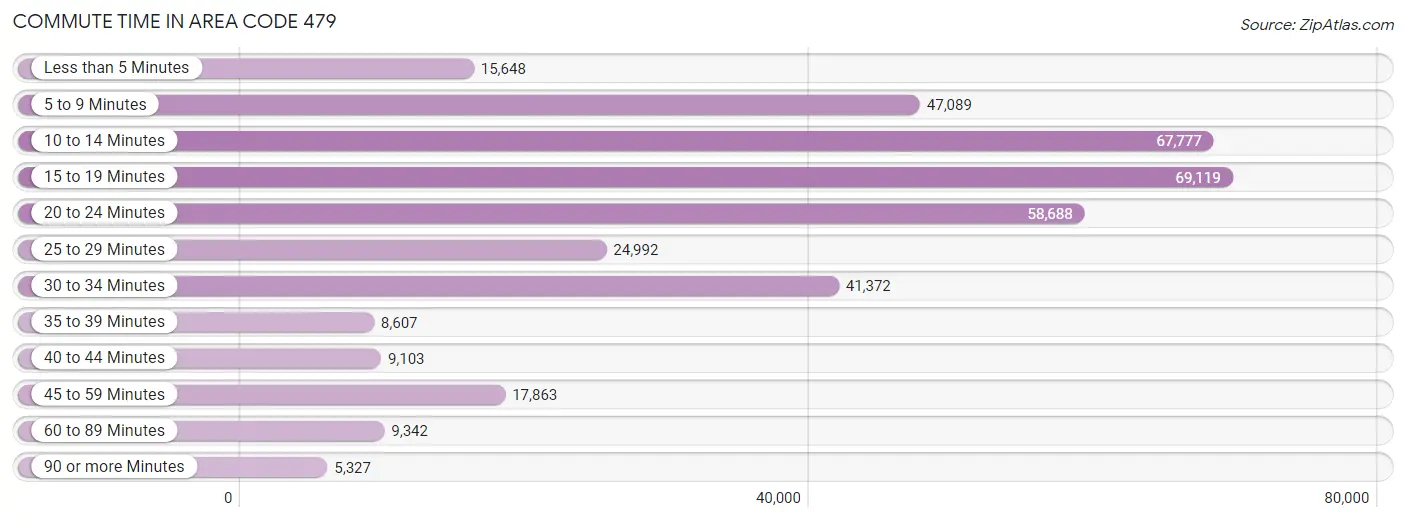
| Commute Time | # Commuters | % Commuters |
| Less than 5 Minutes | 15,648 | 4.2% |
| 5 to 9 Minutes | 47,089 | 12.6% |
| 10 to 14 Minutes | 67,777 | 18.1% |
| 15 to 19 Minutes | 69,119 | 18.4% |
| 20 to 24 Minutes | 58,688 | 15.7% |
| 25 to 29 Minutes | 24,992 | 6.7% |
| 30 to 34 Minutes | 41,372 | 11.0% |
| 35 to 39 Minutes | 8,607 | 2.3% |
| 40 to 44 Minutes | 9,103 | 2.4% |
| 45 to 59 Minutes | 17,863 | 4.8% |
| 60 to 89 Minutes | 9,342 | 2.5% |
| 90 or more Minutes | 5,327 | 1.4% |
Commute Time by Sex in Area Code 479
The most common commute times in Area Code 479 are 15 to 19 minutes (37,704 commuters, 18.3%) for males and 10 to 14 minutes (32,379 commuters, 19.2%) for females.
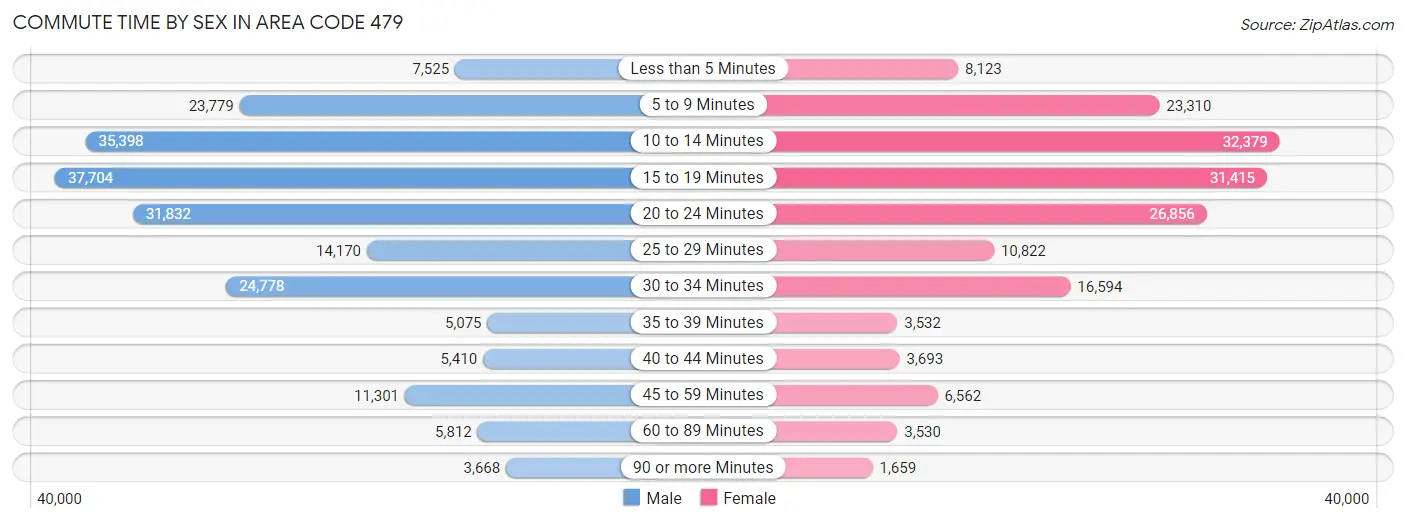
| Commute Time | Male | Female |
| Less than 5 Minutes | 7,525 (3.6%) | 8,123 (4.8%) |
| 5 to 9 Minutes | 23,779 (11.5%) | 23,310 (13.8%) |
| 10 to 14 Minutes | 35,398 (17.2%) | 32,379 (19.2%) |
| 15 to 19 Minutes | 37,704 (18.3%) | 31,415 (18.6%) |
| 20 to 24 Minutes | 31,832 (15.4%) | 26,856 (15.9%) |
| 25 to 29 Minutes | 14,170 (6.9%) | 10,822 (6.4%) |
| 30 to 34 Minutes | 24,778 (12.0%) | 16,594 (9.9%) |
| 35 to 39 Minutes | 5,075 (2.5%) | 3,532 (2.1%) |
| 40 to 44 Minutes | 5,410 (2.6%) | 3,693 (2.2%) |
| 45 to 59 Minutes | 11,301 (5.5%) | 6,562 (3.9%) |
| 60 to 89 Minutes | 5,812 (2.8%) | 3,530 (2.1%) |
| 90 or more Minutes | 3,668 (1.8%) | 1,659 (1.0%) |
Time of Departure to Work by Sex in Area Code 479
The most frequent times of departure to work in Area Code 479 are 7:00 AM to 7:29 AM (36,594, 17.7%) for males and 7:00 AM to 7:29 AM (33,542, 19.9%) for females.
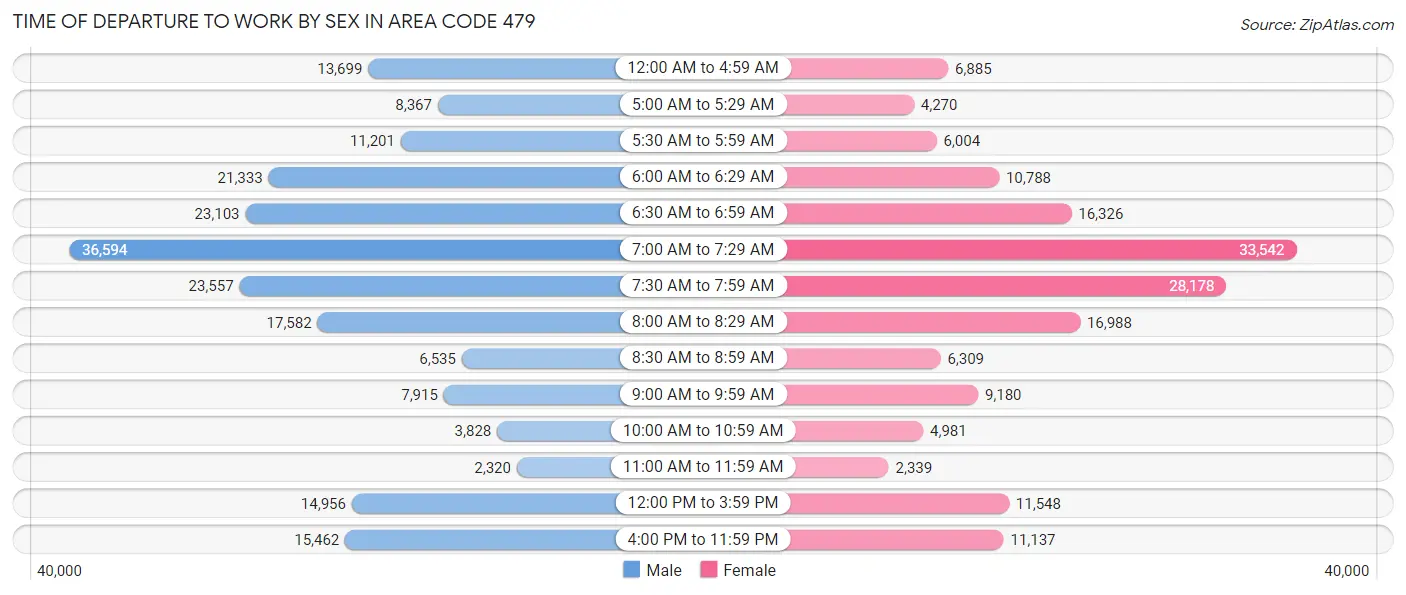
| Time of Departure | Male | Female |
| 12:00 AM to 4:59 AM | 13,699 (6.6%) | 6,885 (4.1%) |
| 5:00 AM to 5:29 AM | 8,367 (4.1%) | 4,270 (2.5%) |
| 5:30 AM to 5:59 AM | 11,201 (5.4%) | 6,004 (3.6%) |
| 6:00 AM to 6:29 AM | 21,333 (10.3%) | 10,788 (6.4%) |
| 6:30 AM to 6:59 AM | 23,103 (11.2%) | 16,326 (9.7%) |
| 7:00 AM to 7:29 AM | 36,594 (17.7%) | 33,542 (19.9%) |
| 7:30 AM to 7:59 AM | 23,557 (11.4%) | 28,178 (16.7%) |
| 8:00 AM to 8:29 AM | 17,582 (8.5%) | 16,988 (10.1%) |
| 8:30 AM to 8:59 AM | 6,535 (3.2%) | 6,309 (3.7%) |
| 9:00 AM to 9:59 AM | 7,915 (3.8%) | 9,180 (5.4%) |
| 10:00 AM to 10:59 AM | 3,828 (1.8%) | 4,981 (3.0%) |
| 11:00 AM to 11:59 AM | 2,320 (1.1%) | 2,339 (1.4%) |
| 12:00 PM to 3:59 PM | 14,956 (7.2%) | 11,548 (6.9%) |
| 4:00 PM to 11:59 PM | 15,462 (7.5%) | 11,137 (6.6%) |
| Total | 206,452 (100.0%) | 168,475 (100.0%) |
Housing Occupancy in Area Code 479
Occupancy by Ownership in Area Code 479
Of the total 339,554 dwellings in Area Code 479, owner-occupied units account for 221,596 (65.3%), while renter-occupied units make up 117,958 (34.7%).
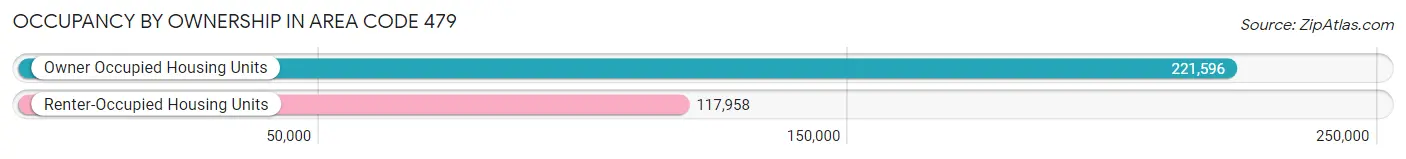
| Occupancy | # Housing Units | % Housing Units |
| Owner Occupied Housing Units | 221,596 | 65.3% |
| Renter-Occupied Housing Units | 117,958 | 34.7% |
| Total Occupied Housing Units | 339,554 | 100.0% |
Occupancy by Household Size in Area Code 479
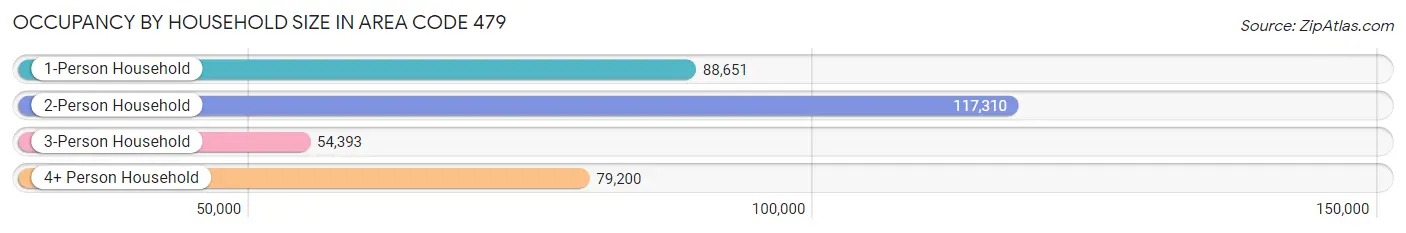
| Household Size | # Housing Units | % Housing Units |
| 1-Person Household | 88,651 | 26.1% |
| 2-Person Household | 117,310 | 34.5% |
| 3-Person Household | 54,393 | 16.0% |
| 4+ Person Household | 79,200 | 23.3% |
| Total Housing Units | 339,554 | 100.0% |
Occupancy by Ownership by Household Size in Area Code 479
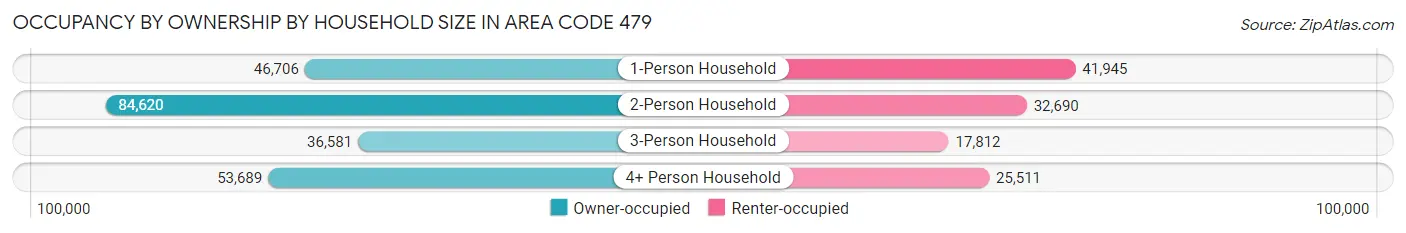
| Household Size | Owner-occupied | Renter-occupied |
| 1-Person Household | 46,706 (52.7%) | 41,945 (47.3%) |
| 2-Person Household | 84,620 (72.1%) | 32,690 (27.9%) |
| 3-Person Household | 36,581 (67.2%) | 17,812 (32.8%) |
| 4+ Person Household | 53,689 (67.8%) | 25,511 (32.2%) |
| Total Housing Units | 221,596 (65.3%) | 117,958 (34.7%) |
Occupancy by Educational Attainment in Area Code 479
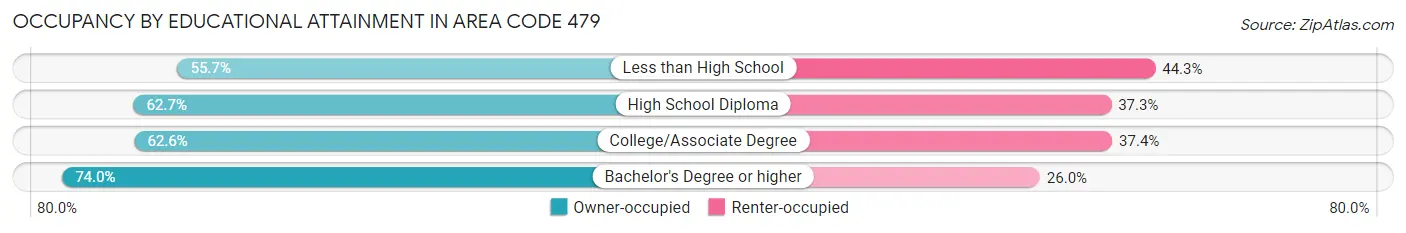
| Household Size | Owner-occupied | Renter-occupied |
| Less than High School | 21,305 (55.7%) | 16,923 (44.3%) |
| High School Diploma | 62,080 (62.7%) | 36,897 (37.3%) |
| College/Associate Degree | 63,267 (62.6%) | 37,847 (37.4%) |
| Bachelor's Degree or higher | 74,944 (74.0%) | 26,291 (26.0%) |
Occupancy by Age of Householder in Area Code 479
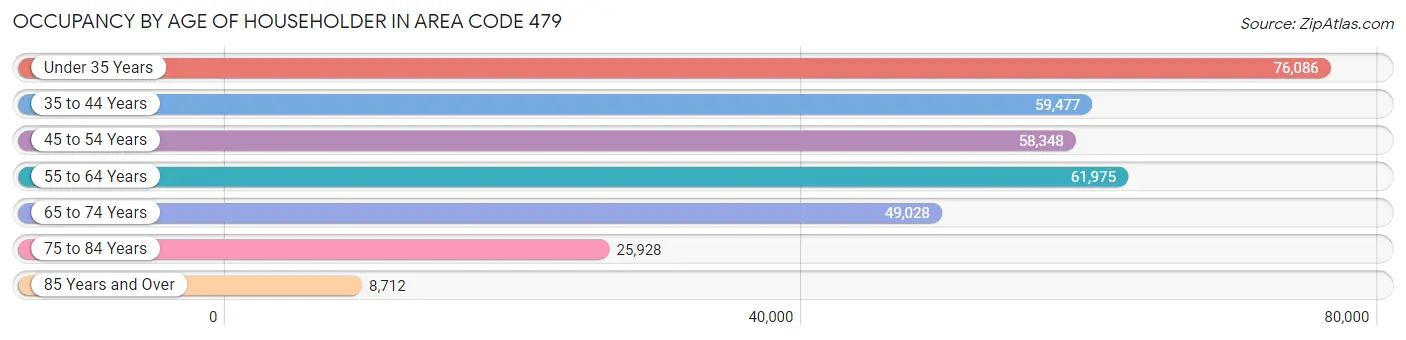
| Age Bracket | # Households | % Households |
| Under 35 Years | 76,086 | 22.4% |
| 35 to 44 Years | 59,477 | 17.5% |
| 45 to 54 Years | 58,348 | 17.2% |
| 55 to 64 Years | 61,975 | 18.2% |
| 65 to 74 Years | 49,028 | 14.4% |
| 75 to 84 Years | 25,928 | 7.6% |
| 85 Years and Over | 8,712 | 2.6% |
| Total | 339,554 | 100.0% |
Housing Finances in Area Code 479
Median Income by Occupancy in Area Code 479
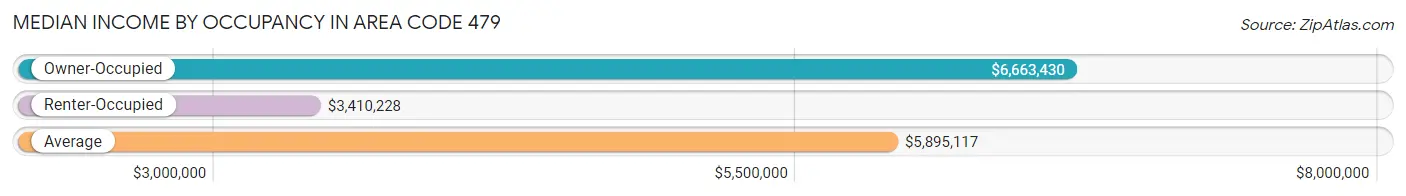
| Occupancy Type | # Households | Median Income |
| Owner-Occupied | 221,596 (65.3%) | $6,663,430 |
| Renter-Occupied | 117,958 (34.7%) | $3,410,228 |
| Average | 339,554 (100.0%) | $5,895,117 |
Occupancy by Householder Income Bracket in Area Code 479
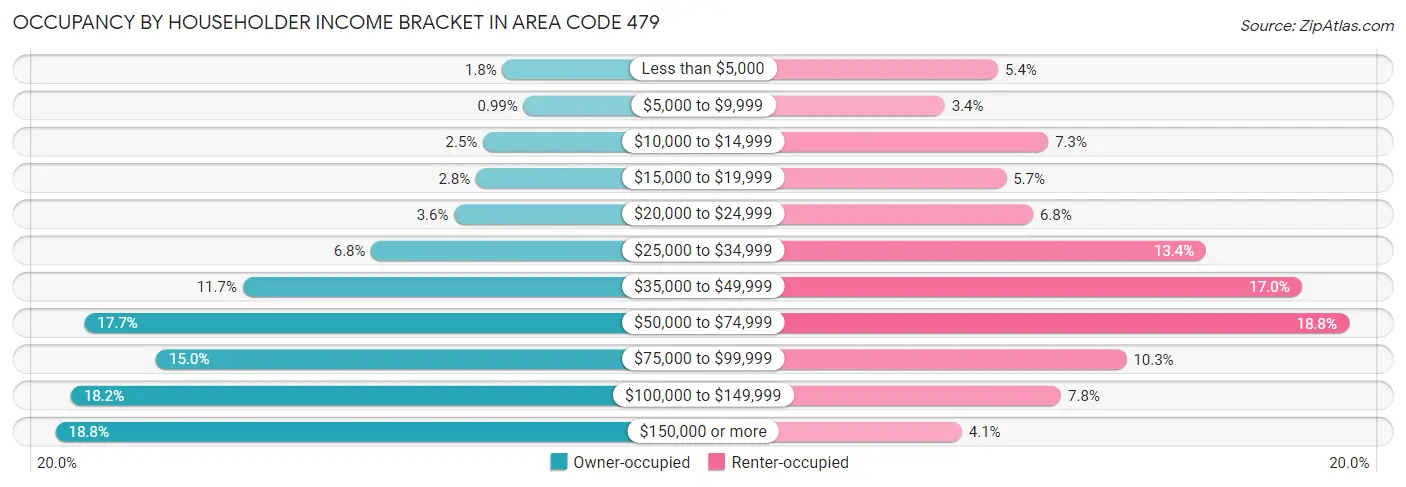
| Income Bracket | Owner-occupied | Renter-occupied |
| Less than $5,000 | 3,971 (1.8%) | 6,411 (5.4%) |
| $5,000 to $9,999 | 2,196 (1.0%) | 4,005 (3.4%) |
| $10,000 to $14,999 | 5,601 (2.5%) | 8,654 (7.3%) |
| $15,000 to $19,999 | 6,206 (2.8%) | 6,771 (5.7%) |
| $20,000 to $24,999 | 8,055 (3.6%) | 7,970 (6.8%) |
| $25,000 to $34,999 | 15,040 (6.8%) | 15,749 (13.4%) |
| $35,000 to $49,999 | 25,911 (11.7%) | 20,044 (17.0%) |
| $50,000 to $74,999 | 39,275 (17.7%) | 22,166 (18.8%) |
| $75,000 to $99,999 | 33,218 (15.0%) | 12,179 (10.3%) |
| $100,000 to $149,999 | 40,415 (18.2%) | 9,231 (7.8%) |
| $150,000 or more | 41,708 (18.8%) | 4,778 (4.1%) |
| Total | 221,596 (100.0%) | 117,958 (100.0%) |
Monthly Housing Cost Tiers in Area Code 479
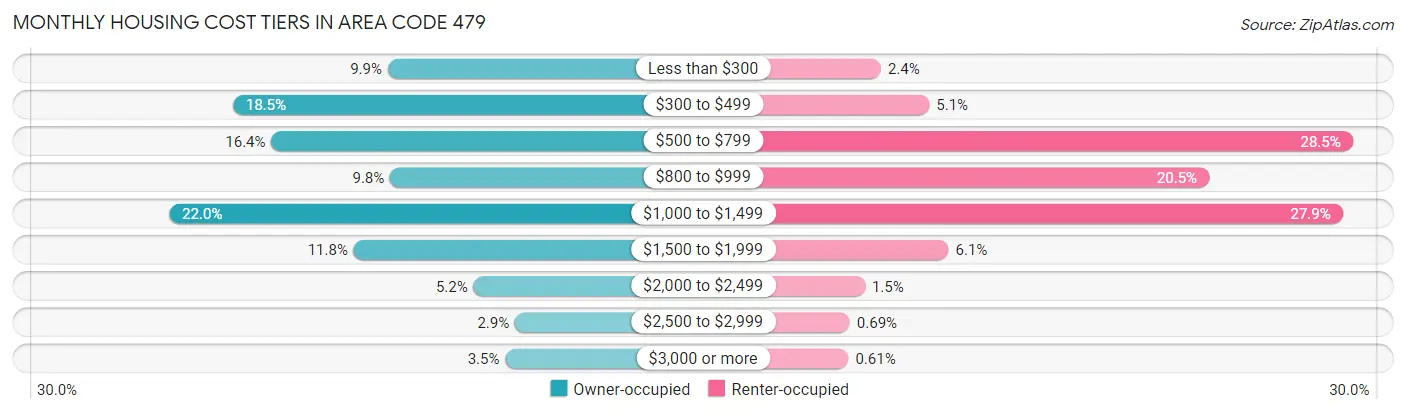
| Monthly Cost | Owner-occupied | Renter-occupied |
| Less than $300 | 22,019 (9.9%) | 2,837 (2.4%) |
| $300 to $499 | 41,001 (18.5%) | 5,998 (5.1%) |
| $500 to $799 | 36,267 (16.4%) | 33,563 (28.4%) |
| $800 to $999 | 21,734 (9.8%) | 24,209 (20.5%) |
| $1,000 to $1,499 | 48,795 (22.0%) | 32,915 (27.9%) |
| $1,500 to $1,999 | 26,187 (11.8%) | 7,247 (6.1%) |
| $2,000 to $2,499 | 11,513 (5.2%) | 1,796 (1.5%) |
| $2,500 to $2,999 | 6,443 (2.9%) | 816 (0.7%) |
| $3,000 or more | 7,637 (3.5%) | 719 (0.6%) |
| Total | 221,596 (100.0%) | 117,958 (100.0%) |
Physical Housing Characteristics in Area Code 479
Housing Structures in Area Code 479
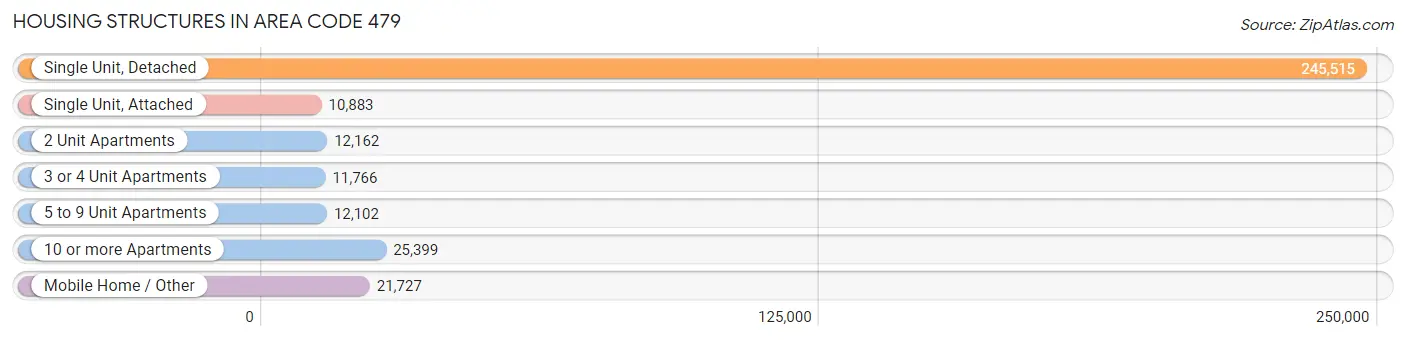
| Structure Type | # Housing Units | % Housing Units |
| Single Unit, Detached | 245,515 | 72.3% |
| Single Unit, Attached | 10,883 | 3.2% |
| 2 Unit Apartments | 12,162 | 3.6% |
| 3 or 4 Unit Apartments | 11,766 | 3.5% |
| 5 to 9 Unit Apartments | 12,102 | 3.6% |
| 10 or more Apartments | 25,399 | 7.5% |
| Mobile Home / Other | 21,727 | 6.4% |
| Total | 339,554 | 100.0% |
Housing Structures by Occupancy in Area Code 479
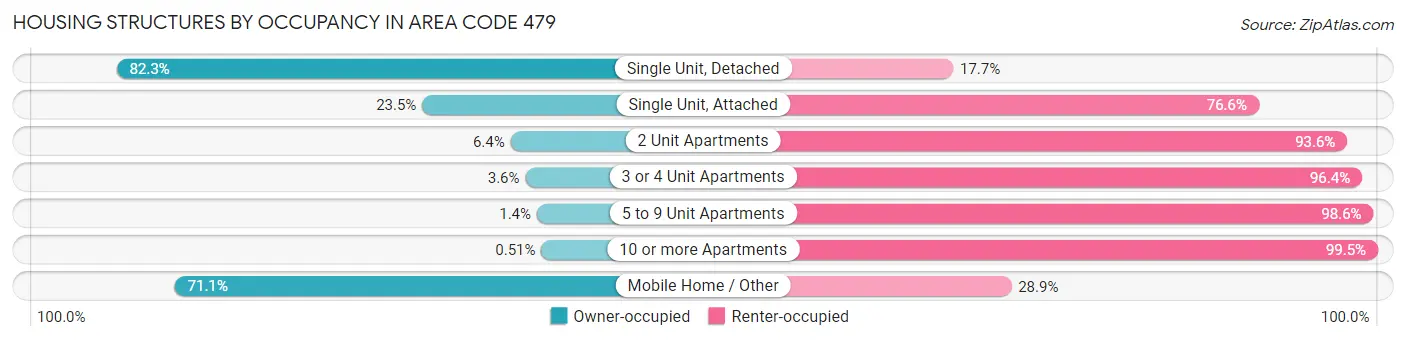
| Structure Type | Owner-occupied | Renter-occupied |
| Single Unit, Detached | 202,095 (82.3%) | 43,420 (17.7%) |
| Single Unit, Attached | 2,552 (23.4%) | 8,331 (76.5%) |
| 2 Unit Apartments | 782 (6.4%) | 11,380 (93.6%) |
| 3 or 4 Unit Apartments | 421 (3.6%) | 11,345 (96.4%) |
| 5 to 9 Unit Apartments | 166 (1.4%) | 11,936 (98.6%) |
| 10 or more Apartments | 130 (0.5%) | 25,269 (99.5%) |
| Mobile Home / Other | 15,450 (71.1%) | 6,277 (28.9%) |
| Total | 221,596 (65.3%) | 117,958 (34.7%) |
Housing Structures by Number of Rooms in Area Code 479
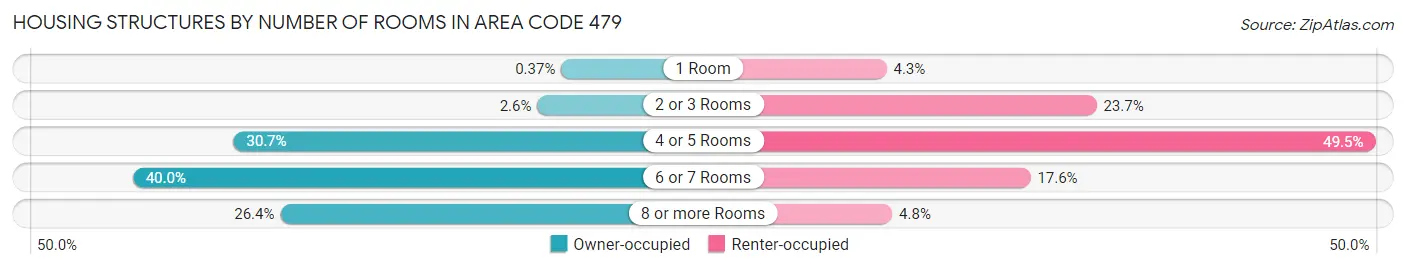
| Number of Rooms | Owner-occupied | Renter-occupied |
| 1 Room | 825 (0.4%) | 5,089 (4.3%) |
| 2 or 3 Rooms | 5,721 (2.6%) | 27,992 (23.7%) |
| 4 or 5 Rooms | 68,011 (30.7%) | 58,396 (49.5%) |
| 6 or 7 Rooms | 88,643 (40.0%) | 20,786 (17.6%) |
| 8 or more Rooms | 58,396 (26.4%) | 5,695 (4.8%) |
| Total | 221,596 (100.0%) | 117,958 (100.0%) |
Housing Structure by Heating Type in Area Code 479
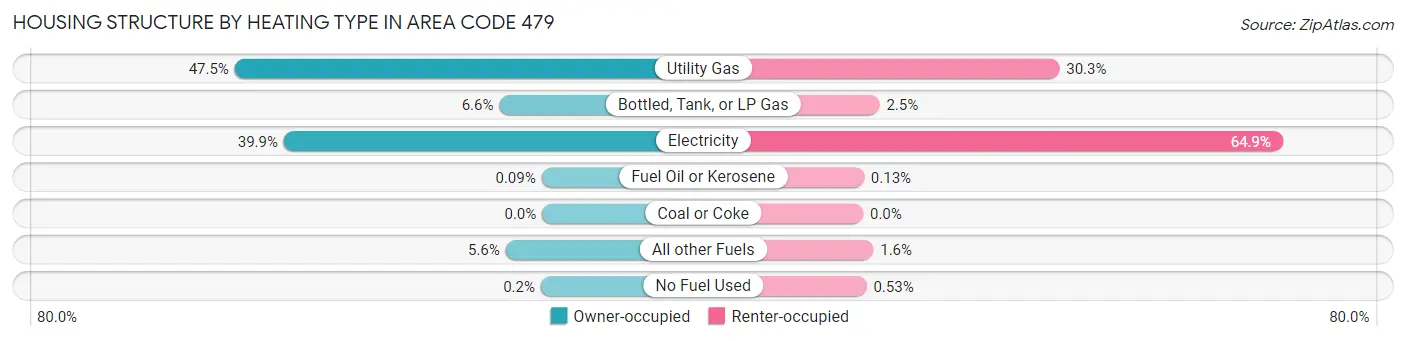
| Heating Type | Owner-occupied | Renter-occupied |
| Utility Gas | 105,310 (47.5%) | 35,794 (30.3%) |
| Bottled, Tank, or LP Gas | 14,654 (6.6%) | 2,998 (2.5%) |
| Electricity | 88,482 (39.9%) | 76,526 (64.9%) |
| Fuel Oil or Kerosene | 207 (0.1%) | 156 (0.1%) |
| Coal or Coke | 0 (0.0%) | 0 (0.0%) |
| All other Fuels | 12,496 (5.6%) | 1,864 (1.6%) |
| No Fuel Used | 447 (0.2%) | 620 (0.5%) |
| Total | 221,596 (100.0%) | 117,958 (100.0%) |
Household Vehicle Usage in Area Code 479
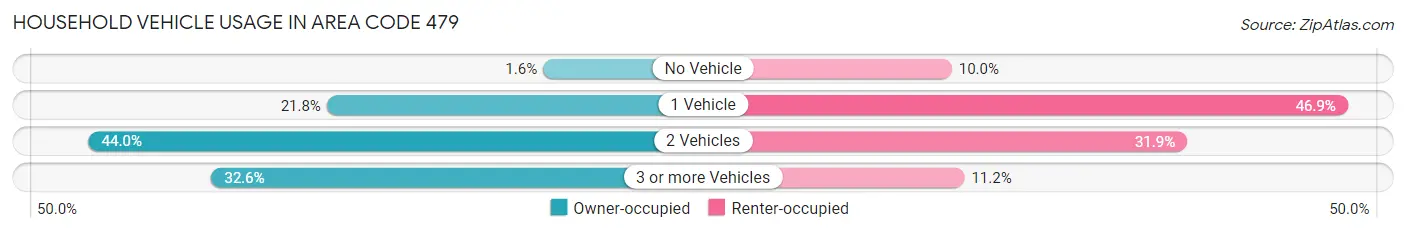
| Vehicles per Household | Owner-occupied | Renter-occupied |
| No Vehicle | 3,571 (1.6%) | 11,771 (10.0%) |
| 1 Vehicle | 48,301 (21.8%) | 55,356 (46.9%) |
| 2 Vehicles | 97,549 (44.0%) | 37,662 (31.9%) |
| 3 or more Vehicles | 72,175 (32.6%) | 13,169 (11.2%) |
| Total | 221,596 (100.0%) | 117,958 (100.0%) |
Real Estate & Mortgages in Area Code 479
Real Estate and Mortgage Overview in Area Code 479
| Characteristic | Without Mortgage | With Mortgage |
| Housing Units | 93,289 | 128,307 |
| Median Property Value | $13,858,400 | $16,248,900 |
| Median Household Income | $5,337,540 | $30,758 |
| Monthly Housing Costs | $39,016 | $7,483 |
| Real Estate Taxes | $76,367 | $4,881 |
Property Value by Mortgage Status in Area Code 479
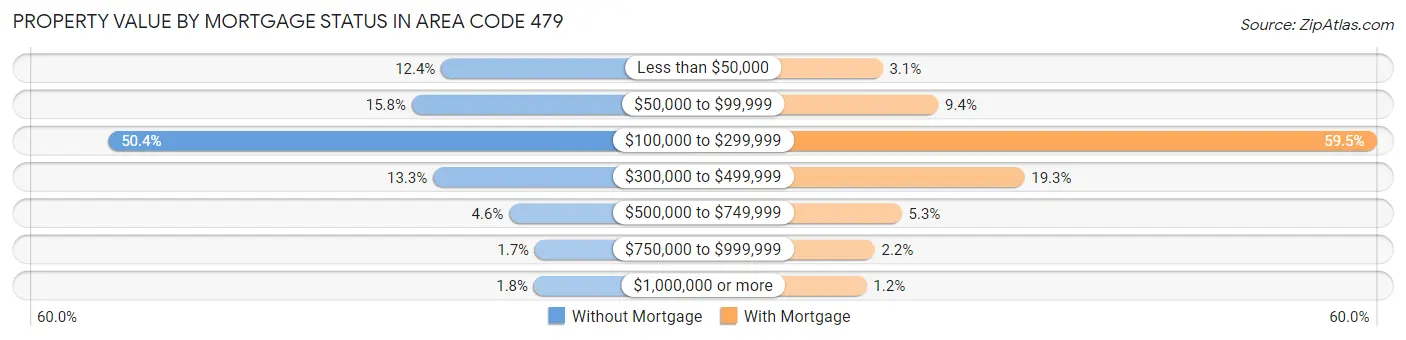
| Property Value | Without Mortgage | With Mortgage |
| Less than $50,000 | 11,558 (12.4%) | 3,954 (3.1%) |
| $50,000 to $99,999 | 14,690 (15.8%) | 12,118 (9.4%) |
| $100,000 to $299,999 | 47,054 (50.4%) | 76,364 (59.5%) |
| $300,000 to $499,999 | 12,424 (13.3%) | 24,748 (19.3%) |
| $500,000 to $749,999 | 4,313 (4.6%) | 6,751 (5.3%) |
| $750,000 to $999,999 | 1,570 (1.7%) | 2,785 (2.2%) |
| $1,000,000 or more | 1,680 (1.8%) | 1,587 (1.2%) |
| Total | 93,289 (100.0%) | 128,307 (100.0%) |
Household Income by Mortgage Status in Area Code 479
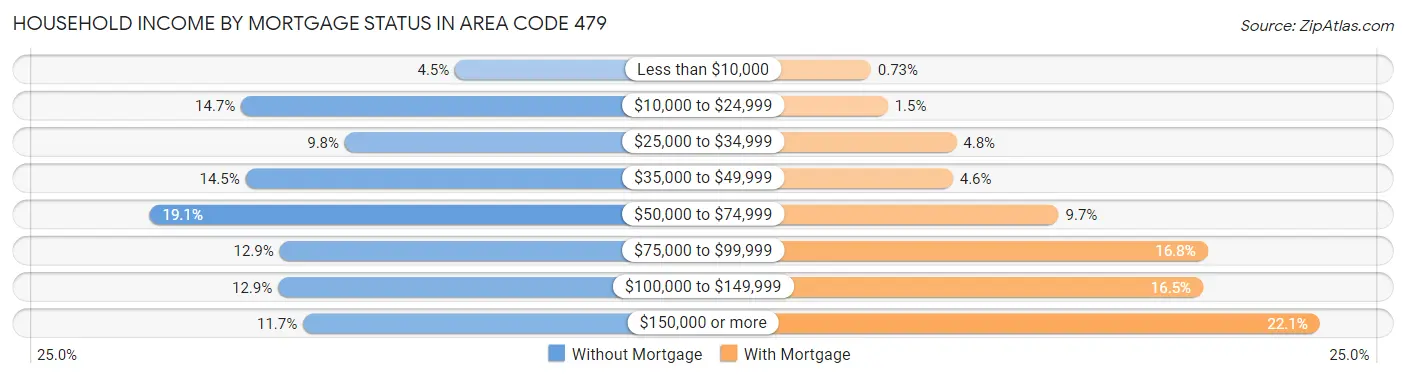
| Household Income | Without Mortgage | With Mortgage |
| Less than $10,000 | 4,199 (4.5%) | 943 (0.7%) |
| $10,000 to $24,999 | 13,708 (14.7%) | 1,968 (1.5%) |
| $25,000 to $34,999 | 9,099 (9.8%) | 6,154 (4.8%) |
| $35,000 to $49,999 | 13,509 (14.5%) | 5,941 (4.6%) |
| $50,000 to $74,999 | 17,772 (19.1%) | 12,402 (9.7%) |
| $75,000 to $99,999 | 11,993 (12.9%) | 21,503 (16.8%) |
| $100,000 to $149,999 | 12,059 (12.9%) | 21,225 (16.5%) |
| $150,000 or more | 10,950 (11.7%) | 28,356 (22.1%) |
| Total | 93,289 (100.0%) | 128,307 (100.0%) |
Property Value to Household Income Ratio in Area Code 479
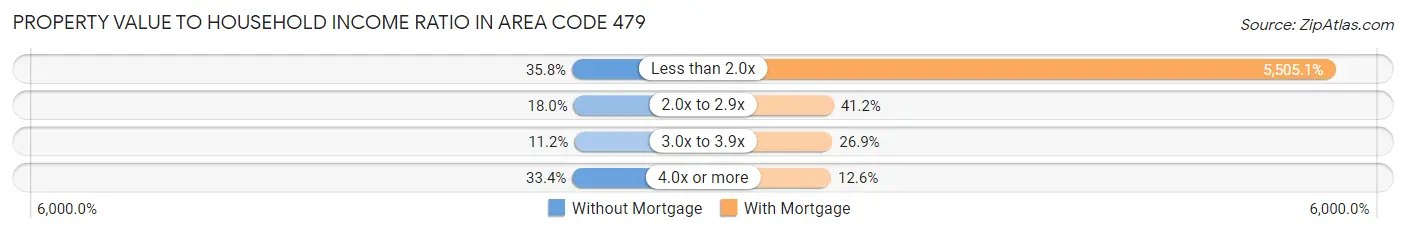
| Value-to-Income Ratio | Without Mortgage | With Mortgage |
| Less than 2.0x | 33,354 (35.7%) | 7,063,404 (5,505.1%) |
| 2.0x to 2.9x | 16,827 (18.0%) | 52,881 (41.2%) |
| 3.0x to 3.9x | 10,439 (11.2%) | 34,481 (26.9%) |
| 4.0x or more | 31,155 (33.4%) | 16,176 (12.6%) |
| Total | 93,289 (100.0%) | 128,307 (100.0%) |
Real Estate Taxes by Mortgage Status in Area Code 479
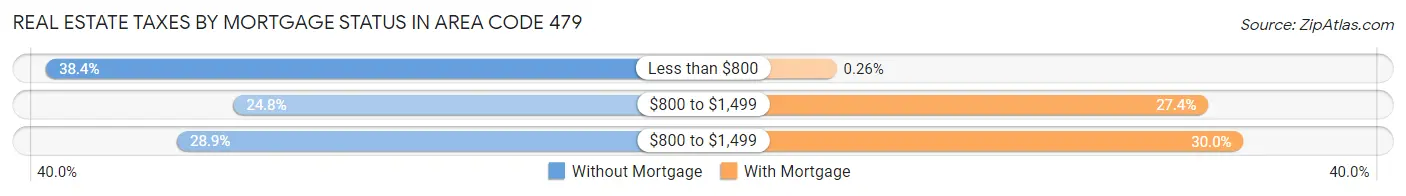
| Property Taxes | Without Mortgage | With Mortgage |
| Less than $800 | 35,852 (38.4%) | 337 (0.3%) |
| $800 to $1,499 | 23,085 (24.7%) | 35,168 (27.4%) |
| $800 to $1,499 | 26,924 (28.9%) | 38,472 (30.0%) |
| Total | 93,289 (100.0%) | 128,307 (100.0%) |
Health & Disability in Area Code 479
Health Insurance Coverage by Age in Area Code 479
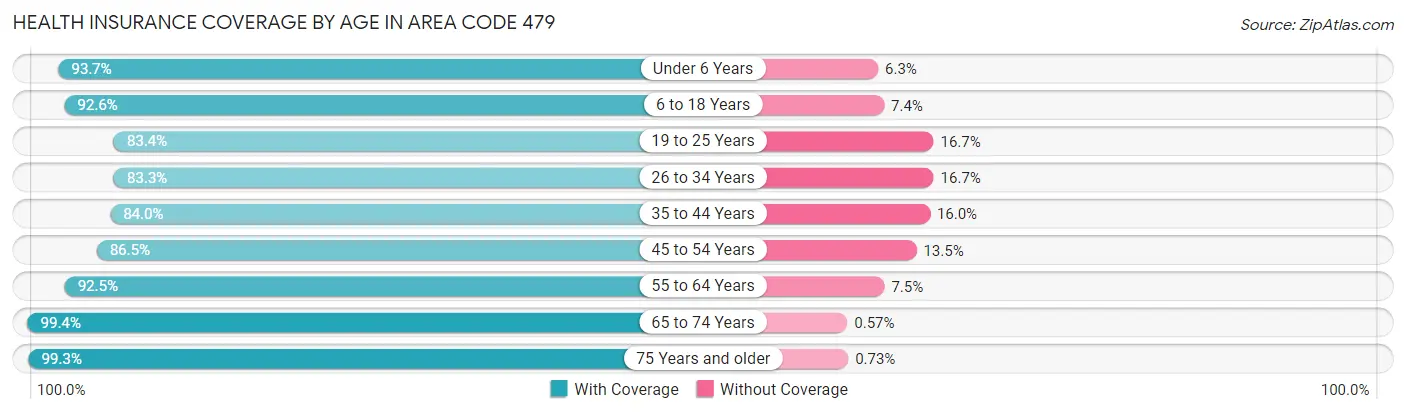
| Age Bracket | With Coverage | Without Coverage |
| Under 6 Years | 63,444 (93.7%) | 4,264 (6.3%) |
| 6 to 18 Years | 148,541 (92.6%) | 11,924 (7.4%) |
| 19 to 25 Years | 76,917 (83.4%) | 15,367 (16.7%) |
| 26 to 34 Years | 89,603 (83.3%) | 17,911 (16.7%) |
| 35 to 44 Years | 96,235 (84.0%) | 18,294 (16.0%) |
| 45 to 54 Years | 92,306 (86.5%) | 14,356 (13.5%) |
| 55 to 64 Years | 98,093 (92.5%) | 7,944 (7.5%) |
| 65 to 74 Years | 78,814 (99.4%) | 452 (0.6%) |
| 75 Years and older | 52,628 (99.3%) | 386 (0.7%) |
| Total | 796,581 (89.8%) | 90,898 (10.2%) |
Health Insurance Coverage by Citizenship Status in Area Code 479
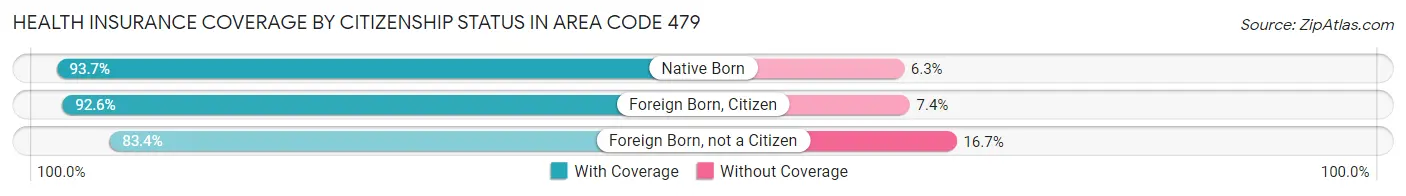
| Citizenship Status | With Coverage | Without Coverage |
| Native Born | 63,444 (93.7%) | 4,264 (6.3%) |
| Foreign Born, Citizen | 148,541 (92.6%) | 11,924 (7.4%) |
| Foreign Born, not a Citizen | 76,917 (83.4%) | 15,367 (16.7%) |
Health Insurance Coverage by Household Income in Area Code 479
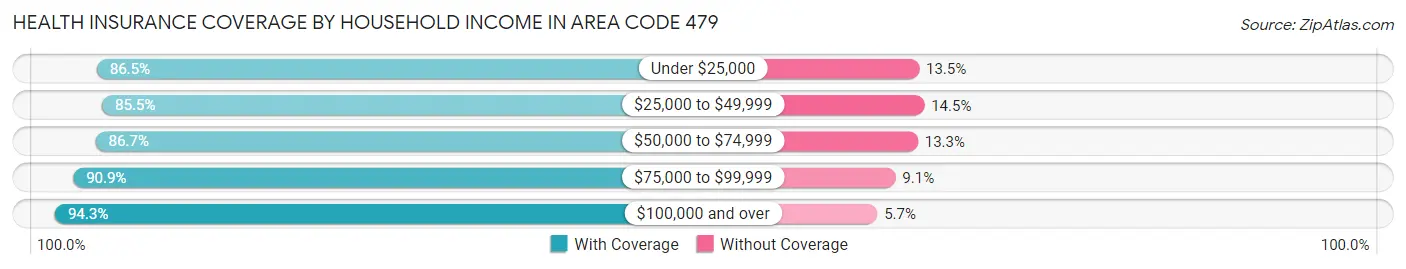
| Household Income | With Coverage | Without Coverage |
| Under $25,000 | 90,420 (86.5%) | 14,154 (13.5%) |
| $25,000 to $49,999 | 148,601 (85.5%) | 25,227 (14.5%) |
| $50,000 to $74,999 | 142,020 (86.7%) | 21,789 (13.3%) |
| $75,000 to $99,999 | 119,296 (90.9%) | 11,957 (9.1%) |
| $100,000 and over | 284,234 (94.3%) | 17,191 (5.7%) |
Public vs Private Health Insurance Coverage by Age in Area Code 479
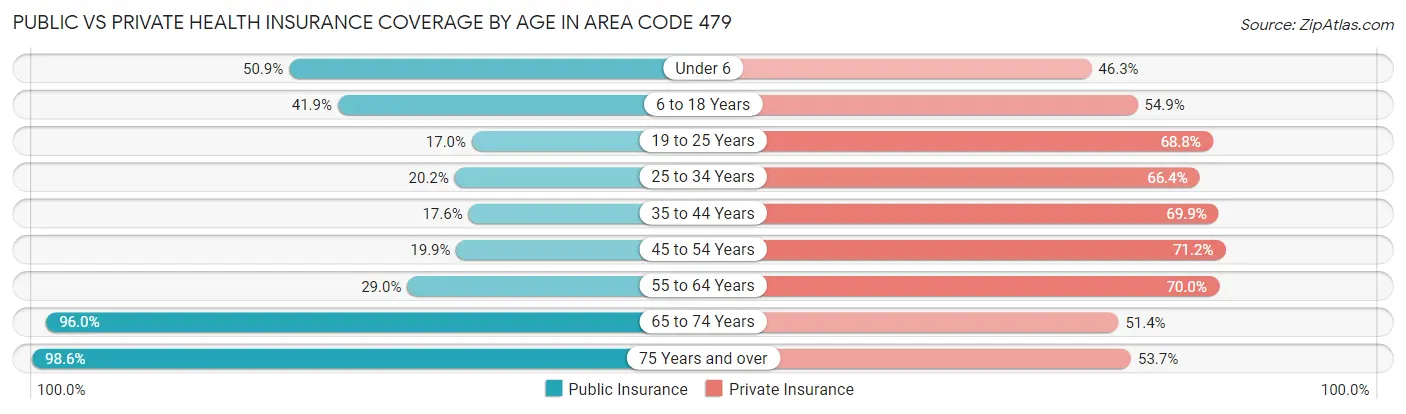
| Age Bracket | Public Insurance | Private Insurance |
| Under 6 | 34,467 (50.9%) | 31,372 (46.3%) |
| 6 to 18 Years | 67,190 (41.9%) | 88,103 (54.9%) |
| 19 to 25 Years | 15,674 (17.0%) | 63,527 (68.8%) |
| 25 to 34 Years | 21,692 (20.2%) | 71,392 (66.4%) |
| 35 to 44 Years | 20,167 (17.6%) | 80,100 (69.9%) |
| 45 to 54 Years | 21,181 (19.9%) | 75,901 (71.2%) |
| 55 to 64 Years | 30,731 (29.0%) | 74,186 (70.0%) |
| 65 to 74 Years | 76,080 (96.0%) | 40,703 (51.3%) |
| 75 Years and over | 52,264 (98.6%) | 28,465 (53.7%) |
| Total | 339,446 (38.3%) | 553,749 (62.4%) |
Disability Status by Sex by Age in Area Code 479
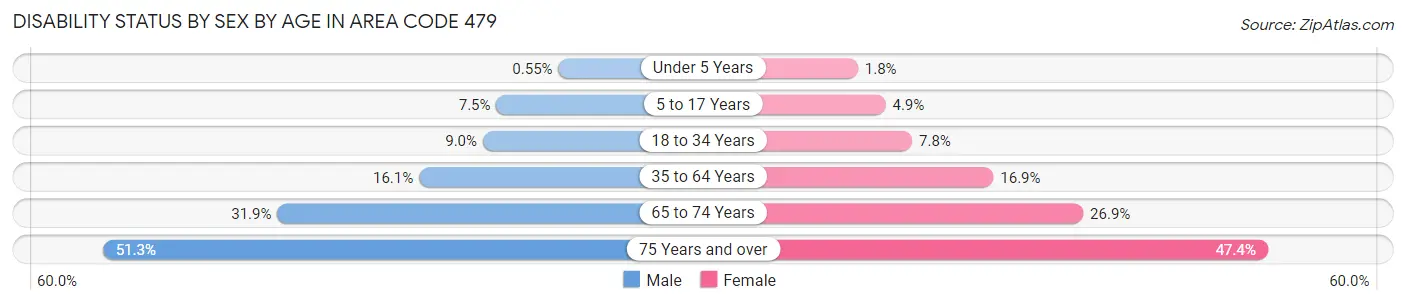
| Age Bracket | Male | Female |
| Under 5 Years | 159 (0.5%) | 492 (1.8%) |
| 5 to 17 Years | 6,026 (7.5%) | 3,756 (4.9%) |
| 18 to 34 Years | 9,755 (9.0%) | 8,219 (7.8%) |
| 35 to 64 Years | 26,439 (16.1%) | 27,470 (16.9%) |
| 65 to 74 Years | 12,029 (31.9%) | 11,157 (26.9%) |
| 75 Years and over | 11,519 (51.3%) | 14,493 (47.4%) |
Disability Class by Sex by Age in Area Code 479
Disability Class: Hearing Difficulty
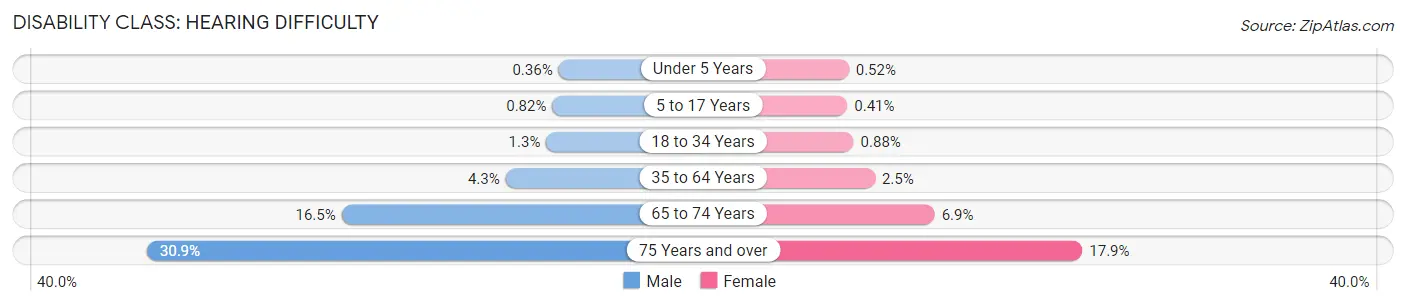
| Age Bracket | Male | Female |
| Under 5 Years | 104 (0.4%) | 144 (0.5%) |
| 5 to 17 Years | 662 (0.8%) | 313 (0.4%) |
| 18 to 34 Years | 1,386 (1.3%) | 927 (0.9%) |
| 35 to 64 Years | 7,052 (4.3%) | 4,003 (2.5%) |
| 65 to 74 Years | 6,219 (16.5%) | 2,862 (6.9%) |
| 75 Years and over | 6,942 (30.9%) | 5,458 (17.9%) |
Disability Class: Vision Difficulty
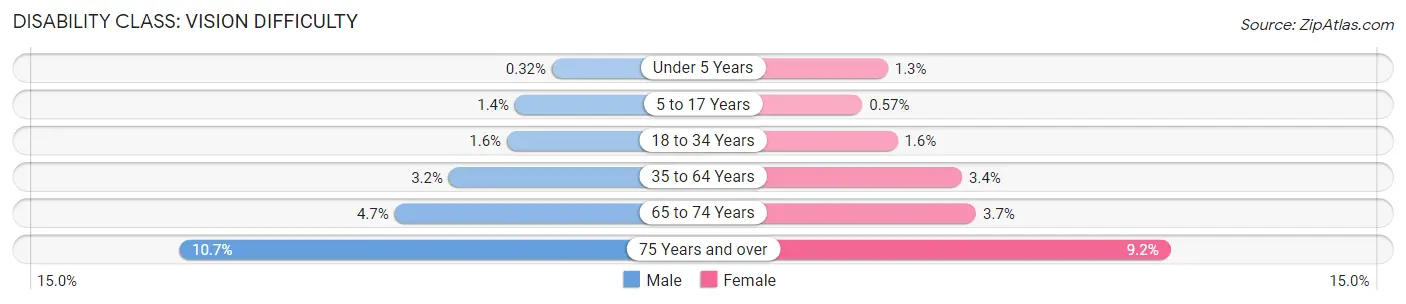
| Age Bracket | Male | Female |
| Under 5 Years | 93 (0.3%) | 351 (1.3%) |
| 5 to 17 Years | 1,087 (1.3%) | 437 (0.6%) |
| 18 to 34 Years | 1,709 (1.6%) | 1,627 (1.5%) |
| 35 to 64 Years | 5,240 (3.2%) | 5,447 (3.4%) |
| 65 to 74 Years | 1,773 (4.7%) | 1,554 (3.7%) |
| 75 Years and over | 2,403 (10.7%) | 2,797 (9.1%) |
Disability Class: Cognitive Difficulty
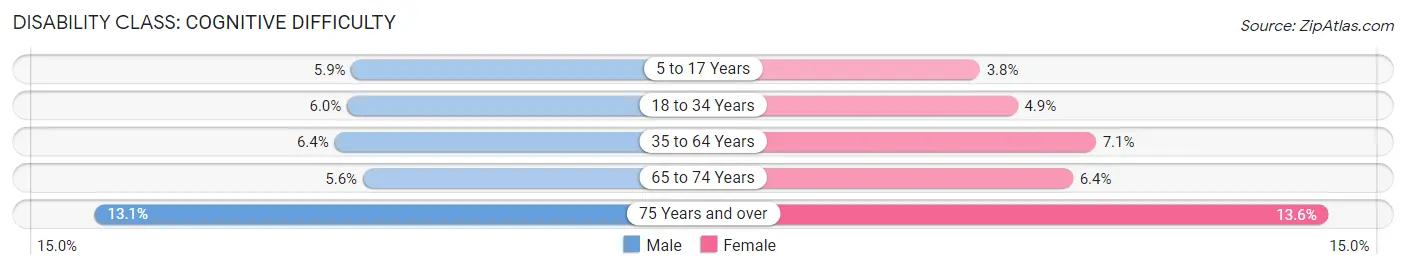
| Age Bracket | Male | Female |
| 5 to 17 Years | 4,765 (5.9%) | 2,962 (3.8%) |
| 18 to 34 Years | 6,547 (6.0%) | 5,127 (4.9%) |
| 35 to 64 Years | 10,476 (6.4%) | 11,511 (7.1%) |
| 65 to 74 Years | 2,106 (5.6%) | 2,669 (6.4%) |
| 75 Years and over | 2,930 (13.1%) | 4,140 (13.6%) |
Disability Class: Ambulatory Difficulty
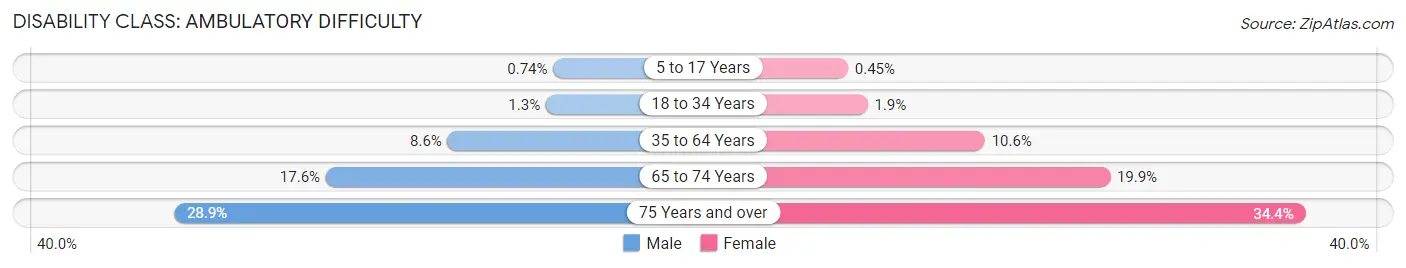
| Age Bracket | Male | Female |
| 5 to 17 Years | 597 (0.7%) | 346 (0.4%) |
| 18 to 34 Years | 1,399 (1.3%) | 2,008 (1.9%) |
| 35 to 64 Years | 14,133 (8.6%) | 17,264 (10.6%) |
| 65 to 74 Years | 6,655 (17.6%) | 8,265 (19.9%) |
| 75 Years and over | 6,491 (28.9%) | 10,521 (34.4%) |
Disability Class: Self-Care Difficulty
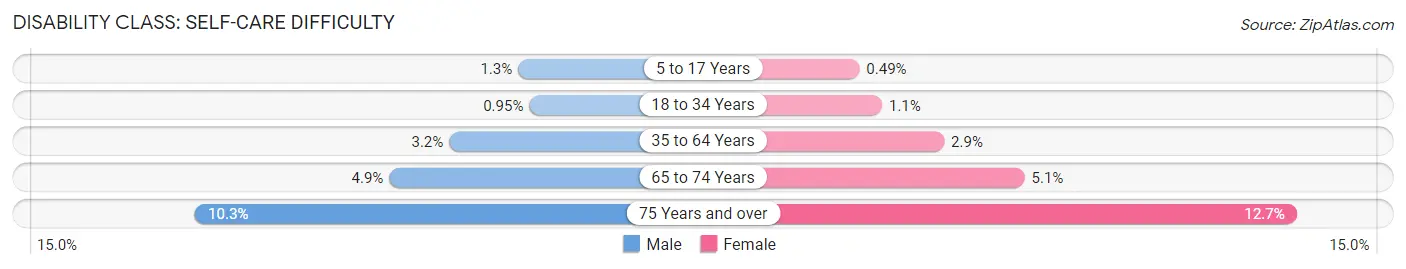
| Age Bracket | Male | Female |
| 5 to 17 Years | 1,018 (1.3%) | 380 (0.5%) |
| 18 to 34 Years | 1,033 (0.9%) | 1,174 (1.1%) |
| 35 to 64 Years | 5,235 (3.2%) | 4,635 (2.9%) |
| 65 to 74 Years | 1,833 (4.9%) | 2,114 (5.1%) |
| 75 Years and over | 2,302 (10.2%) | 3,869 (12.7%) |
Technology Access in Area Code 479
Computing Device Access in Area Code 479
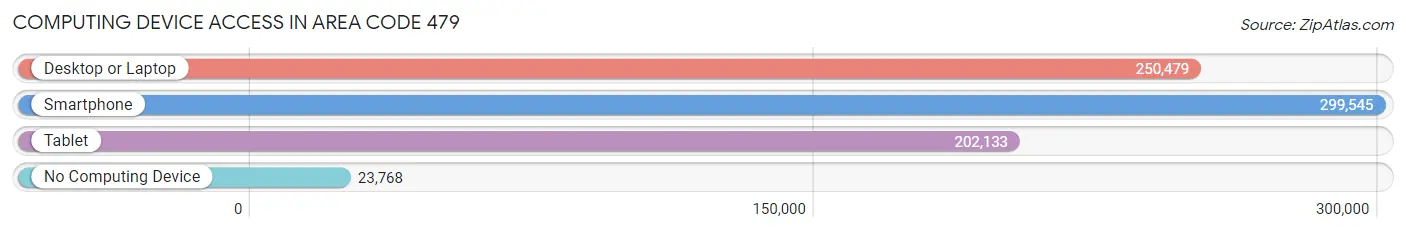
| Device Type | # Households | % Households |
| Desktop or Laptop | 250,479 | 73.8% |
| Smartphone | 299,545 | 88.2% |
| Tablet | 202,133 | 59.5% |
| No Computing Device | 23,768 | 7.0% |
| Total | 339,554 | 100.0% |
Internet Access in Area Code 479
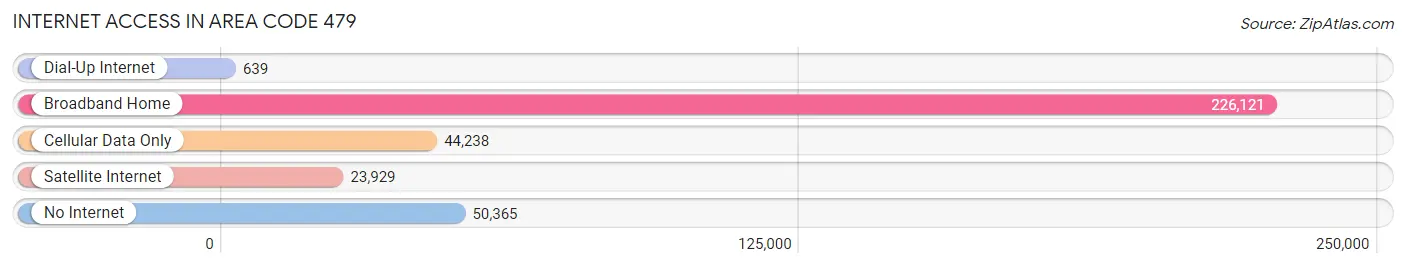
| Internet Type | # Households | % Households |
| Dial-Up Internet | 639 | 0.2% |
| Broadband Home | 226,121 | 66.6% |
| Cellular Data Only | 44,238 | 13.0% |
| Satellite Internet | 23,929 | 7.0% |
| No Internet | 50,365 | 14.8% |
| Total | 339,554 | 100.0% |
Area Code 479 Summary
Geography
Area code 479 is located in the state of Arkansas and covers the northwest corner of the state. It includes the cities of Fort Smith, Fayetteville, Springdale, Rogers, and Bentonville.
Social
Area code 479 is home to a diverse population of people from all walks of life. The area is known for its friendly and welcoming atmosphere, and its residents are proud of their heritage and culture.
Economics
Area code 479 is a major economic hub in the state of Arkansas. It is home to several large corporations, including Walmart, Tyson Foods, and J.B. Hunt. The area is also home to a number of small businesses, including restaurants, retail stores, and service providers.
Demographics
Area code 479 is home to a population of over 1.2 million people. The population is diverse, with a mix of races, ethnicities, and religions. The median household income is around $50,000, and the unemployment rate is around 4%.
Common Questions
What is Per Capita Income in Area Code 479?
Per Capita income in Area Code 479 is $29,778.
What is the Median Family Income in Area Code 479?
Median Family Income in Area Code 479 is $69,818.
What is the Median Household income in Area Code 479?
Median Household Income in Area Code 479 is $58,367.
What is Income or Wage Gap in Area Code 479?
Income or Wage Gap in Area Code 479 is 27.4%.
Women in Area Code 479 earn 72.6 cents for every dollar earned by a man.
What is Family Income Deficit in Area Code 479?
Family Income Deficit in Area Code 479 is $9,701.
Families that are below poverty line in Area Code 479 earn $9,701 less on average than the poverty threshold level.
What is Inequality or Gini Index in Area Code 479?
Inequality or Gini Index in Area Code 479 is 44.19.
What is the Total Population of Area Code 479?
Total Population of Area Code 479 is 895,337.
What is the Total Male Population of Area Code 479?
Total Male Population of Area Code 479 is 447,356.
What is the Total Female Population of Area Code 479?
Total Female Population of Area Code 479 is 447,981.
What is the Ratio of Males per 100 Females in Area Code 479?
There are 99.86 Males per 100 Females in Area Code 479.
What is the Ratio of Females per 100 Males in Area Code 479?
There are 100.14 Females per 100 Males in Area Code 479.
What is the Median Population Age in Area Code 479?
Median Population Age in Area Code 479 is 43.6 Years.
What is the Average Family Size in Area Code 479
Average Family Size in Area Code 479 is 3.0 People.
What is the Average Household Size in Area Code 479
Average Household Size in Area Code 479 is 2.5 People.
How Large is the Labor Force in Area Code 479?
There are 375,228 People in the Labor Forcein in Area Code 479.
What is the Percentage of People in the Labor Force in Area Code 479?
53.1% of People are in the Labor Force in Area Code 479.
What is the Unemployment Rate in Area Code 479?
Unemployment Rate in Area Code 479 is 4.5%.