Zip Codes with the Highest Percentage of Immigrants from Burma / Myanmar in North Carolina

RELATED REPORTS & OPTIONS

Burma / Myanmar
Population
Families and Households
Female Fertility
Female Fertility (Unmarried)
Race (Community Size)
Race (Percentage)
Ancestry (Community Size)
AfghanAfricanAlaska NativeAlaskan AthabascanAlbanianAleutAlsatianAmericanApacheArabArapahoArgentineanArmenianAssyrian / Chaldean / SyriacAustralianAustrianBahamianBangladeshiBarbadianBasqueBelgianBelizeanBermudanBhutaneseBlackfeetBolivianBrazilianBritishBritish West IndianBulgarianBurmeseCajunCambodianCanadianCape VerdeanCarpatho RusynCelticCentral AmericanCentral American IndianCherokeeCheyenneChickasawChileanChineseChippewaChoctawColombianColvilleComancheCosta RicanCreeCreekCroatianCrowCubanCypriotCzechCzechoslovakianDanishDelawareDominicanDutchDutch West IndianEastern EuropeanEcuadorianEgyptianEnglishEstonianEthiopianEuropeanFijianFilipinoFinnishFrenchFrench American IndianFrench CanadianGermanGerman RussianGhanaianGreekGuamanian / ChamorroGuatemalanGuyaneseHaitianHmongHonduranHopiHoumaHungarianIcelanderIndian (Asian)IndonesianInupiatIranianIraqiIrishIroquoisIsraeliItalianJamaicanJapaneseJordanianKenyanKiowaKoreanLaotianLatvianLebaneseLiberianLithuanianLumbeeLuxembourgerMacedonianMalaysianMalteseMarshalleseMenomineeMexicanMexican American IndianMongolianMoroccanNative HawaiianNavajoNepaleseNew ZealanderNicaraguanNigerianNorthern EuropeanNorwegianOkinawanOsageOttawaPaiutePakistaniPalestinianPanamanianParaguayanPennsylvania GermanPeruvianPimaPolishPortuguesePotawatomiPuebloPuerto RicanPuget Sound SalishRomanianRussianSalvadoranSamoanScandinavianScotch-IrishScottishSeminoleSenegaleseSerbianShoshoneSierra LeoneanSiouxSlavicSlovakSloveneSomaliSouth AfricanSouth AmericanSouth American IndianSoviet UnionSpaniardSpanishSpanish AmericanSpanish American IndianSri LankanSubsaharan AfricanSudaneseSwedishSwissSyrianTaiwaneseThaiTlingit-HaidaTohono O'OdhamTonganTrinidadian and TobagonianTsimshianTurkishU.S. Virgin IslanderUgandanUkrainianUruguayanUteVenezuelanVietnameseWelshWest IndianYakamaYaquiYugoslavianYumanYup'ikZimbabwean
Ancestry (Percentage)
AfghanAfricanAlaska NativeAlaskan AthabascanAlbanianAleutAlsatianAmericanApacheArabArapahoArgentineanArmenianAssyrian / Chaldean / SyriacAustralianAustrianBahamianBangladeshiBarbadianBasqueBelgianBelizeanBermudanBhutaneseBlackfeetBolivianBrazilianBritishBritish West IndianBulgarianBurmeseCajunCambodianCanadianCape VerdeanCarpatho RusynCelticCentral AmericanCentral American IndianCherokeeCheyenneChickasawChileanChineseChippewaChoctawColombianColvilleComancheCosta RicanCreeCreekCroatianCrowCubanCypriotCzechCzechoslovakianDanishDelawareDominicanDutchDutch West IndianEastern EuropeanEcuadorianEgyptianEnglishEstonianEthiopianEuropeanFijianFilipinoFinnishFrenchFrench American IndianFrench CanadianGermanGerman RussianGhanaianGreekGuamanian / ChamorroGuatemalanGuyaneseHaitianHmongHonduranHopiHoumaHungarianIcelanderIndian (Asian)IndonesianInupiatIranianIraqiIrishIroquoisIsraeliItalianJamaicanJapaneseJordanianKenyanKiowaKoreanLaotianLatvianLebaneseLiberianLithuanianLumbeeLuxembourgerMacedonianMalaysianMalteseMarshalleseMenomineeMexicanMexican American IndianMongolianMoroccanNative HawaiianNavajoNepaleseNew ZealanderNicaraguanNigerianNorthern EuropeanNorwegianOkinawanOsageOttawaPaiutePakistaniPalestinianPanamanianParaguayanPennsylvania GermanPeruvianPimaPolishPortuguesePotawatomiPuebloPuerto RicanPuget Sound SalishRomanianRussianSalvadoranSamoanScandinavianScotch-IrishScottishSeminoleSenegaleseSerbianShoshoneSierra LeoneanSiouxSlavicSlovakSloveneSomaliSouth AfricanSouth AmericanSouth American IndianSoviet UnionSpaniardSpanishSpanish AmericanSpanish American IndianSri LankanSubsaharan AfricanSudaneseSwedishSwissSyrianTaiwaneseThaiTlingit-HaidaTohono O'OdhamTonganTrinidadian and TobagonianTsimshianTurkishU.S. Virgin IslanderUgandanUkrainianUruguayanUteVenezuelanVietnameseWelshWest IndianYakamaYaquiYugoslavianYumanYup'ikZimbabwean
Immigrant Origin (Total)
AfghanistanAfricaAlbaniaArgentinaArmeniaAsiaAustraliaAustriaAzoresBahamasBangladeshBarbadosBelarusBelgiumBelizeBoliviaBosnia and HerzegovinaBrazilBulgariaBurma / MyanmarCabo VerdeCambodiaCameroonCanadaCaribbeanCentral AmericaChileChinaColombiaCongoCosta RicaCroatiaCubaCzechoslovakiaDenmarkDominicaDominican RepublicEastern AfricaEastern AsiaEastern EuropeEcuadorEgyptEl SalvadorEnglandEritreaEthiopiaEuropeFijiFranceGermanyGhanaGreeceGrenadaGuatemalaGuyanaHaitiHondurasHong KongHungaryIndiaIndonesiaIranIraqIrelandIsraelItalyJamaicaJapanJordanKazakhstanKenyaKoreaKuwaitLaosLatin AmericaLatviaLebanonLiberiaLithuaniaMalaysiaMexicoMicronesiaMiddle AfricaMoldovaMoroccoNepalNetherlandsNicaraguaNigeriaNorth MacedoniaNorthern AfricaNorthern EuropeNorwayOceaniaPakistanPanamaPeruPhilippinesPolandPortugalRomaniaRussiaSaudi ArabiaScotlandSenegalSerbiaSierra LeoneSingaporeSomaliaSouth AfricaSouth AmericaSouth Central AsiaSouth Eastern AsiaSouthern EuropeSpainSri LankaSt. Vincent and the GrenadinesSudanSwedenSwitzerlandSyriaTaiwanThailandTrinidad and TobagoTurkeyUgandaUkraineUruguayUzbekistanVenezuelaVietnamWest IndiesWestern AfricaWestern AsiaWestern EuropeYemenZaireZimbabwe
Immigrant Origin (Percentage)
AfghanistanAfricaAlbaniaArgentinaArmeniaAsiaAustraliaAustriaAzoresBahamasBangladeshBarbadosBelarusBelgiumBelizeBoliviaBosnia and HerzegovinaBrazilBulgariaBurma / MyanmarCabo VerdeCambodiaCameroonCanadaCaribbeanCentral AmericaChileChinaColombiaCongoCosta RicaCroatiaCubaCzechoslovakiaDenmarkDominicaDominican RepublicEastern AfricaEastern AsiaEastern EuropeEcuadorEgyptEl SalvadorEnglandEritreaEthiopiaEuropeFijiFranceGermanyGhanaGreeceGrenadaGuatemalaGuyanaHaitiHondurasHong KongHungaryIndiaIndonesiaIranIraqIrelandIsraelItalyJamaicaJapanJordanKazakhstanKenyaKoreaKuwaitLaosLatin AmericaLatviaLebanonLiberiaLithuaniaMalaysiaMexicoMicronesiaMiddle AfricaMoldovaMoroccoNepalNetherlandsNicaraguaNigeriaNorth MacedoniaNorthern AfricaNorthern EuropeNorwayOceaniaPakistanPanamaPeruPhilippinesPolandPortugalRomaniaRussiaSaudi ArabiaScotlandSenegalSerbiaSierra LeoneSingaporeSomaliaSouth AfricaSouth AmericaSouth Central AsiaSouth Eastern AsiaSouthern EuropeSpainSri LankaSt. Vincent and the GrenadinesSudanSwedenSwitzerlandSyriaTaiwanThailandTrinidad and TobagoTurkeyUgandaUkraineUruguayUzbekistanVenezuelaVietnamWest IndiesWestern AfricaWestern AsiaWestern EuropeYemenZaireZimbabwe
Income
Income (Families)
Income (Households)
Poverty
Poverty (Families)
Unemployment
Employment Occupations
Employment Industries
Employer Class
Commute Time
Commute Means
School Enrollment
Education by Degree Field
Occupancy
Finances
Physical Characteristics
North Carolina
Compare Zip Codes
Comparison Subject

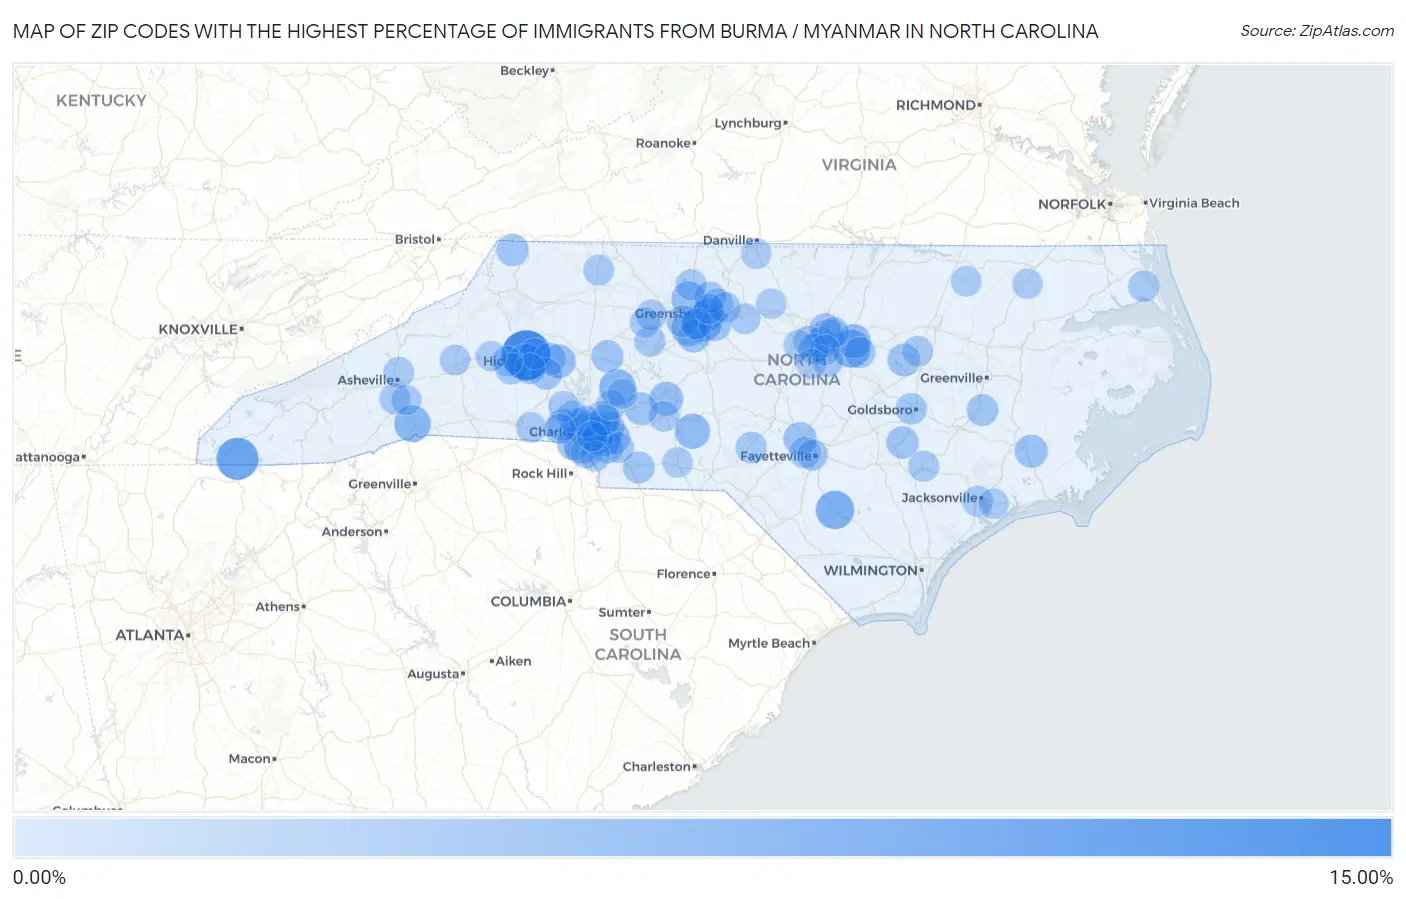
Map of Zip Codes with the Highest Percentage of Immigrants from Burma / Myanmar in North Carolina

0.00%
2.00%
Zip Codes with the Highest Percentage of Immigrants from Burma / Myanmar in North Carolina Map

Zip Codes with the Highest Percentage of Immigrants from Burma / Myanmar in North Carolina

Zip Code Burma / Myanmar vs State vs National
1.282121.81%0.043%(+1.77)#70.047%(+1.76)#821
2.285601.46%0.043%(+1.42)#220.047%(+1.41)#1,953
3.282271.15%0.043%(+1.11)#230.047%(+1.10)#1,957
4.272600.77%0.043%(+0.725)#240.047%(+0.720)#1,958
5.289040.75%0.043%(+0.708)#1260.047%(+0.703)#5,778
6.275450.62%0.043%(+0.578)#1270.047%(+0.574)#5,779
7.275170.61%0.043%(+0.569)#1280.047%(+0.565)#5,780
8.271040.36%0.043%(+0.320)#1290.047%(+0.316)#5,781
9.272580.36%0.043%(+0.312)#1890.047%(+0.308)#7,716
10.281040.31%0.043%(+0.271)#1900.047%(+0.267)#7,717
11.278960.27%0.043%(+0.224)#1910.047%(+0.220)#7,718
12.282150.25%0.043%(+0.212)#1920.047%(+0.208)#7,719
13.282160.24%0.043%(+0.198)#1930.047%(+0.194)#7,720
14.279100.24%0.043%(+0.194)#1940.047%(+0.190)#7,721
15.272840.22%0.043%(+0.179)#1950.047%(+0.175)#7,722
16.277040.20%0.043%(+0.155)#1960.047%(+0.150)#7,723
17.272620.19%0.043%(+0.148)#1970.047%(+0.144)#7,724
18.273170.19%0.043%(+0.145)#2820.047%(+0.141)#10,528
19.282700.19%0.043%(+0.144)#2830.047%(+0.140)#10,529
20.277070.18%0.043%(+0.136)#2840.047%(+0.132)#10,530
21.282140.17%0.043%(+0.127)#2850.047%(+0.123)#10,531
22.282620.14%0.043%(+0.101)#2860.047%(+0.096)#10,532
23.276150.14%0.043%(+0.093)#2870.047%(+0.089)#10,533
24.284620.11%0.043%(+0.066)#3610.047%(+0.062)#13,356
25.275160.10%0.043%(+0.060)#3620.047%(+0.055)#13,357
26.273020.10%0.043%(+0.059)#3630.047%(+0.054)#13,358
27.281050.096%0.043%(+0.053)#3640.047%(+0.048)#13,359
28.276040.096%0.043%(+0.052)#3650.047%(+0.048)#13,360
29.275100.092%0.043%(+0.049)#3660.047%(+0.045)#13,361
30.285570.091%0.043%(+0.048)#3670.047%(+0.044)#13,362
31.284050.087%0.043%(+0.044)#3680.047%(+0.040)#13,363
32.285620.081%0.043%(+0.038)#3690.047%(+0.034)#13,364
33.286450.080%0.043%(+0.037)#3700.047%(+0.032)#13,365
34.278580.075%0.043%(+0.032)#3710.047%(+0.028)#13,366
35.274060.071%0.043%(+0.028)#3720.047%(+0.024)#13,367
36.272530.070%0.043%(+0.027)#3730.047%(+0.023)#13,368
37.272780.068%0.043%(+0.025)#3740.047%(+0.020)#13,369
38.281100.066%0.043%(+0.023)#3750.047%(+0.019)#13,370
39.280560.062%0.043%(+0.019)#3760.047%(+0.015)#13,371
40.276100.058%0.043%(+0.015)#3770.047%(+0.010)#13,372
41.282050.053%0.043%(+0.010)#3780.047%(+0.005)#13,373
42.283110.046%0.043%(+0.003)#3790.047%(-0.001)#13,374
43.276070.046%0.043%(+0.003)#3800.047%(-0.001)#13,375
44.272650.043%0.043%(+0.000)#3810.047%(-0.004)#13,376
45.287540.042%0.043%(-0.001)#3820.047%(-0.006)#13,442
46.282110.037%0.043%(-0.006)#3830.047%(-0.010)#13,443
47.282260.034%0.043%(-0.009)#3840.047%(-0.014)#13,444
48.275300.029%0.043%(-0.014)#3850.047%(-0.018)#13,445
49.272150.028%0.043%(-0.015)#3860.047%(-0.019)#13,446
50.274050.023%0.043%(-0.020)#3870.047%(-0.024)#13,447
51.276060.018%0.043%(-0.026)#3880.047%(-0.030)#13,448
52.277030.017%0.043%(-0.027)#3890.047%(-0.031)#13,449
53.276130.016%0.043%(-0.027)#3900.047%(-0.032)#13,450
54.280120.012%0.043%(-0.032)#3910.047%(-0.036)#13,451
55.289060.010%0.043%(-0.033)#3920.047%(-0.037)#13,452
56.280790.0099%0.043%(-0.033)#3930.047%(-0.038)#13,453
57.281640.0064%0.043%(-0.037)#3940.047%(-0.041)#13,454
58.280340.0052%0.043%(-0.038)#3950.047%(-0.042)#13,455
59.275390.0037%0.043%(-0.039)#3960.047%(-0.044)#13,456
60.280810.0036%0.043%(-0.039)#4080.047%(-0.044)#15,080
61.270120.0035%0.043%(-0.040)#4090.047%(-0.044)#15,081
62.287150.0035%0.043%(-0.040)#4100.047%(-0.044)#15,082

Common Questions

What are the Top 10 Zip Codes with the Highest Percentage of Immigrants from Burma / Myanmar in North Carolina?
Top 10 Zip Codes with the Highest Percentage of Immigrants from Burma / Myanmar in North Carolina are:
#1
1.81%
#2
1.46%
#3
1.15%
#4
0.77%
#5
0.75%
#6
0.62%
#7
0.61%
#8
0.36%
#9
0.36%
#10
0.31%
What zip code has the Highest Percentage of Immigrants from Burma / Myanmar in North Carolina?
28212 has the Highest Percentage of Immigrants from Burma / Myanmar in North Carolina with 1.81%.
What is the Percentage of Immigrants from Burma / Myanmar in the State of North Carolina?
Percentage of Immigrants from Burma / Myanmar in North Carolina is 0.043%.
What is the Percentage of Immigrants from Burma / Myanmar in the United States?
Percentage of Immigrants from Burma / Myanmar in the United States is 0.047%.