Pavillion, WY Map & Demographics
Pavillion Map
Pavillion Overview
$19,637
PER CAPITA INCOME
$55,000
AVG FAMILY INCOME
$50,000
AVG HOUSEHOLD INCOME
30.8%
WAGE / INCOME GAP [ % ]
69.2¢/ $1
WAGE / INCOME GAP [ $ ]
0.34
INEQUALITY / GINI INDEX
290
TOTAL POPULATION
133
MALE POPULATION
157
FEMALE POPULATION
84.71
MALES / 100 FEMALES
118.05
FEMALES / 100 MALES
45.0
MEDIAN AGE
3.6
AVG FAMILY SIZE
3.0
AVG HOUSEHOLD SIZE
116
LABOR FORCE [ PEOPLE ]
48.7%
PERCENT IN LABOR FORCE
4.3%
UNEMPLOYMENT RATE
Pavillion Zip Codes
Pavillion Area Codes
Income in Pavillion
Income Overview in Pavillion
Per Capita Income in Pavillion is $19,637, while median incomes of families and households are $55,000 and $50,000 respectively.
| Characteristic | Number | Measure |
| Per Capita Income | 290 | $19,637 |
| Median Family Income | 68 | $55,000 |
| Mean Family Income | 68 | $57,979 |
| Median Household Income | 96 | $50,000 |
| Mean Household Income | 96 | $55,929 |
| Income Deficit | 68 | $0 |
| Wage / Income Gap (%) | 290 | 30.77% |
| Wage / Income Gap ($) | 290 | 69.23¢ per $1 |
| Gini / Inequality Index | 290 | 0.34 |
Earnings by Sex in Pavillion
Average Earnings in Pavillion are $19,583, $23,214 for men and $16,071 for women, a difference of 30.8%.
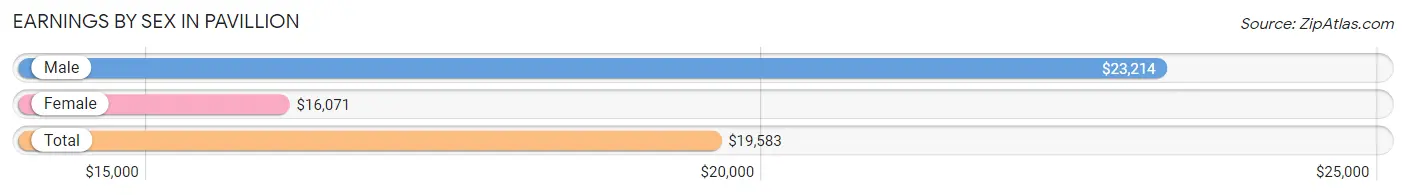
| Sex | Number | Average Earnings |
| Male | 60 (46.9%) | $23,214 |
| Female | 68 (53.1%) | $16,071 |
| Total | 128 (100.0%) | $19,583 |
Earnings by Sex by Income Bracket in Pavillion
The most common earnings brackets in Pavillion are $2,499 or less for men (7 | 11.7%) and $2,499 or less for women (14 | 20.6%).
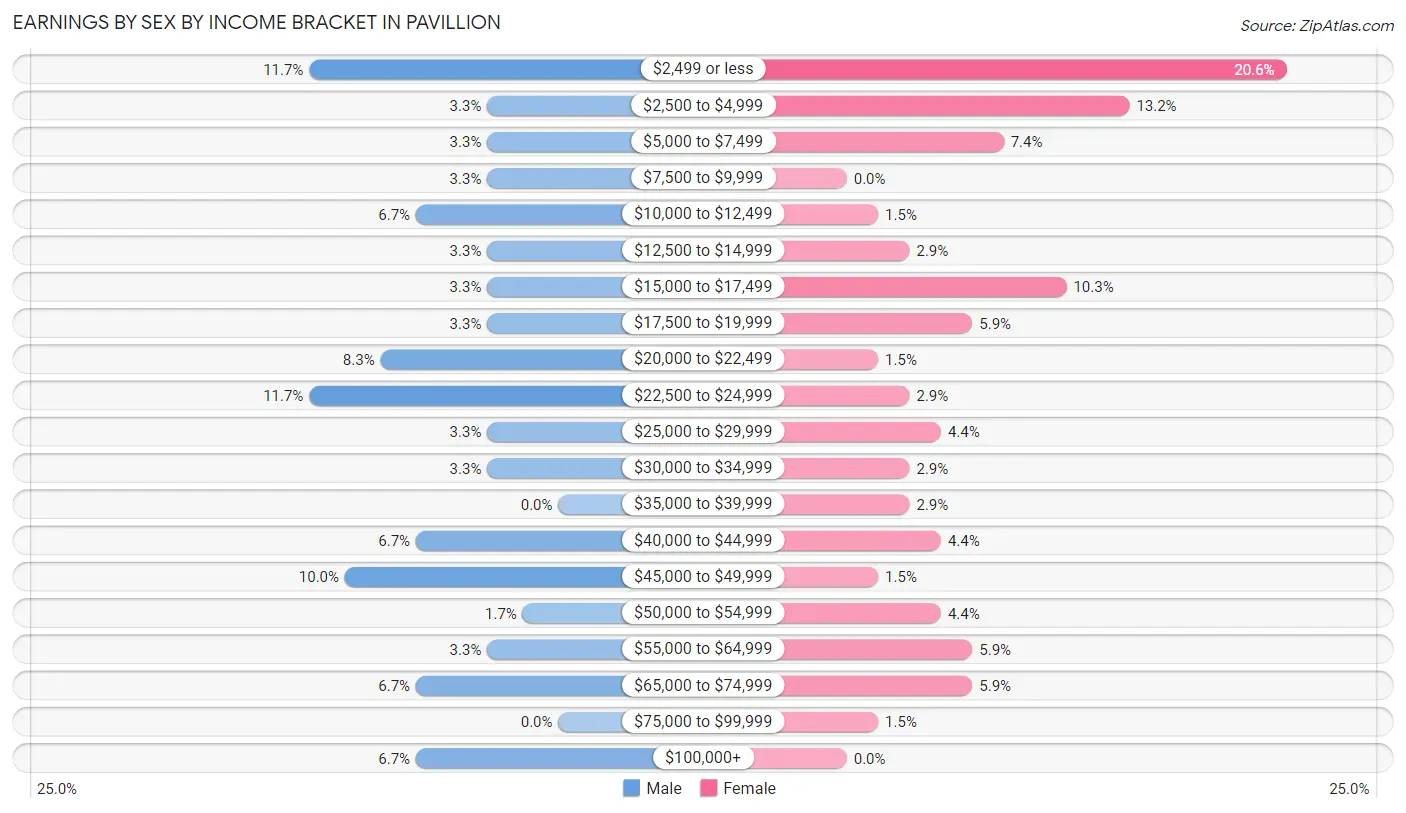
| Income | Male | Female |
| $2,499 or less | 7 (11.7%) | 14 (20.6%) |
| $2,500 to $4,999 | 2 (3.3%) | 9 (13.2%) |
| $5,000 to $7,499 | 2 (3.3%) | 5 (7.3%) |
| $7,500 to $9,999 | 2 (3.3%) | 0 (0.0%) |
| $10,000 to $12,499 | 4 (6.7%) | 1 (1.5%) |
| $12,500 to $14,999 | 2 (3.3%) | 2 (2.9%) |
| $15,000 to $17,499 | 2 (3.3%) | 7 (10.3%) |
| $17,500 to $19,999 | 2 (3.3%) | 4 (5.9%) |
| $20,000 to $22,499 | 5 (8.3%) | 1 (1.5%) |
| $22,500 to $24,999 | 7 (11.7%) | 2 (2.9%) |
| $25,000 to $29,999 | 2 (3.3%) | 3 (4.4%) |
| $30,000 to $34,999 | 2 (3.3%) | 2 (2.9%) |
| $35,000 to $39,999 | 0 (0.0%) | 2 (2.9%) |
| $40,000 to $44,999 | 4 (6.7%) | 3 (4.4%) |
| $45,000 to $49,999 | 6 (10.0%) | 1 (1.5%) |
| $50,000 to $54,999 | 1 (1.7%) | 3 (4.4%) |
| $55,000 to $64,999 | 2 (3.3%) | 4 (5.9%) |
| $65,000 to $74,999 | 4 (6.7%) | 4 (5.9%) |
| $75,000 to $99,999 | 0 (0.0%) | 1 (1.5%) |
| $100,000+ | 4 (6.7%) | 0 (0.0%) |
| Total | 60 (100.0%) | 68 (100.0%) |
Earnings by Sex by Educational Attainment in Pavillion
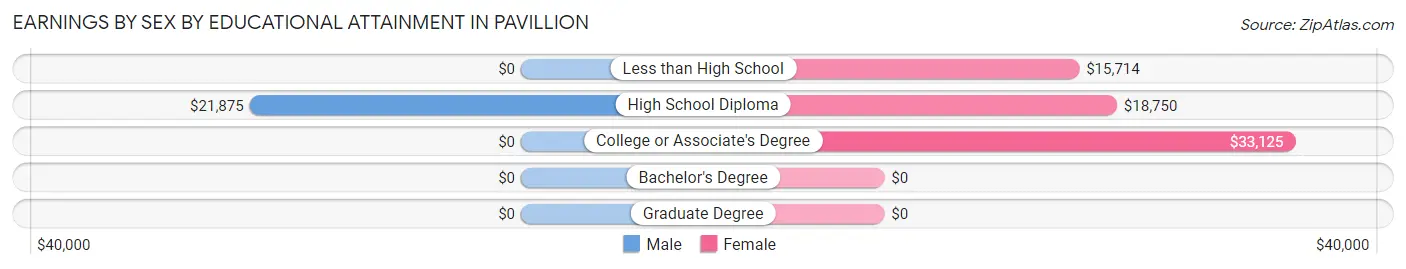
| Educational Attainment | Male Income | Female Income |
| Less than High School | - | - |
| High School Diploma | $21,875 | $18,750 |
| College or Associate's Degree | - | - |
| Bachelor's Degree | - | - |
| Graduate Degree | - | - |
| Total | - | - |
Family Income in Pavillion
Family Income Brackets in Pavillion
According to the Pavillion family income data, there are 17 families falling into the $75,000 to $99,999 income range, which is the most common income bracket and makes up 25.0% of all families.
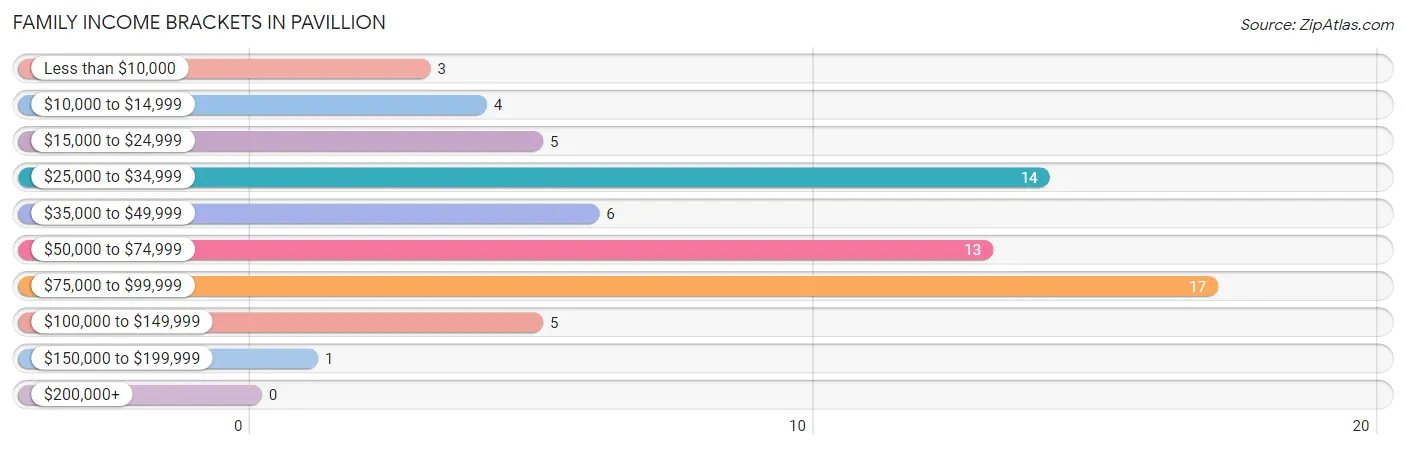
| Income Bracket | # Families | % Families |
| Less than $10,000 | 3 | 4.4% |
| $10,000 to $14,999 | 4 | 5.9% |
| $15,000 to $24,999 | 5 | 7.4% |
| $25,000 to $34,999 | 14 | 20.6% |
| $35,000 to $49,999 | 6 | 8.8% |
| $50,000 to $74,999 | 13 | 19.1% |
| $75,000 to $99,999 | 17 | 25.0% |
| $100,000 to $149,999 | 5 | 7.4% |
| $150,000 to $199,999 | 1 | 1.5% |
| $200,000+ | 0 | 0.0% |
Family Income by Famaliy Size in Pavillion
2-person families (33 | 48.5%) account for the highest median family income in Pavillion with $67,813 per family, while 2-person families (33 | 48.5%) have the highest median income of $33,906 per family member.
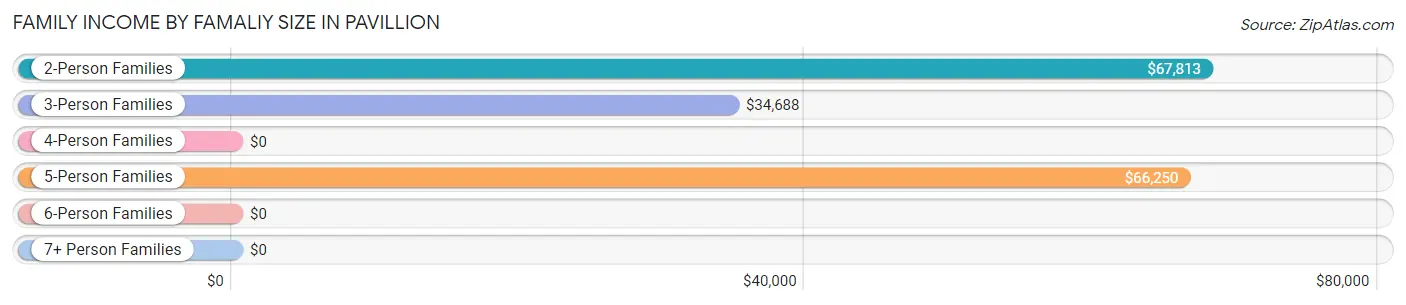
| Income Bracket | # Families | Median Income |
| 2-Person Families | 33 (48.5%) | $67,813 |
| 3-Person Families | 15 (22.1%) | $34,688 |
| 4-Person Families | 8 (11.8%) | $0 |
| 5-Person Families | 11 (16.2%) | $66,250 |
| 6-Person Families | 0 (0.0%) | $0 |
| 7+ Person Families | 1 (1.5%) | $0 |
| Total | 68 (100.0%) | $55,000 |
Family Income by Number of Earners in Pavillion
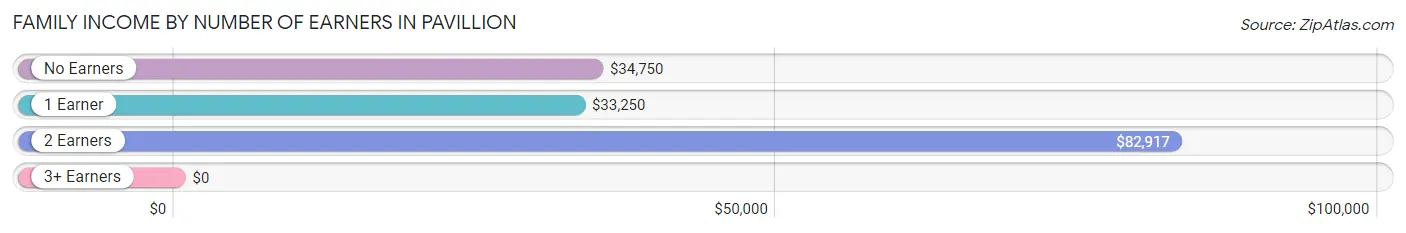
| Number of Earners | # Families | Median Income |
| No Earners | 13 (19.1%) | $34,750 |
| 1 Earner | 23 (33.8%) | $33,250 |
| 2 Earners | 27 (39.7%) | $82,917 |
| 3+ Earners | 5 (7.3%) | $0 |
| Total | 68 (100.0%) | $55,000 |
Household Income in Pavillion
Household Income Brackets in Pavillion
With 22 households falling in the category, the $50,000 to $74,999 income range is the most frequent in Pavillion, accounting for 22.9% of all households.
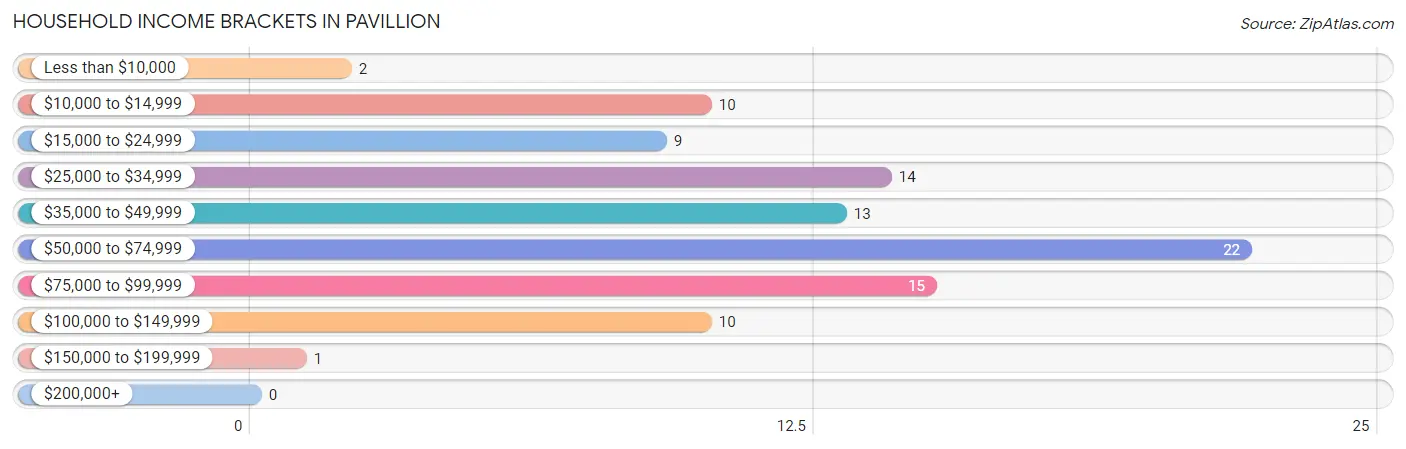
| Income Bracket | # Households | % Households |
| Less than $10,000 | 2 | 2.1% |
| $10,000 to $14,999 | 10 | 10.4% |
| $15,000 to $24,999 | 9 | 9.4% |
| $25,000 to $34,999 | 14 | 14.6% |
| $35,000 to $49,999 | 13 | 13.5% |
| $50,000 to $74,999 | 22 | 22.9% |
| $75,000 to $99,999 | 15 | 15.6% |
| $100,000 to $149,999 | 10 | 10.4% |
| $150,000 to $199,999 | 1 | 1.0% |
| $200,000+ | 0 | 0.0% |
Household Income by Householder Age in Pavillion
The median household income in Pavillion is $50,000, with the highest median household income of $60,000 found in the 45 to 64 years age bracket for the primary householder. A total of 32 households (33.3%) fall into this category.
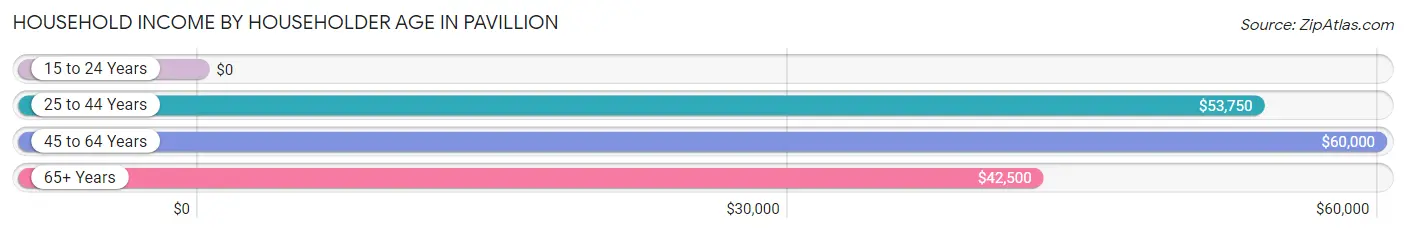
| Income Bracket | # Households | Median Income |
| 15 to 24 Years | 0 (0.0%) | $0 |
| 25 to 44 Years | 28 (29.2%) | $53,750 |
| 45 to 64 Years | 32 (33.3%) | $60,000 |
| 65+ Years | 36 (37.5%) | $42,500 |
| Total | 96 (100.0%) | $50,000 |
Poverty in Pavillion
Income Below Poverty by Sex and Age in Pavillion
With 21.0% poverty level for males and 16.6% for females among the residents of Pavillion, 15 year old males and 12 to 14 year old females are the most vulnerable to poverty, with 6 males (75.0%) and 4 females (50.0%) in their respective age groups living below the poverty level.
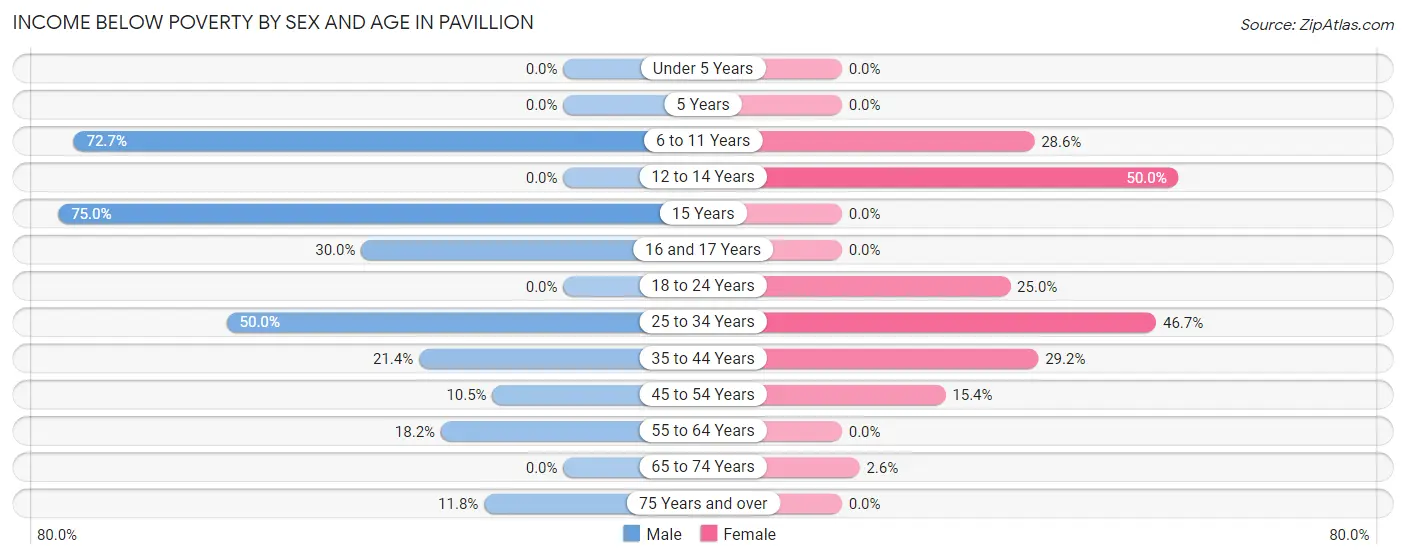
| Age Bracket | Male | Female |
| Under 5 Years | 0 (0.0%) | 0 (0.0%) |
| 5 Years | 0 (0.0%) | 0 (0.0%) |
| 6 to 11 Years | 8 (72.7%) | 4 (28.6%) |
| 12 to 14 Years | 0 (0.0%) | 4 (50.0%) |
| 15 Years | 6 (75.0%) | 0 (0.0%) |
| 16 and 17 Years | 3 (30.0%) | 0 (0.0%) |
| 18 to 24 Years | 0 (0.0%) | 1 (25.0%) |
| 25 to 34 Years | 2 (50.0%) | 7 (46.7%) |
| 35 to 44 Years | 3 (21.4%) | 7 (29.2%) |
| 45 to 54 Years | 2 (10.5%) | 2 (15.4%) |
| 55 to 64 Years | 2 (18.2%) | 0 (0.0%) |
| 65 to 74 Years | 0 (0.0%) | 1 (2.6%) |
| 75 Years and over | 2 (11.8%) | 0 (0.0%) |
| Total | 28 (21.0%) | 26 (16.6%) |
Income Above Poverty by Sex and Age in Pavillion
According to the poverty statistics in Pavillion, males aged under 5 years and females aged under 5 years are the age groups that are most secure financially, with 100.0% of males and 100.0% of females in these age groups living above the poverty line.
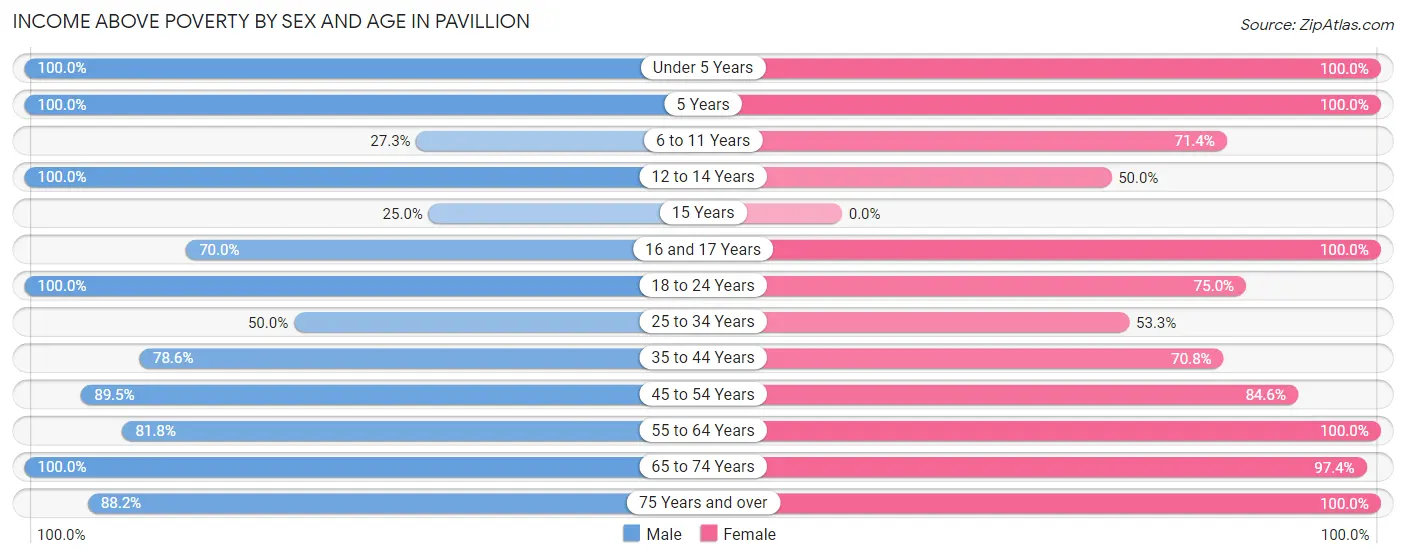
| Age Bracket | Male | Female |
| Under 5 Years | 1 (100.0%) | 3 (100.0%) |
| 5 Years | 1 (100.0%) | 1 (100.0%) |
| 6 to 11 Years | 3 (27.3%) | 10 (71.4%) |
| 12 to 14 Years | 5 (100.0%) | 4 (50.0%) |
| 15 Years | 2 (25.0%) | 0 (0.0%) |
| 16 and 17 Years | 7 (70.0%) | 10 (100.0%) |
| 18 to 24 Years | 12 (100.0%) | 3 (75.0%) |
| 25 to 34 Years | 2 (50.0%) | 8 (53.3%) |
| 35 to 44 Years | 11 (78.6%) | 17 (70.8%) |
| 45 to 54 Years | 17 (89.5%) | 11 (84.6%) |
| 55 to 64 Years | 9 (81.8%) | 23 (100.0%) |
| 65 to 74 Years | 20 (100.0%) | 37 (97.4%) |
| 75 Years and over | 15 (88.2%) | 4 (100.0%) |
| Total | 105 (78.9%) | 131 (83.4%) |
Income Below Poverty Among Married-Couple Families in Pavillion
The poverty statistics for married-couple families in Pavillion show that 7.8% or 4 of the total 51 families live below the poverty line. Families with 3 or 4 children have the highest poverty rate of 57.1%, comprising of 4 families. On the other hand, families with no children have the lowest poverty rate of 0.0%, which includes 0 families.
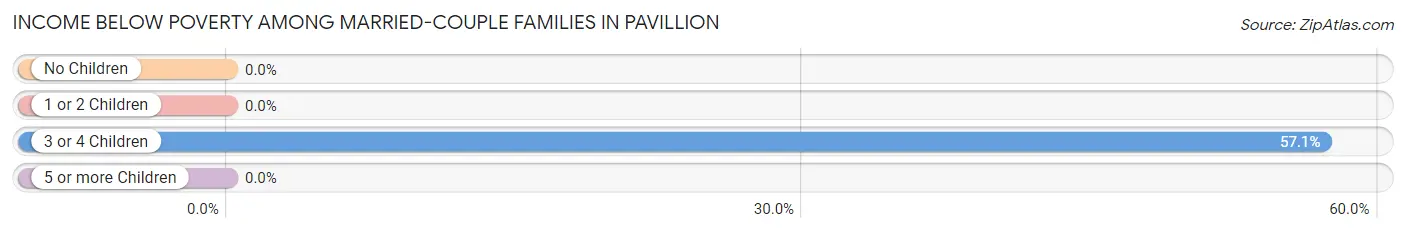
| Children | Above Poverty | Below Poverty |
| No Children | 32 (100.0%) | 0 (0.0%) |
| 1 or 2 Children | 12 (100.0%) | 0 (0.0%) |
| 3 or 4 Children | 3 (42.9%) | 4 (57.1%) |
| 5 or more Children | 0 (0.0%) | 0 (0.0%) |
| Total | 47 (92.2%) | 4 (7.8%) |
Income Below Poverty Among Single-Parent Households in Pavillion
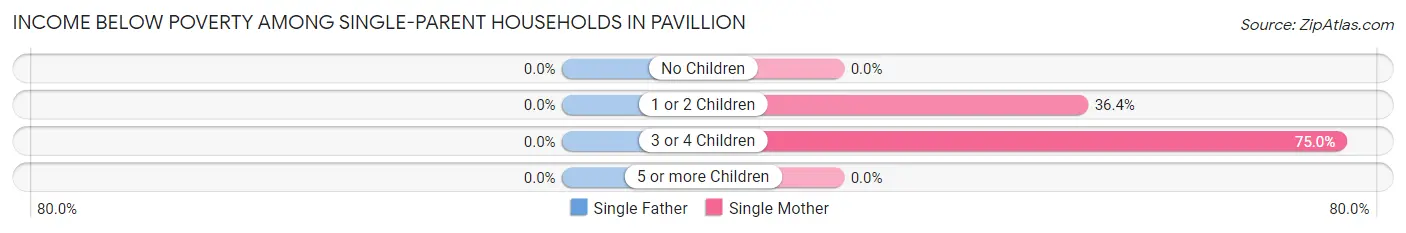
| Children | Single Father | Single Mother |
| No Children | 0 (0.0%) | 0 (0.0%) |
| 1 or 2 Children | 0 (0.0%) | 4 (36.4%) |
| 3 or 4 Children | 0 (0.0%) | 3 (75.0%) |
| 5 or more Children | 0 (0.0%) | 0 (0.0%) |
| Total | 0 (0.0%) | 7 (41.2%) |
Income Below Poverty Among Married-Couple vs Single-Parent Households in Pavillion
The poverty data for Pavillion shows that 4 of the married-couple family households (7.8%) and 7 of the single-parent households (41.2%) are living below the poverty level. Within the married-couple family households, those with 3 or 4 children have the highest poverty rate, with 4 households (57.1%) falling below the poverty line. Among the single-parent households, those with 3 or 4 children have the highest poverty rate, with 3 household (75.0%) living below poverty.
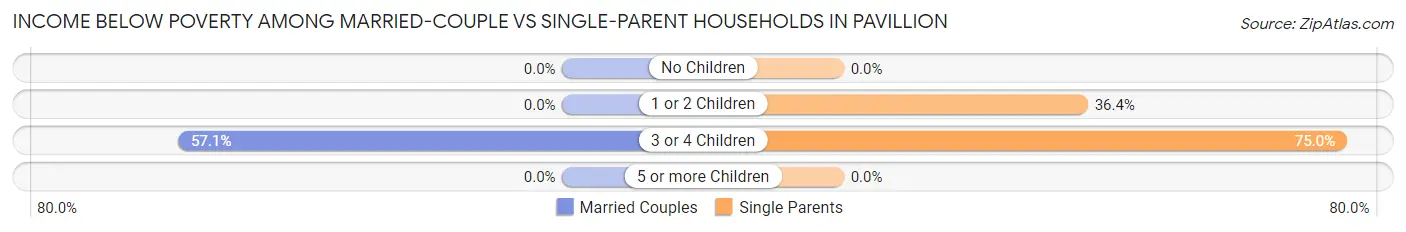
| Children | Married-Couple Families | Single-Parent Households |
| No Children | 0 (0.0%) | 0 (0.0%) |
| 1 or 2 Children | 0 (0.0%) | 4 (36.4%) |
| 3 or 4 Children | 4 (57.1%) | 3 (75.0%) |
| 5 or more Children | 0 (0.0%) | 0 (0.0%) |
| Total | 4 (7.8%) | 7 (41.2%) |
Race in Pavillion
The most populous races in Pavillion are White / Caucasian (198 | 68.3%), Two or more Races (51 | 17.6%), and Hispanic or Latino (47 | 16.2%).
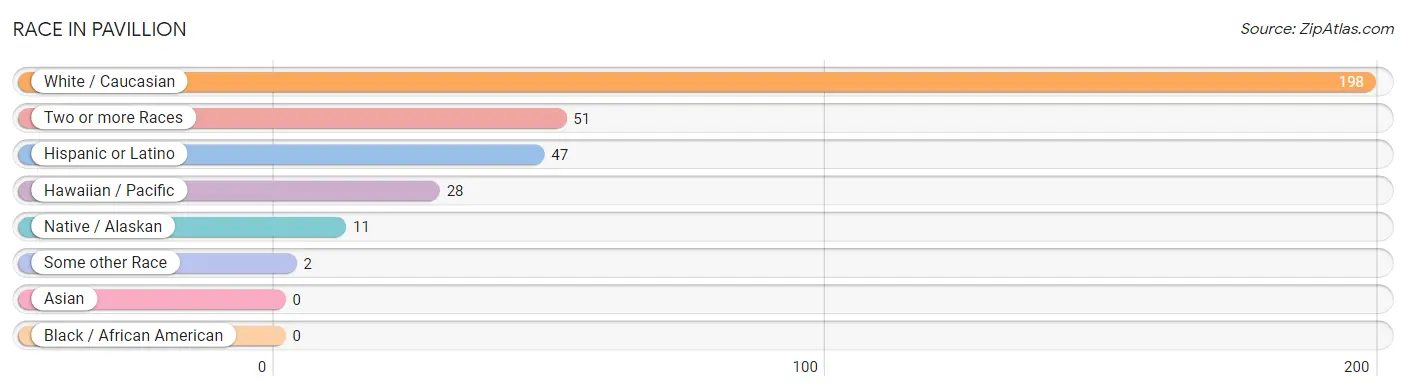
| Race | # Population | % Population |
| Asian | 0 | 0.0% |
| Black / African American | 0 | 0.0% |
| Hawaiian / Pacific | 28 | 9.7% |
| Hispanic or Latino | 47 | 16.2% |
| Native / Alaskan | 11 | 3.8% |
| White / Caucasian | 198 | 68.3% |
| Two or more Races | 51 | 17.6% |
| Some other Race | 2 | 0.7% |
| Total | 290 | 100.0% |
Ancestry in Pavillion
The most populous ancestries reported in Pavillion are German (66 | 22.8%), English (38 | 13.1%), Mexican (33 | 11.4%), Irish (22 | 7.6%), and Norwegian (21 | 7.2%), together accounting for 62.1% of all Pavillion residents.
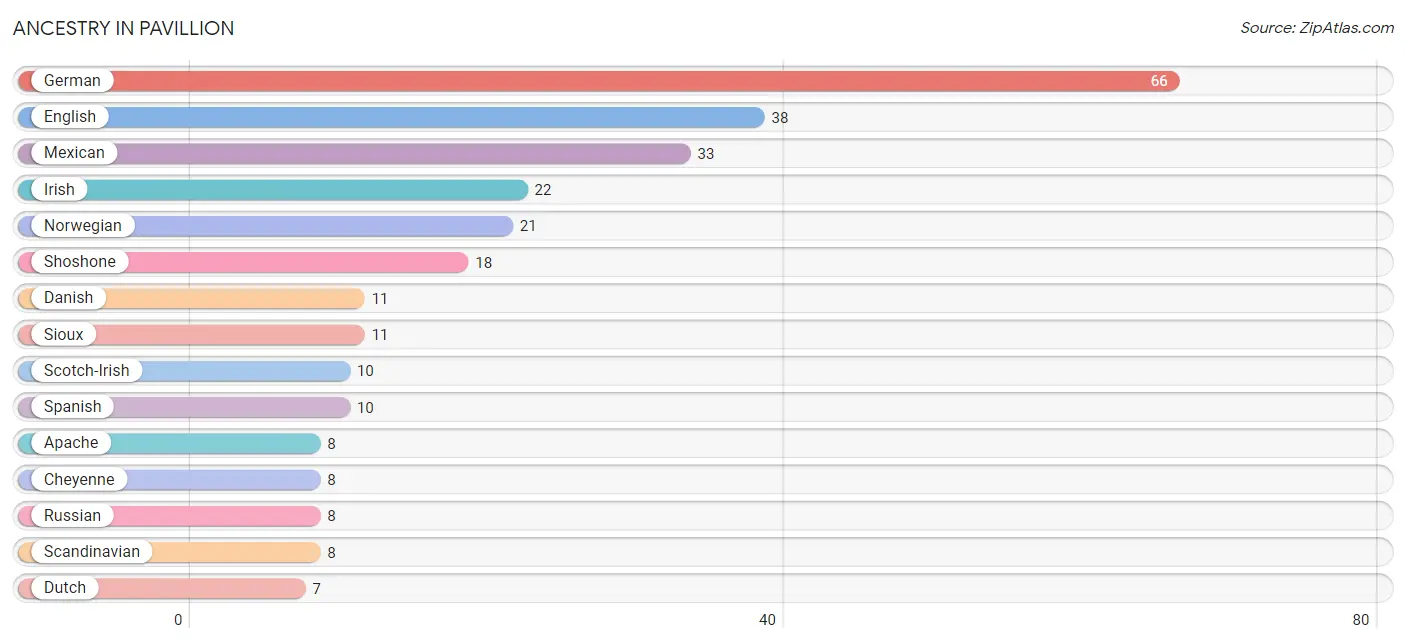
| Ancestry | # Population | % Population |
| American | 1 | 0.3% |
| Apache | 8 | 2.8% |
| Arapaho | 3 | 1.0% |
| Canadian | 2 | 0.7% |
| Cherokee | 1 | 0.3% |
| Cheyenne | 8 | 2.8% |
| Chippewa | 2 | 0.7% |
| Colville | 2 | 0.7% |
| Czech | 1 | 0.3% |
| Danish | 11 | 3.8% |
| Dutch | 7 | 2.4% |
| English | 38 | 13.1% |
| Estonian | 3 | 1.0% |
| European | 4 | 1.4% |
| French Canadian | 7 | 2.4% |
| German | 66 | 22.8% |
| Irish | 22 | 7.6% |
| Italian | 2 | 0.7% |
| Korean | 1 | 0.3% |
| Lithuanian | 1 | 0.3% |
| Mexican | 33 | 11.4% |
| Norwegian | 21 | 7.2% |
| Russian | 8 | 2.8% |
| Scandinavian | 8 | 2.8% |
| Scotch-Irish | 10 | 3.5% |
| Scottish | 7 | 2.4% |
| Shoshone | 18 | 6.2% |
| Sioux | 11 | 3.8% |
| Spanish | 10 | 3.5% |
| Swedish | 7 | 2.4% |
| Welsh | 1 | 0.3% | View All 31 Rows |
Immigrants in Pavillion
The most numerous immigrant groups reported in Pavillion came from Oceania (27 | 9.3%), and Canada (2 | 0.7%), together accounting for 10.0% of all Pavillion residents.
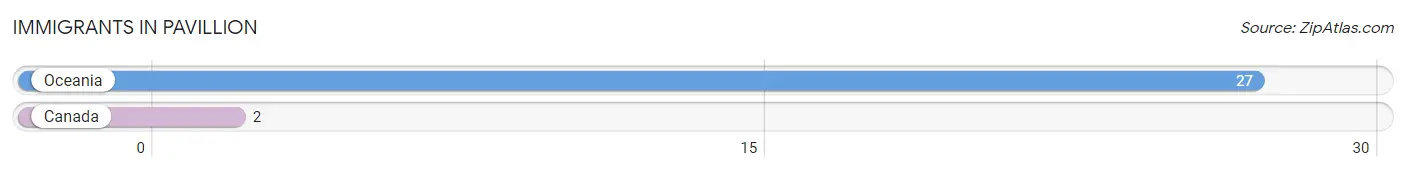
| Immigration Origin | # Population | % Population |
| Canada | 2 | 0.7% |
| Oceania | 27 | 9.3% | View All 2 Rows |
Sex and Age in Pavillion
Sex and Age in Pavillion
The most populous age groups in Pavillion are 15 to 19 Years (25 | 18.8%) for men and 70 to 74 Years (30 | 19.1%) for women.
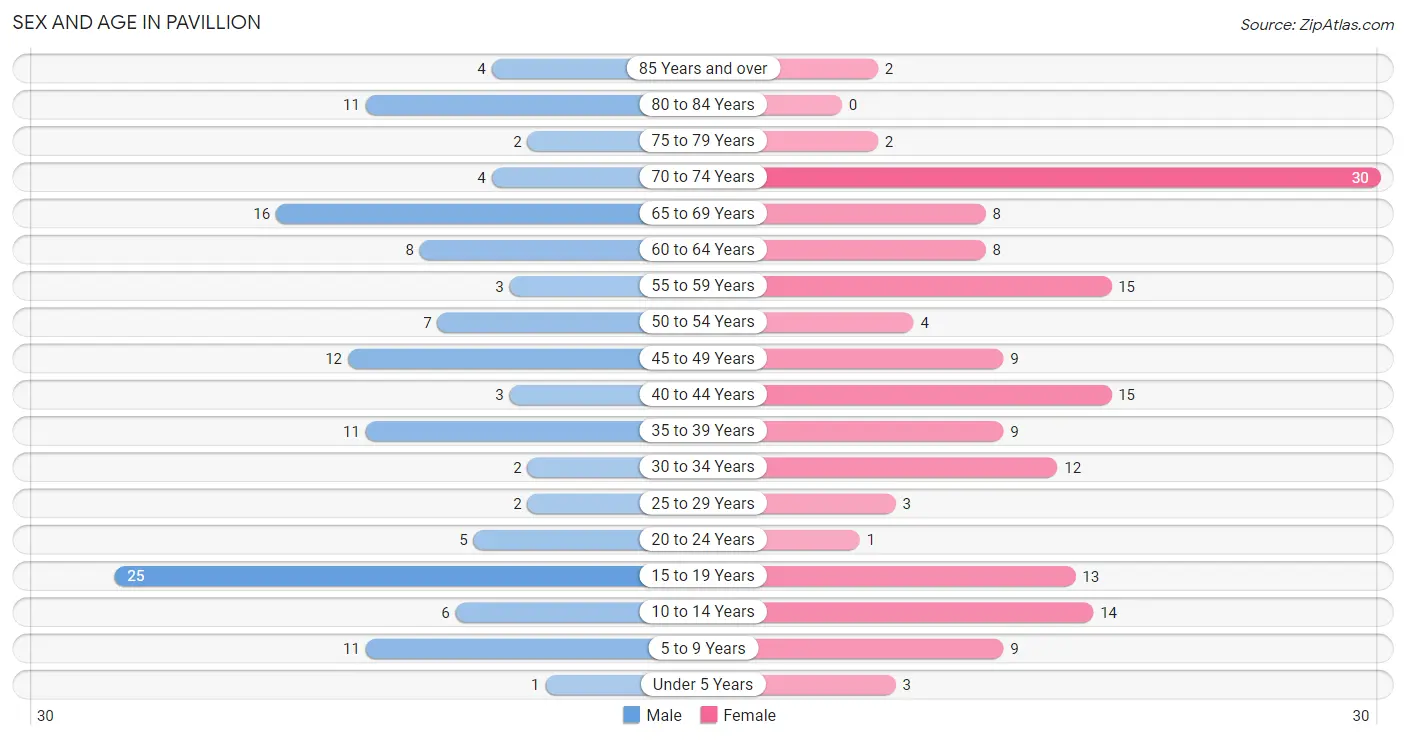
| Age Bracket | Male | Female |
| Under 5 Years | 1 (0.7%) | 3 (1.9%) |
| 5 to 9 Years | 11 (8.3%) | 9 (5.7%) |
| 10 to 14 Years | 6 (4.5%) | 14 (8.9%) |
| 15 to 19 Years | 25 (18.8%) | 13 (8.3%) |
| 20 to 24 Years | 5 (3.8%) | 1 (0.6%) |
| 25 to 29 Years | 2 (1.5%) | 3 (1.9%) |
| 30 to 34 Years | 2 (1.5%) | 12 (7.6%) |
| 35 to 39 Years | 11 (8.3%) | 9 (5.7%) |
| 40 to 44 Years | 3 (2.3%) | 15 (9.6%) |
| 45 to 49 Years | 12 (9.0%) | 9 (5.7%) |
| 50 to 54 Years | 7 (5.3%) | 4 (2.5%) |
| 55 to 59 Years | 3 (2.3%) | 15 (9.6%) |
| 60 to 64 Years | 8 (6.0%) | 8 (5.1%) |
| 65 to 69 Years | 16 (12.0%) | 8 (5.1%) |
| 70 to 74 Years | 4 (3.0%) | 30 (19.1%) |
| 75 to 79 Years | 2 (1.5%) | 2 (1.3%) |
| 80 to 84 Years | 11 (8.3%) | 0 (0.0%) |
| 85 Years and over | 4 (3.0%) | 2 (1.3%) |
| Total | 133 (100.0%) | 157 (100.0%) |
Families and Households in Pavillion
Median Family Size in Pavillion
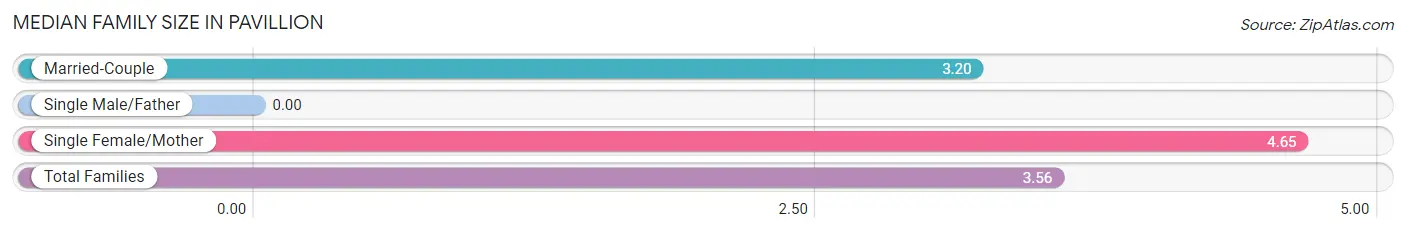
| Family Type | # Families | Family Size |
| Married-Couple | 51 (75.0%) | 3.20 |
| Single Male/Father | 0 (0.0%) | - |
| Single Female/Mother | 17 (25.0%) | 4.65 |
| Total Families | 68 (100.0%) | 3.56 |
Median Household Size in Pavillion
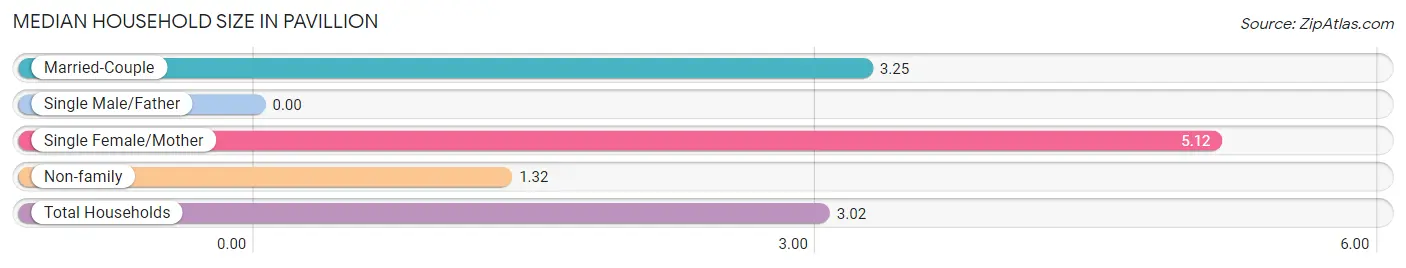
| Household Type | # Households | Household Size |
| Married-Couple | 51 (53.1%) | 3.25 |
| Single Male/Father | 0 (0.0%) | - |
| Single Female/Mother | 17 (17.7%) | 5.12 |
| Non-family | 28 (29.2%) | 1.32 |
| Total Households | 96 (100.0%) | 3.02 |
Household Size by Marriage Status in Pavillion
Out of a total of 96 households in Pavillion, 68 (70.8%) are family households, while 28 (29.2%) are nonfamily households. The most numerous type of family households are 2-person households, comprising 29, and the most common type of nonfamily households are 1-person households, comprising 22.
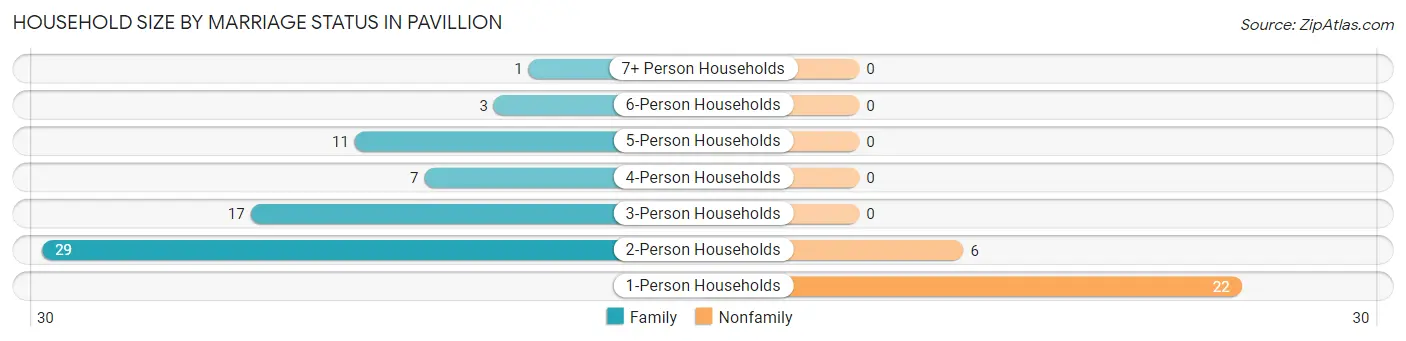
| Household Size | Family Households | Nonfamily Households |
| 1-Person Households | - | 22 (22.9%) |
| 2-Person Households | 29 (30.2%) | 6 (6.2%) |
| 3-Person Households | 17 (17.7%) | 0 (0.0%) |
| 4-Person Households | 7 (7.3%) | 0 (0.0%) |
| 5-Person Households | 11 (11.5%) | 0 (0.0%) |
| 6-Person Households | 3 (3.1%) | 0 (0.0%) |
| 7+ Person Households | 1 (1.0%) | 0 (0.0%) |
| Total | 68 (70.8%) | 28 (29.2%) |
Female Fertility in Pavillion
Fertility by Age in Pavillion
Average fertility rate in Pavillion is 48.0 births per 1,000 women. Women in the age bracket of 20 to 34 years have the highest fertility rate with 188.0 births per 1,000 women. Women in the age bracket of 20 to 34 years acount for 100.0% of all women with births.
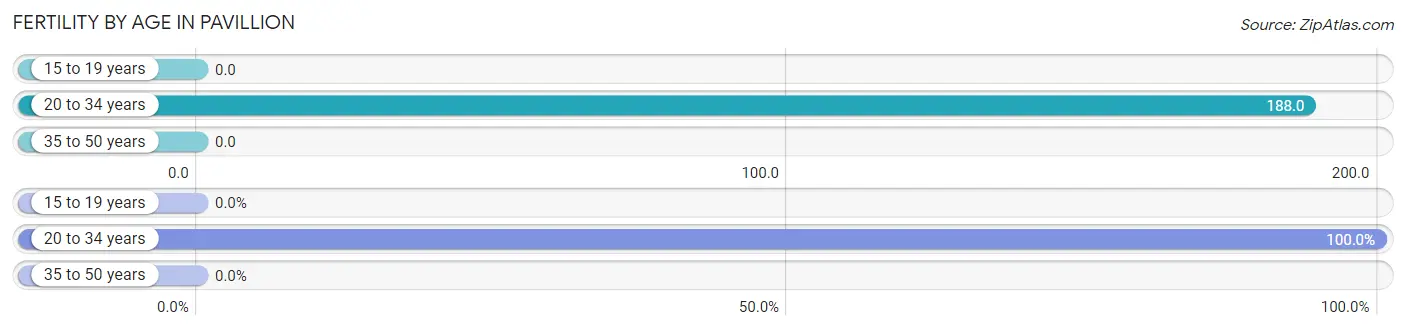
| Age Bracket | Women with Births | Births / 1,000 Women |
| 15 to 19 years | 0 (0.0%) | 0.0 |
| 20 to 34 years | 3 (100.0%) | 188.0 |
| 35 to 50 years | 0 (0.0%) | 0.0 |
| Total | 3 (100.0%) | 48.0 |
Fertility by Age by Marriage Status in Pavillion
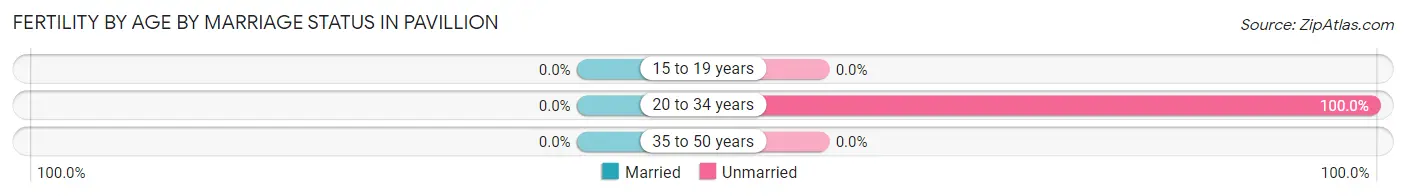
| Age Bracket | Married | Unmarried |
| 15 to 19 years | 0 (0.0%) | 0 (0.0%) |
| 20 to 34 years | 0 (0.0%) | 3 (100.0%) |
| 35 to 50 years | 0 (0.0%) | 0 (0.0%) |
| Total | 0 (0.0%) | 3 (100.0%) |
Fertility by Education in Pavillion
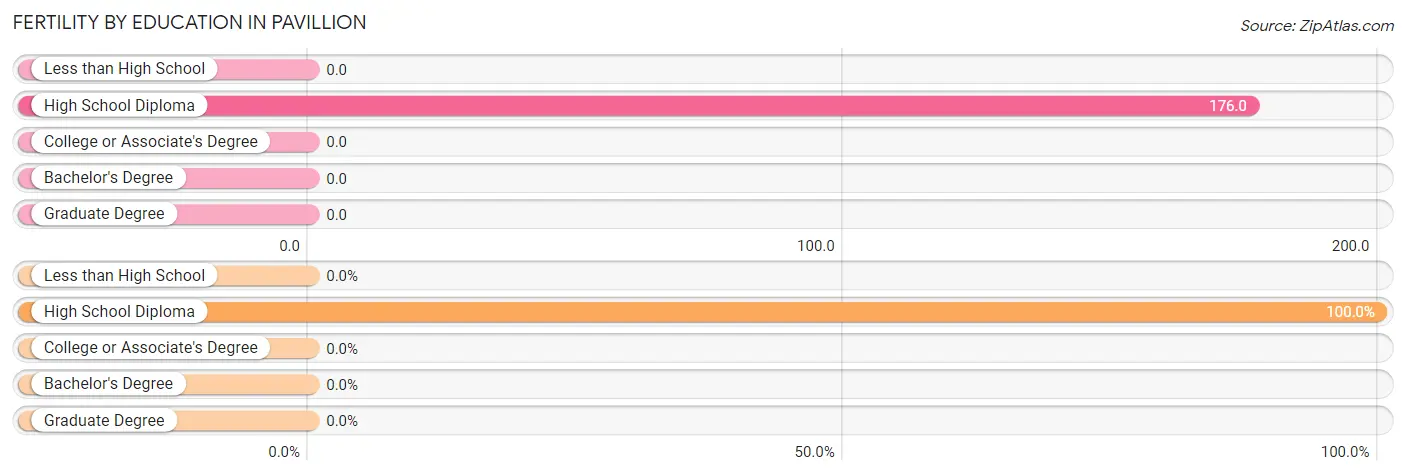
| Educational Attainment | Women with Births | Births / 1,000 Women |
| Less than High School | 0 (0.0%) | 0.0 |
| High School Diploma | 3 (100.0%) | 176.0 |
| College or Associate's Degree | 0 (0.0%) | 0.0 |
| Bachelor's Degree | 0 (0.0%) | 0.0 |
| Graduate Degree | 0 (0.0%) | 0.0 |
| Total | 3 (100.0%) | 48.0 |
Fertility by Education by Marriage Status in Pavillion
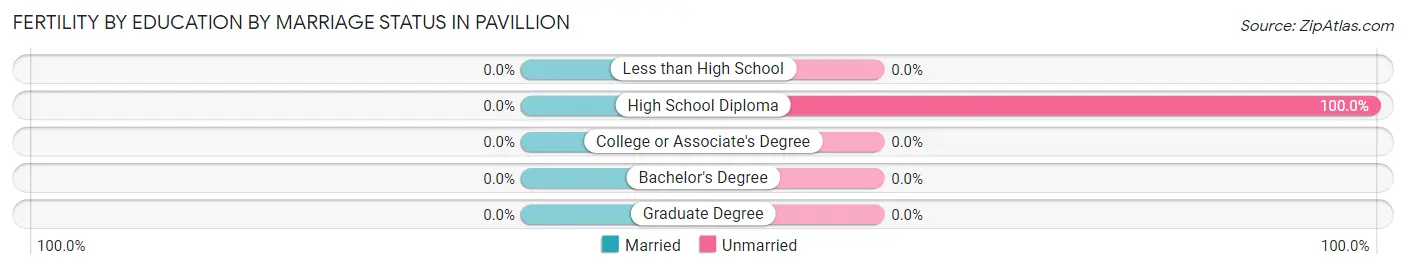
| Educational Attainment | Married | Unmarried |
| Less than High School | 0 (0.0%) | 0 (0.0%) |
| High School Diploma | 0 (0.0%) | 3 (100.0%) |
| College or Associate's Degree | 0 (0.0%) | 0 (0.0%) |
| Bachelor's Degree | 0 (0.0%) | 0 (0.0%) |
| Graduate Degree | 0 (0.0%) | 0 (0.0%) |
| Total | 0 (0.0%) | 3 (100.0%) |
Employment Characteristics in Pavillion
Employment by Class of Employer in Pavillion
Among the 97 employed individuals in Pavillion, private company employees (52 | 53.6%), not-for-profit organizations (17 | 17.5%), and local government employees (15 | 15.5%) make up the most common classes of employment.
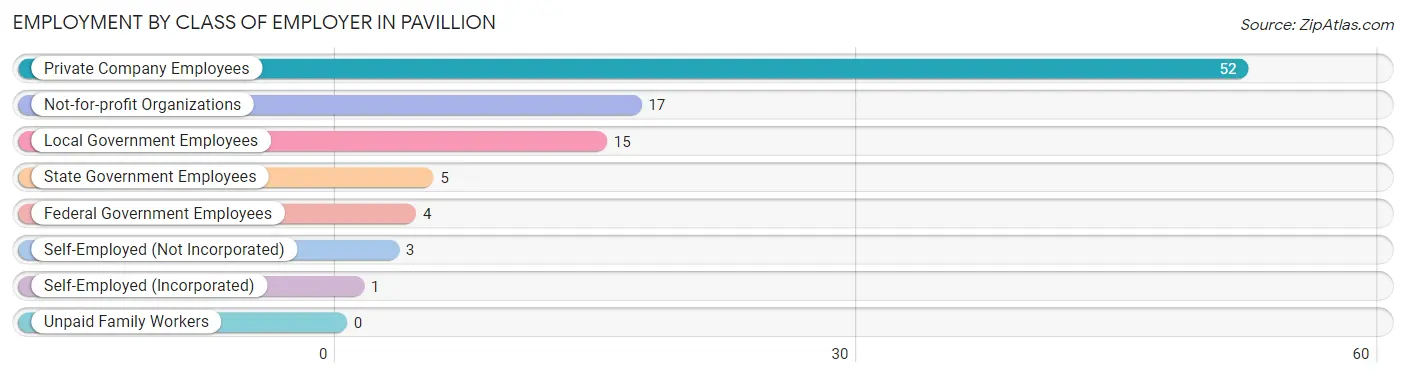
| Employer Class | # Employees | % Employees |
| Private Company Employees | 52 | 53.6% |
| Self-Employed (Incorporated) | 1 | 1.0% |
| Self-Employed (Not Incorporated) | 3 | 3.1% |
| Not-for-profit Organizations | 17 | 17.5% |
| Local Government Employees | 15 | 15.5% |
| State Government Employees | 5 | 5.1% |
| Federal Government Employees | 4 | 4.1% |
| Unpaid Family Workers | 0 | 0.0% |
| Total | 97 | 100.0% |
Employment Status by Age in Pavillion
According to the labor force statistics for Pavillion, out of the total population over 16 years of age (238), 48.7% or 116 individuals are in the labor force, with 4.3% or 5 of them unemployed. The age group with the highest labor force participation rate is 55 to 59 years, with 83.3% or 15 individuals in the labor force. Within the labor force, the 55 to 59 years age range has the highest percentage of unemployed individuals, with 13.3% or 2 of them being unemployed.
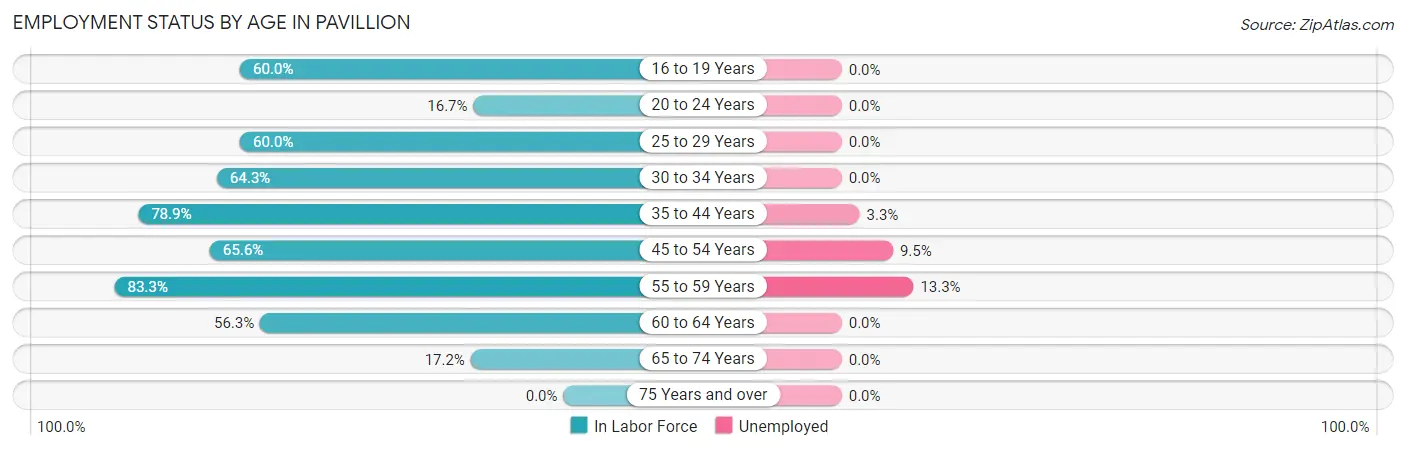
| Age Bracket | In Labor Force | Unemployed |
| 16 to 19 Years | 18 (60.0%) | 0 (0.0%) |
| 20 to 24 Years | 1 (16.7%) | 0 (0.0%) |
| 25 to 29 Years | 3 (60.0%) | 0 (0.0%) |
| 30 to 34 Years | 9 (64.3%) | 0 (0.0%) |
| 35 to 44 Years | 30 (78.9%) | 1 (3.3%) |
| 45 to 54 Years | 21 (65.6%) | 2 (9.5%) |
| 55 to 59 Years | 15 (83.3%) | 2 (13.3%) |
| 60 to 64 Years | 9 (56.3%) | 0 (0.0%) |
| 65 to 74 Years | 10 (17.2%) | 0 (0.0%) |
| 75 Years and over | 0 (0.0%) | 0 (0.0%) |
| Total | 116 (48.7%) | 5 (4.3%) |
Employment Status by Educational Attainment in Pavillion
According to labor force statistics for Pavillion, 70.7% of individuals (87) out of the total population between 25 and 64 years of age (123) are in the labor force, with 5.7% or 5 of them being unemployed. The group with the highest labor force participation rate are those with the educational attainment of college / associate degree, with 78.6% or 33 individuals in the labor force. Within the labor force, individuals with high school diploma education have the highest percentage of unemployment, with 8.7% or 2 of them being unemployed.
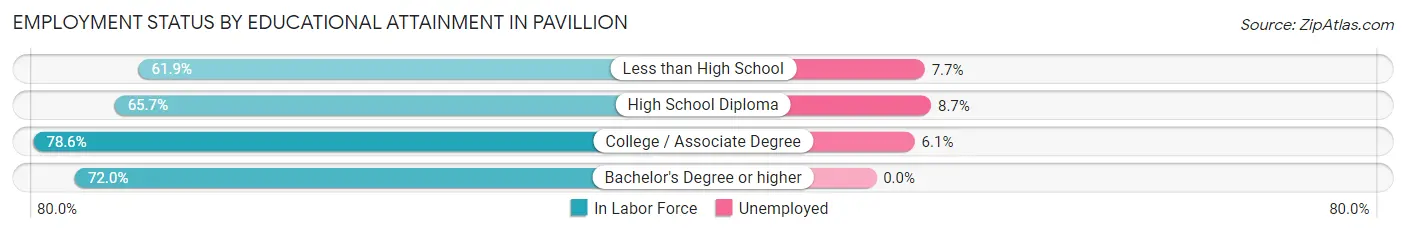
| Educational Attainment | In Labor Force | Unemployed |
| Less than High School | 13 (61.9%) | 2 (7.7%) |
| High School Diploma | 23 (65.7%) | 3 (8.7%) |
| College / Associate Degree | 33 (78.6%) | 3 (6.1%) |
| Bachelor's Degree or higher | 18 (72.0%) | 0 (0.0%) |
| Total | 87 (70.7%) | 7 (5.7%) |
Employment Occupations by Sex in Pavillion
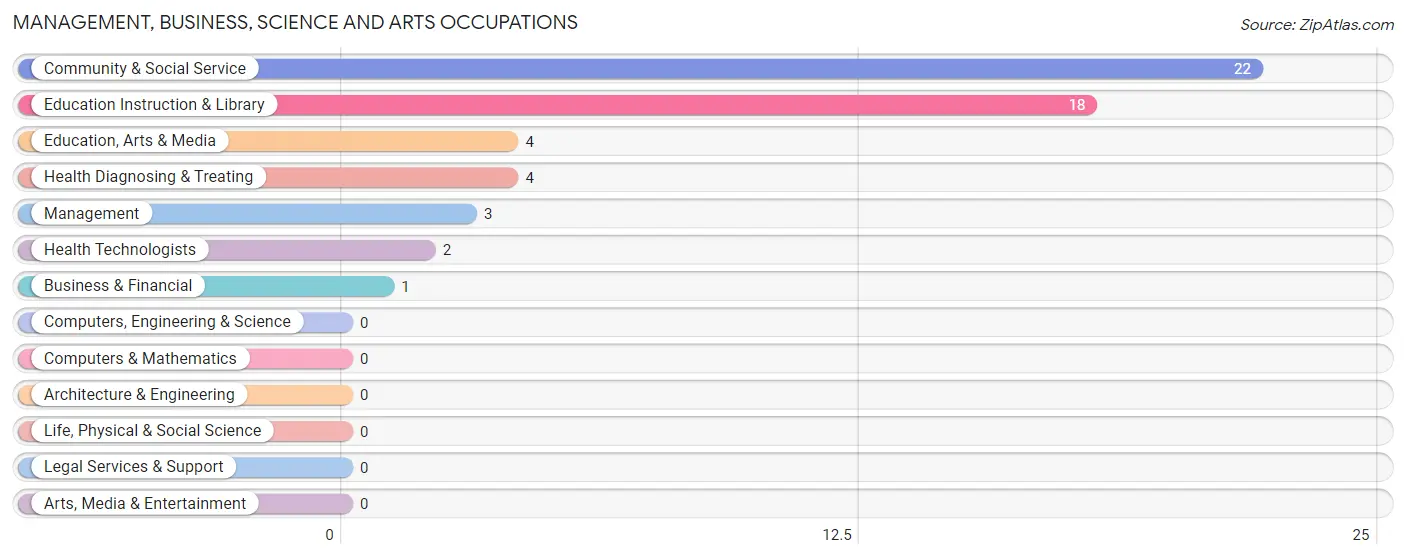
Management, Business, Science and Arts Occupations
The most common Management, Business, Science and Arts occupations in Pavillion are Community & Social Service (22 | 19.8%), Education Instruction & Library (18 | 16.2%), Education, Arts & Media (4 | 3.6%), Health Diagnosing & Treating (4 | 3.6%), and Management (3 | 2.7%).
Management, Business, Science and Arts Occupations by Sex
Within the Management, Business, Science and Arts occupations in Pavillion, the most male-oriented occupations are Business & Financial (100.0%), Health Technologists (100.0%), and Education, Arts & Media (75.0%), while the most female-oriented occupations are Education Instruction & Library (77.8%), Community & Social Service (68.2%), and Health Diagnosing & Treating (50.0%).
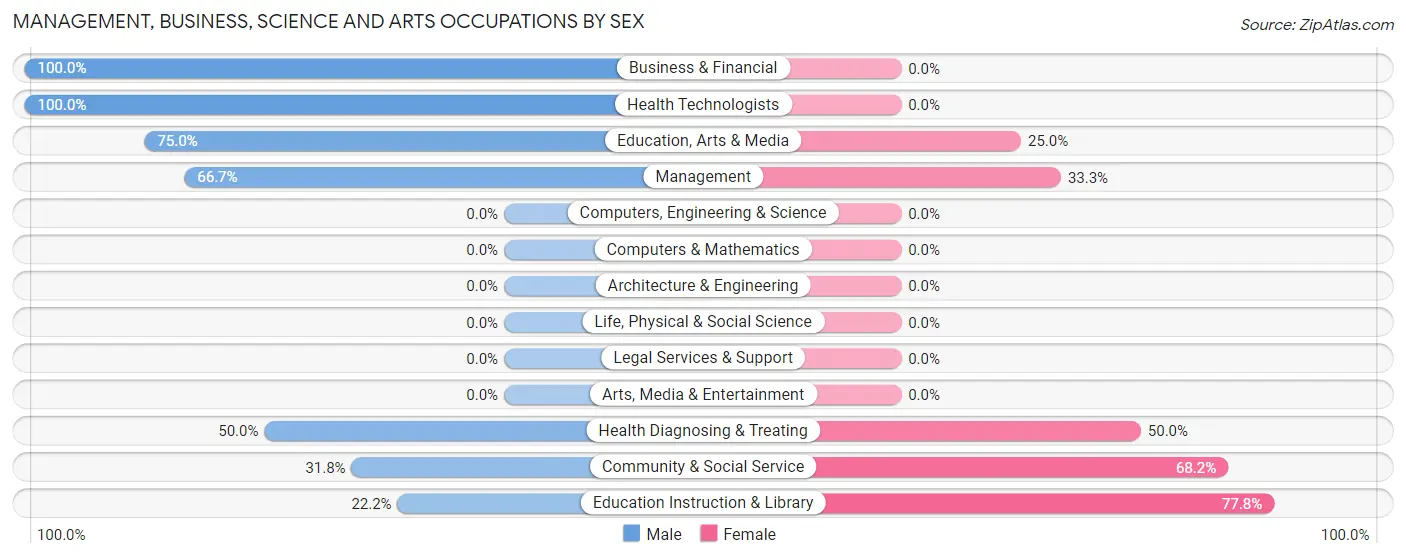
| Occupation | Male | Female |
| Management | 2 (66.7%) | 1 (33.3%) |
| Business & Financial | 1 (100.0%) | 0 (0.0%) |
| Computers, Engineering & Science | 0 (0.0%) | 0 (0.0%) |
| Computers & Mathematics | 0 (0.0%) | 0 (0.0%) |
| Architecture & Engineering | 0 (0.0%) | 0 (0.0%) |
| Life, Physical & Social Science | 0 (0.0%) | 0 (0.0%) |
| Community & Social Service | 7 (31.8%) | 15 (68.2%) |
| Education, Arts & Media | 3 (75.0%) | 1 (25.0%) |
| Legal Services & Support | 0 (0.0%) | 0 (0.0%) |
| Education Instruction & Library | 4 (22.2%) | 14 (77.8%) |
| Arts, Media & Entertainment | 0 (0.0%) | 0 (0.0%) |
| Health Diagnosing & Treating | 2 (50.0%) | 2 (50.0%) |
| Health Technologists | 2 (100.0%) | 0 (0.0%) |
| Total (Category) | 12 (40.0%) | 18 (60.0%) |
| Total (Overall) | 48 (43.2%) | 63 (56.8%) |
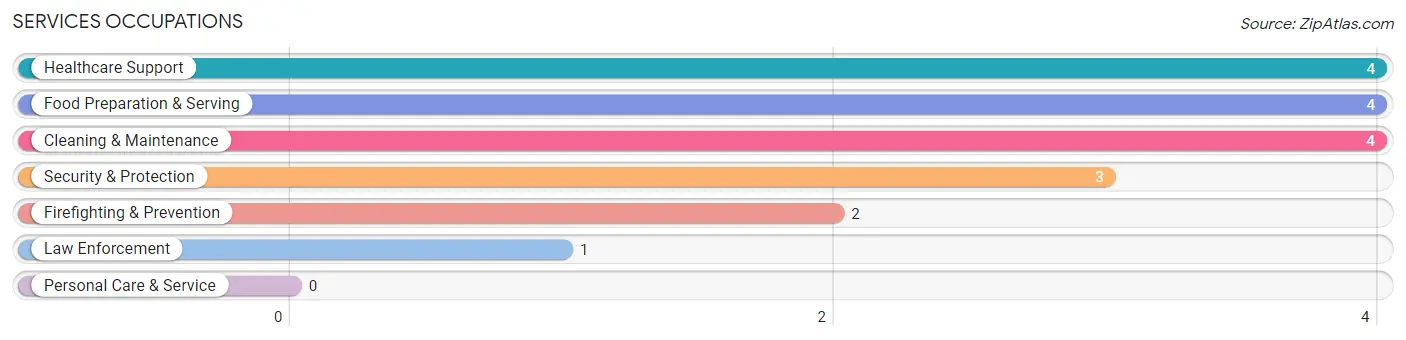
Services Occupations
The most common Services occupations in Pavillion are Healthcare Support (4 | 3.6%), Food Preparation & Serving (4 | 3.6%), Cleaning & Maintenance (4 | 3.6%), Security & Protection (3 | 2.7%), and Firefighting & Prevention (2 | 1.8%).
Services Occupations by Sex
Within the Services occupations in Pavillion, the most male-oriented occupations are Law Enforcement (100.0%), Healthcare Support (50.0%), and Security & Protection (33.3%), while the most female-oriented occupations are Firefighting & Prevention (100.0%), Food Preparation & Serving (100.0%), and Cleaning & Maintenance (100.0%).
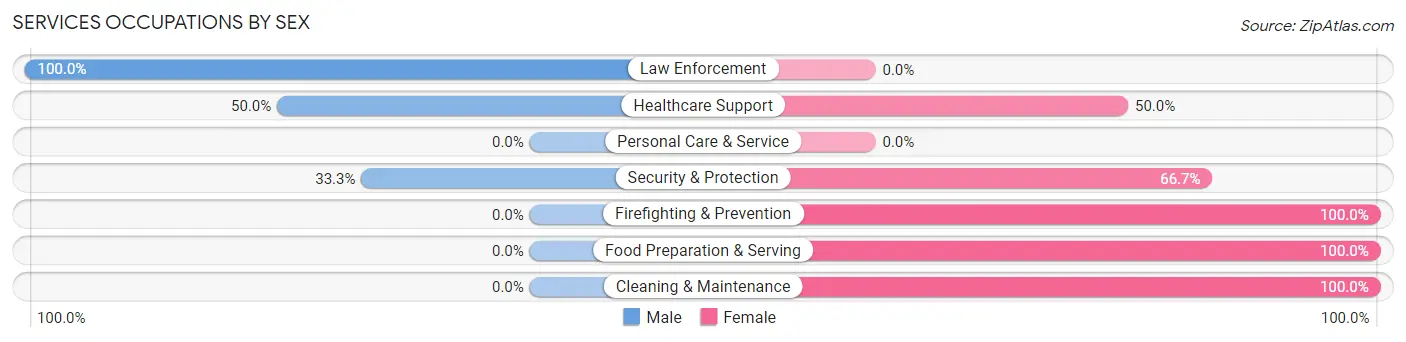
| Occupation | Male | Female |
| Healthcare Support | 2 (50.0%) | 2 (50.0%) |
| Security & Protection | 1 (33.3%) | 2 (66.7%) |
| Firefighting & Prevention | 0 (0.0%) | 2 (100.0%) |
| Law Enforcement | 1 (100.0%) | 0 (0.0%) |
| Food Preparation & Serving | 0 (0.0%) | 4 (100.0%) |
| Cleaning & Maintenance | 0 (0.0%) | 4 (100.0%) |
| Personal Care & Service | 0 (0.0%) | 0 (0.0%) |
| Total (Category) | 3 (20.0%) | 12 (80.0%) |
| Total (Overall) | 48 (43.2%) | 63 (56.8%) |
Sales and Office Occupations
The most common Sales and Office occupations in Pavillion are Office & Administration (20 | 18.0%), and Sales & Related (17 | 15.3%).
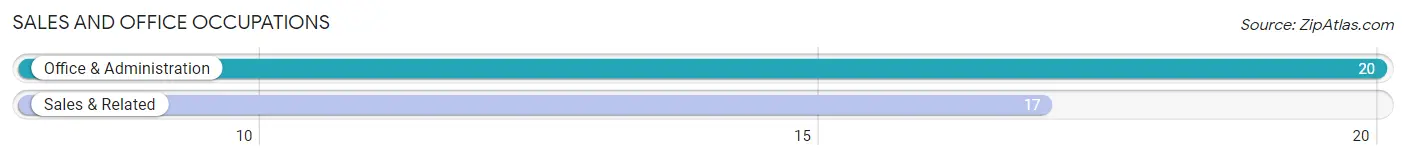
Sales and Office Occupations by Sex
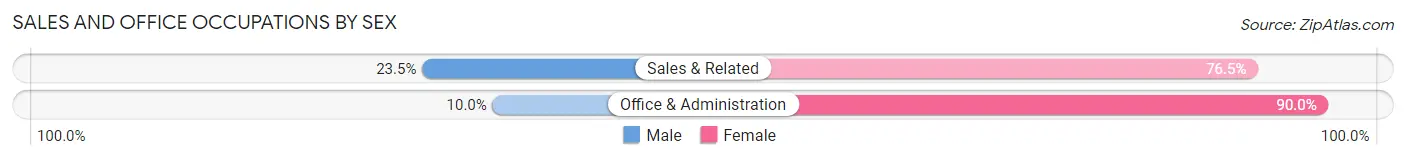
| Occupation | Male | Female |
| Sales & Related | 4 (23.5%) | 13 (76.5%) |
| Office & Administration | 2 (10.0%) | 18 (90.0%) |
| Total (Category) | 6 (16.2%) | 31 (83.8%) |
| Total (Overall) | 48 (43.2%) | 63 (56.8%) |
Natural Resources, Construction and Maintenance Occupations
The most common Natural Resources, Construction and Maintenance occupations in Pavillion are Farming, Fishing & Forestry (10 | 9.0%), and Construction & Extraction (9 | 8.1%).
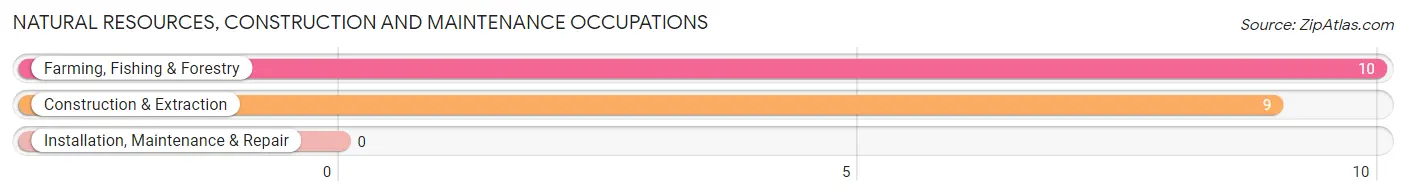
Natural Resources, Construction and Maintenance Occupations by Sex
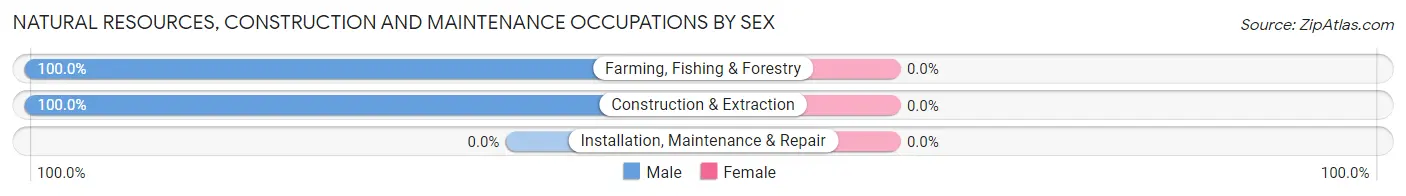
| Occupation | Male | Female |
| Farming, Fishing & Forestry | 10 (100.0%) | 0 (0.0%) |
| Construction & Extraction | 9 (100.0%) | 0 (0.0%) |
| Installation, Maintenance & Repair | 0 (0.0%) | 0 (0.0%) |
| Total (Category) | 19 (100.0%) | 0 (0.0%) |
| Total (Overall) | 48 (43.2%) | 63 (56.8%) |
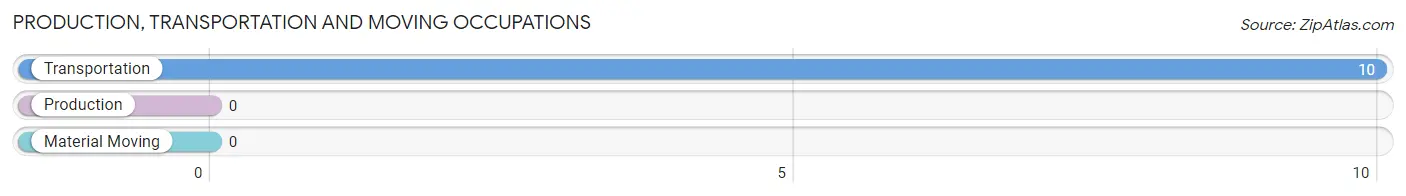
Production, Transportation and Moving Occupations
The most common Production, Transportation and Moving occupations in Pavillion are , and Transportation (10 | 9.0%).
Production, Transportation and Moving Occupations by Sex
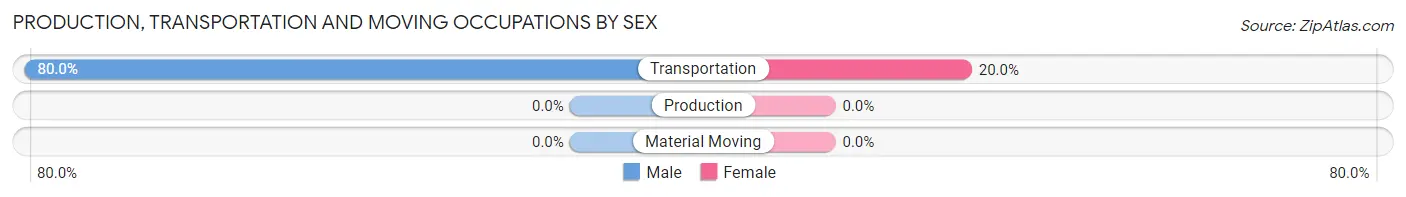
| Occupation | Male | Female |
| Production | 0 (0.0%) | 0 (0.0%) |
| Transportation | 8 (80.0%) | 2 (20.0%) |
| Material Moving | 0 (0.0%) | 0 (0.0%) |
| Total (Category) | 8 (80.0%) | 2 (20.0%) |
| Total (Overall) | 48 (43.2%) | 63 (56.8%) |
Employment Industries by Sex in Pavillion
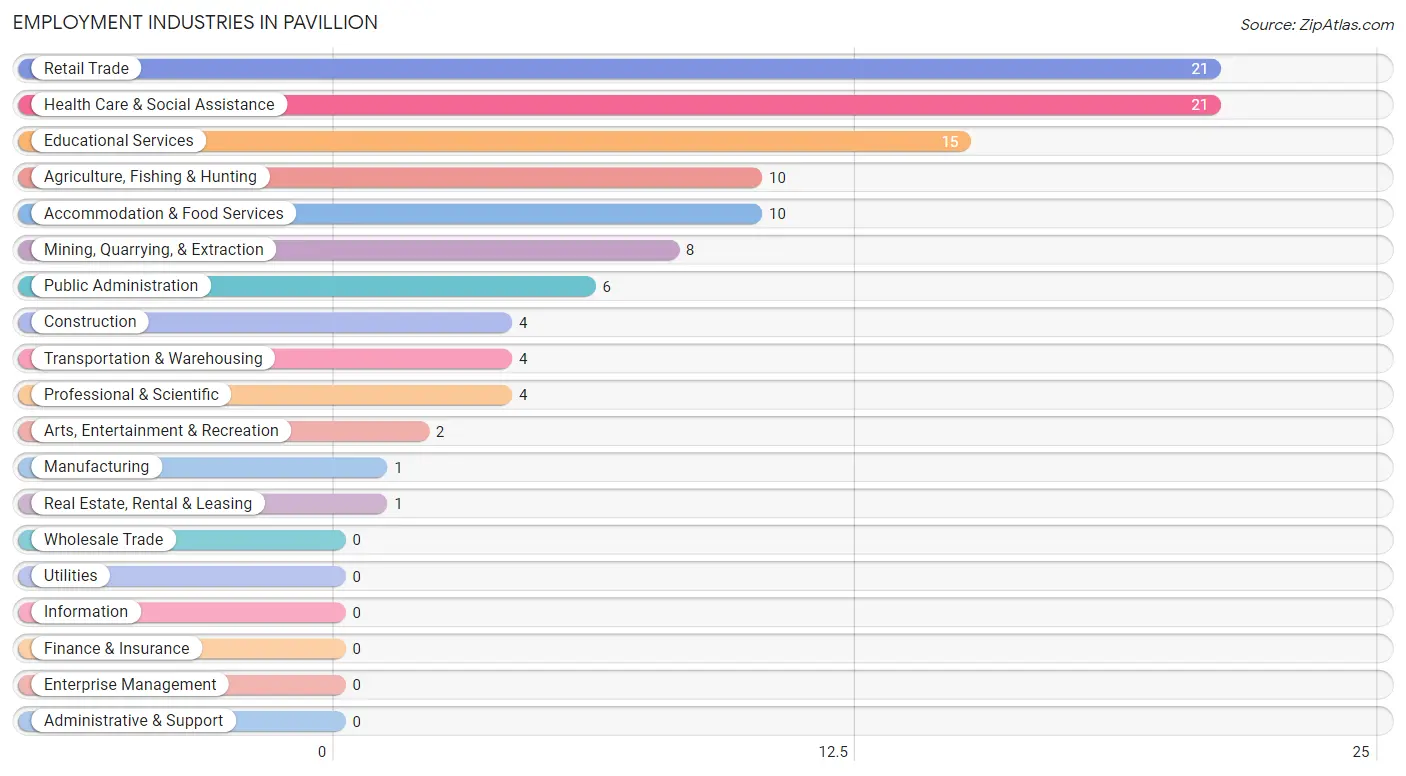
Employment Industries in Pavillion
The major employment industries in Pavillion include Retail Trade (21 | 18.9%), Health Care & Social Assistance (21 | 18.9%), Educational Services (15 | 13.5%), Agriculture, Fishing & Hunting (10 | 9.0%), and Accommodation & Food Services (10 | 9.0%).
Employment Industries by Sex in Pavillion
The Pavillion industries that see more men than women are Agriculture, Fishing & Hunting (100.0%), Construction (100.0%), and Manufacturing (100.0%), whereas the industries that tend to have a higher number of women are Arts, Entertainment & Recreation (100.0%), Retail Trade (90.5%), and Health Care & Social Assistance (80.9%).
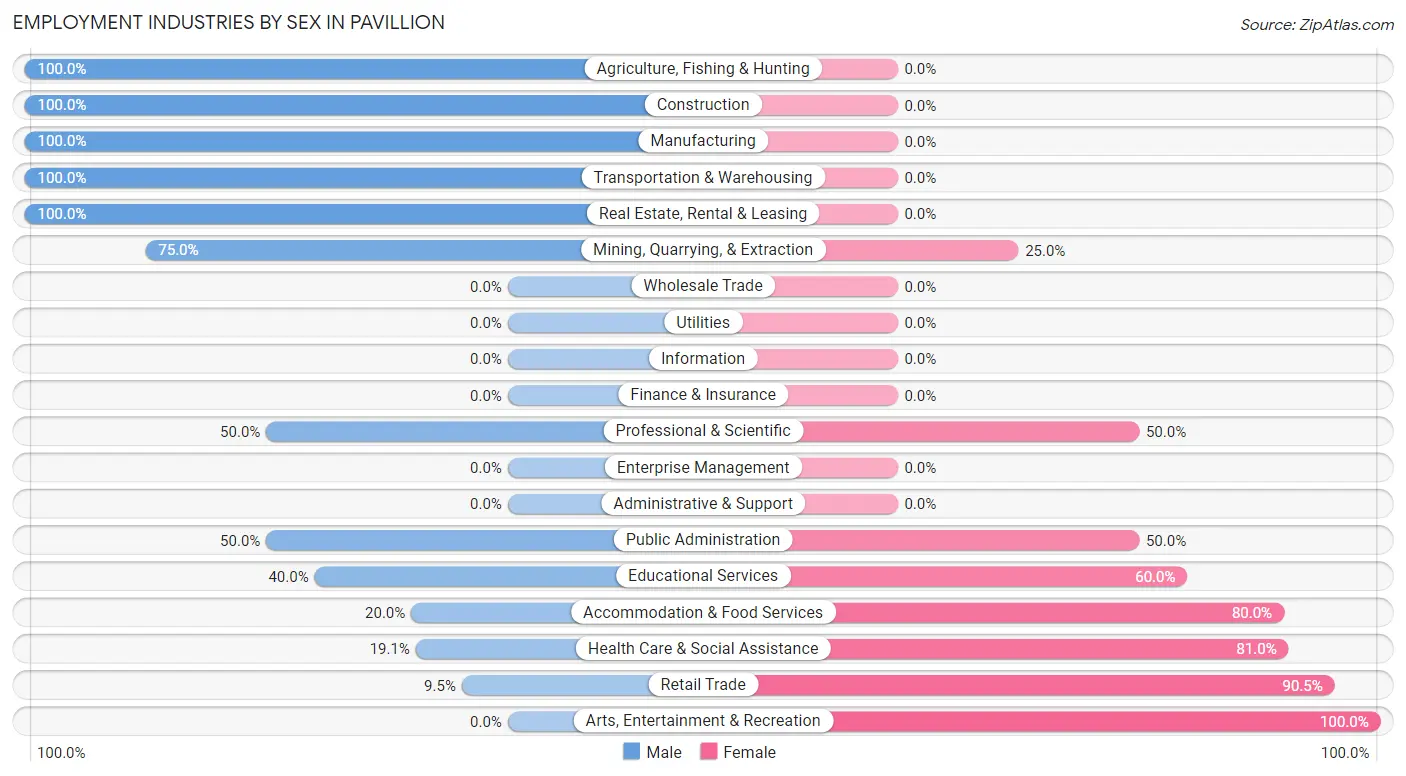
| Industry | Male | Female |
| Agriculture, Fishing & Hunting | 10 (100.0%) | 0 (0.0%) |
| Mining, Quarrying, & Extraction | 6 (75.0%) | 2 (25.0%) |
| Construction | 4 (100.0%) | 0 (0.0%) |
| Manufacturing | 1 (100.0%) | 0 (0.0%) |
| Wholesale Trade | 0 (0.0%) | 0 (0.0%) |
| Retail Trade | 2 (9.5%) | 19 (90.5%) |
| Transportation & Warehousing | 4 (100.0%) | 0 (0.0%) |
| Utilities | 0 (0.0%) | 0 (0.0%) |
| Information | 0 (0.0%) | 0 (0.0%) |
| Finance & Insurance | 0 (0.0%) | 0 (0.0%) |
| Real Estate, Rental & Leasing | 1 (100.0%) | 0 (0.0%) |
| Professional & Scientific | 2 (50.0%) | 2 (50.0%) |
| Enterprise Management | 0 (0.0%) | 0 (0.0%) |
| Administrative & Support | 0 (0.0%) | 0 (0.0%) |
| Educational Services | 6 (40.0%) | 9 (60.0%) |
| Health Care & Social Assistance | 4 (19.1%) | 17 (80.9%) |
| Arts, Entertainment & Recreation | 0 (0.0%) | 2 (100.0%) |
| Accommodation & Food Services | 2 (20.0%) | 8 (80.0%) |
| Public Administration | 3 (50.0%) | 3 (50.0%) |
| Total | 48 (43.2%) | 63 (56.8%) |
Education in Pavillion
School Enrollment in Pavillion
The most common levels of schooling among the 84 students in Pavillion are high school (31 | 36.9%), elementary school (18 | 21.4%), and middle school (18 | 21.4%).
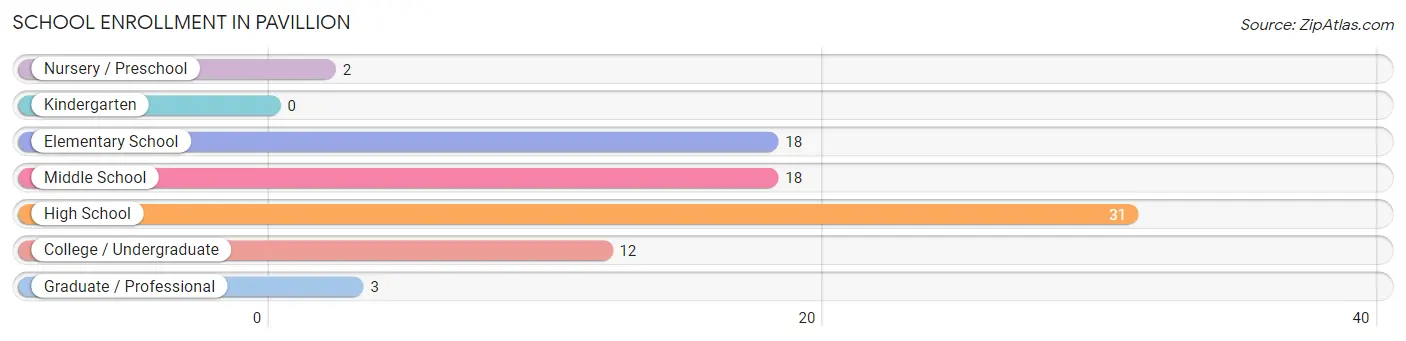
| School Level | # Students | % Students |
| Nursery / Preschool | 2 | 2.4% |
| Kindergarten | 0 | 0.0% |
| Elementary School | 18 | 21.4% |
| Middle School | 18 | 21.4% |
| High School | 31 | 36.9% |
| College / Undergraduate | 12 | 14.3% |
| Graduate / Professional | 3 | 3.6% |
| Total | 84 | 100.0% |
School Enrollment by Age by Funding Source in Pavillion
Out of a total of 84 students who are enrolled in schools in Pavillion, 8 (9.5%) attend a private institution, while the remaining 76 (90.5%) are enrolled in public schools. The age group of 35 years and over has the highest likelihood of being enrolled in private schools, with 3 (50.0% in the age bracket) enrolled. Conversely, the age group of 15 to 17 year olds has the lowest likelihood of being enrolled in a private school, with 26 (100.0% in the age bracket) attending a public institution.
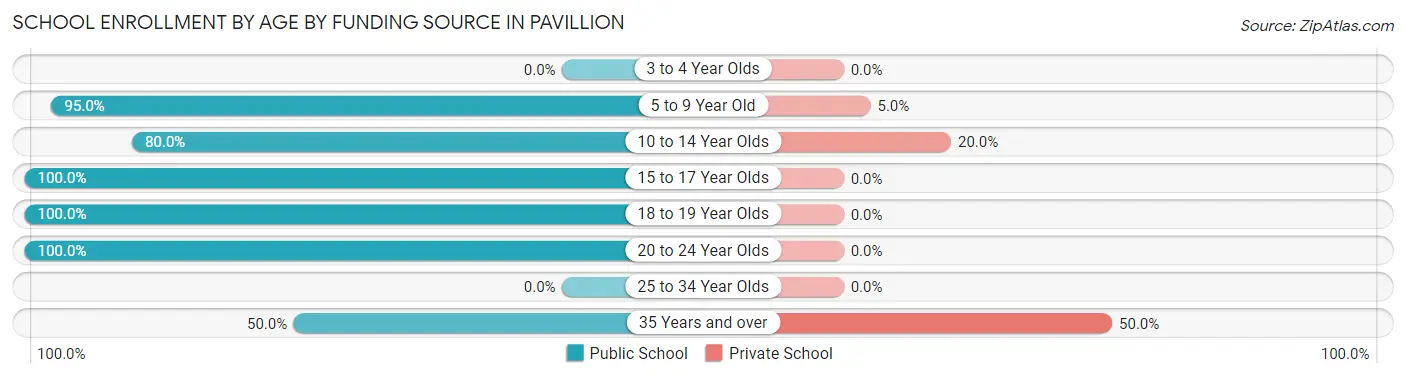
| Age Bracket | Public School | Private School |
| 3 to 4 Year Olds | 0 (0.0%) | 0 (0.0%) |
| 5 to 9 Year Old | 19 (95.0%) | 1 (5.0%) |
| 10 to 14 Year Olds | 16 (80.0%) | 4 (20.0%) |
| 15 to 17 Year Olds | 26 (100.0%) | 0 (0.0%) |
| 18 to 19 Year Olds | 10 (100.0%) | 0 (0.0%) |
| 20 to 24 Year Olds | 2 (100.0%) | 0 (0.0%) |
| 25 to 34 Year Olds | 0 (0.0%) | 0 (0.0%) |
| 35 Years and over | 3 (50.0%) | 3 (50.0%) |
| Total | 76 (90.5%) | 8 (9.5%) |
Educational Attainment by Field of Study in Pavillion
Education (17 | 48.6%), social sciences (4 | 11.4%), science & technology (4 | 11.4%), communications (4 | 11.4%), and bio, nature & agricultural (2 | 5.7%) are the most common fields of study among 35 individuals in Pavillion who have obtained a bachelor's degree or higher.
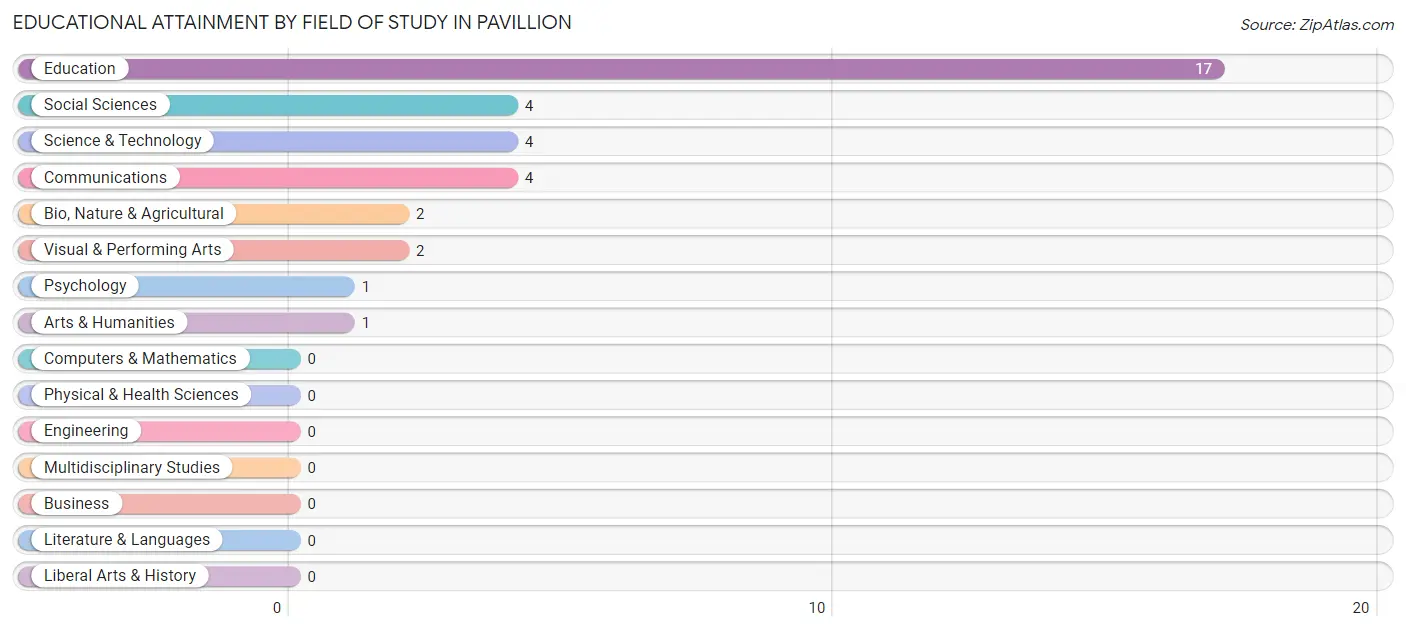
| Field of Study | # Graduates | % Graduates |
| Computers & Mathematics | 0 | 0.0% |
| Bio, Nature & Agricultural | 2 | 5.7% |
| Physical & Health Sciences | 0 | 0.0% |
| Psychology | 1 | 2.9% |
| Social Sciences | 4 | 11.4% |
| Engineering | 0 | 0.0% |
| Multidisciplinary Studies | 0 | 0.0% |
| Science & Technology | 4 | 11.4% |
| Business | 0 | 0.0% |
| Education | 17 | 48.6% |
| Literature & Languages | 0 | 0.0% |
| Liberal Arts & History | 0 | 0.0% |
| Visual & Performing Arts | 2 | 5.7% |
| Communications | 4 | 11.4% |
| Arts & Humanities | 1 | 2.9% |
| Total | 35 | 100.0% |
Transportation & Commute in Pavillion
Vehicle Availability by Sex in Pavillion
The most prevalent vehicle ownership categories in Pavillion are males with 3 vehicles (20, accounting for 47.6%) and females with 3 vehicles (28, making up 36.4%).
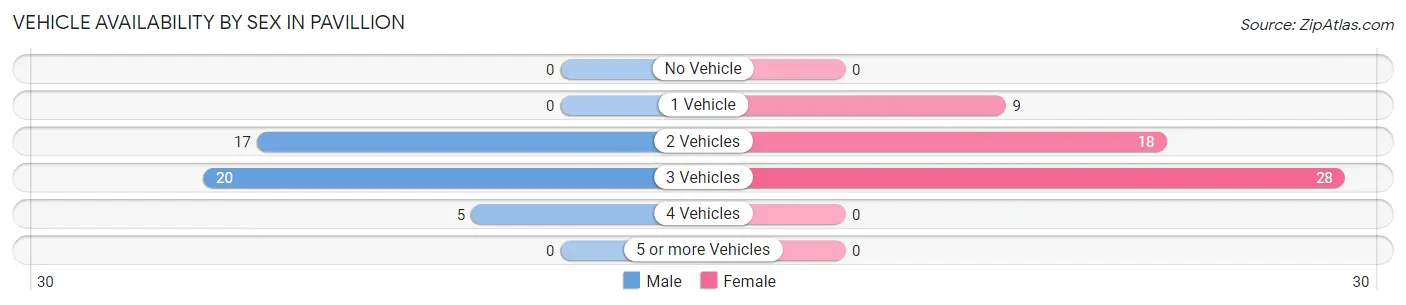
| Vehicles Available | Male | Female |
| No Vehicle | 0 (0.0%) | 0 (0.0%) |
| 1 Vehicle | 0 (0.0%) | 9 (16.4%) |
| 2 Vehicles | 17 (40.5%) | 18 (32.7%) |
| 3 Vehicles | 20 (47.6%) | 28 (50.9%) |
| 4 Vehicles | 5 (11.9%) | 0 (0.0%) |
| 5 or more Vehicles | 0 (0.0%) | 0 (0.0%) |
| Total | 42 (100.0%) | 55 (100.0%) |
Commute Time in Pavillion
The most frequently occuring commute durations in Pavillion are 30 to 34 minutes (21 commuters, 22.3%), 45 to 59 minutes (16 commuters, 17.0%), and 35 to 39 minutes (11 commuters, 11.7%).
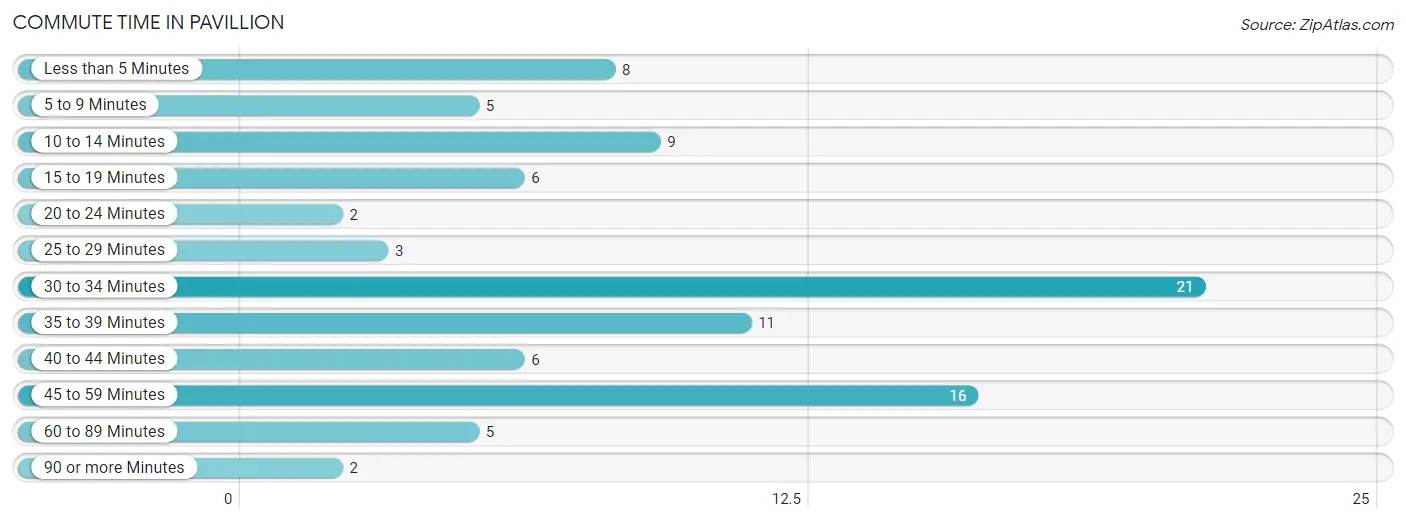
| Commute Time | # Commuters | % Commuters |
| Less than 5 Minutes | 8 | 8.5% |
| 5 to 9 Minutes | 5 | 5.3% |
| 10 to 14 Minutes | 9 | 9.6% |
| 15 to 19 Minutes | 6 | 6.4% |
| 20 to 24 Minutes | 2 | 2.1% |
| 25 to 29 Minutes | 3 | 3.2% |
| 30 to 34 Minutes | 21 | 22.3% |
| 35 to 39 Minutes | 11 | 11.7% |
| 40 to 44 Minutes | 6 | 6.4% |
| 45 to 59 Minutes | 16 | 17.0% |
| 60 to 89 Minutes | 5 | 5.3% |
| 90 or more Minutes | 2 | 2.1% |
Commute Time by Sex in Pavillion
The most common commute times in Pavillion are 35 to 39 minutes (8 commuters, 20.0%) for males and 30 to 34 minutes (14 commuters, 25.9%) for females.
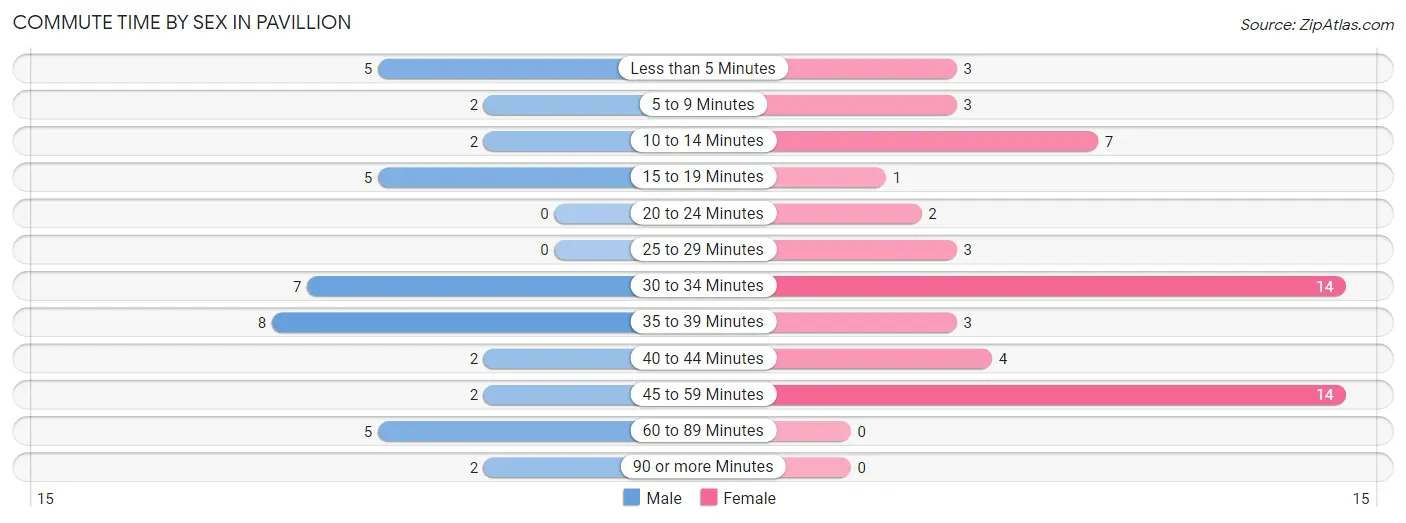
| Commute Time | Male | Female |
| Less than 5 Minutes | 5 (12.5%) | 3 (5.6%) |
| 5 to 9 Minutes | 2 (5.0%) | 3 (5.6%) |
| 10 to 14 Minutes | 2 (5.0%) | 7 (13.0%) |
| 15 to 19 Minutes | 5 (12.5%) | 1 (1.8%) |
| 20 to 24 Minutes | 0 (0.0%) | 2 (3.7%) |
| 25 to 29 Minutes | 0 (0.0%) | 3 (5.6%) |
| 30 to 34 Minutes | 7 (17.5%) | 14 (25.9%) |
| 35 to 39 Minutes | 8 (20.0%) | 3 (5.6%) |
| 40 to 44 Minutes | 2 (5.0%) | 4 (7.4%) |
| 45 to 59 Minutes | 2 (5.0%) | 14 (25.9%) |
| 60 to 89 Minutes | 5 (12.5%) | 0 (0.0%) |
| 90 or more Minutes | 2 (5.0%) | 0 (0.0%) |
Time of Departure to Work by Sex in Pavillion
The most frequent times of departure to work in Pavillion are 6:00 AM to 6:29 AM (10, 25.0%) for males and 7:00 AM to 7:29 AM (16, 29.6%) for females.
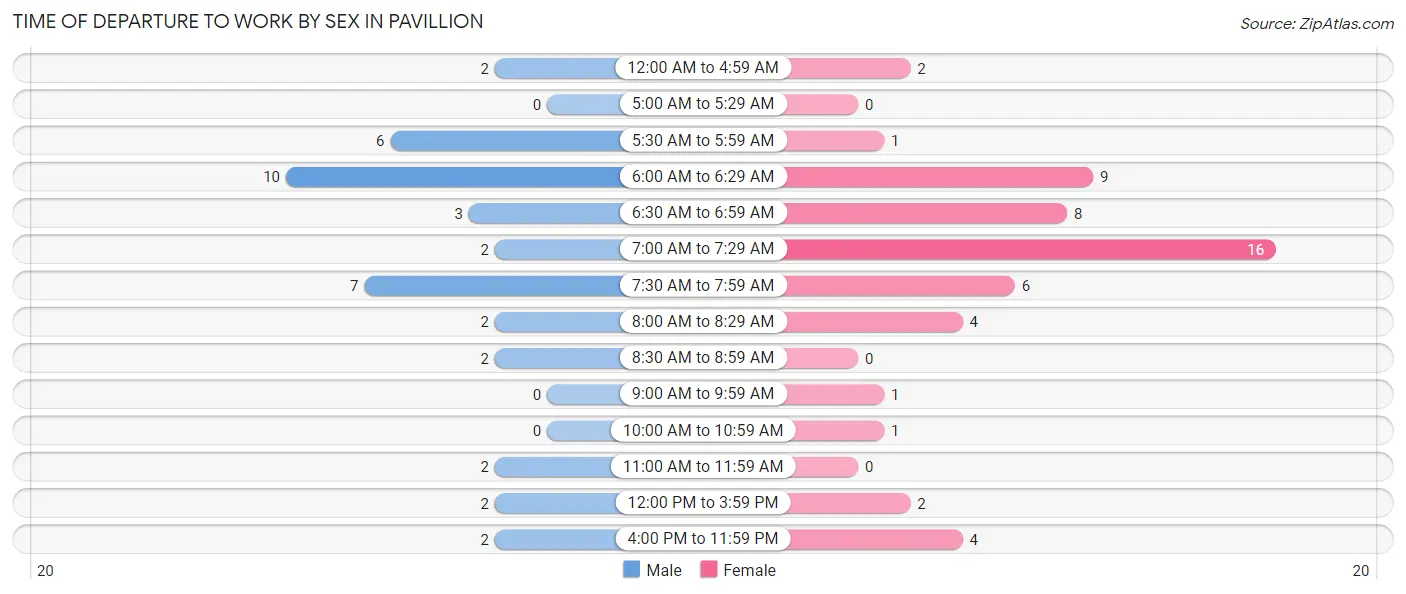
| Time of Departure | Male | Female |
| 12:00 AM to 4:59 AM | 2 (5.0%) | 2 (3.7%) |
| 5:00 AM to 5:29 AM | 0 (0.0%) | 0 (0.0%) |
| 5:30 AM to 5:59 AM | 6 (15.0%) | 1 (1.8%) |
| 6:00 AM to 6:29 AM | 10 (25.0%) | 9 (16.7%) |
| 6:30 AM to 6:59 AM | 3 (7.5%) | 8 (14.8%) |
| 7:00 AM to 7:29 AM | 2 (5.0%) | 16 (29.6%) |
| 7:30 AM to 7:59 AM | 7 (17.5%) | 6 (11.1%) |
| 8:00 AM to 8:29 AM | 2 (5.0%) | 4 (7.4%) |
| 8:30 AM to 8:59 AM | 2 (5.0%) | 0 (0.0%) |
| 9:00 AM to 9:59 AM | 0 (0.0%) | 1 (1.8%) |
| 10:00 AM to 10:59 AM | 0 (0.0%) | 1 (1.8%) |
| 11:00 AM to 11:59 AM | 2 (5.0%) | 0 (0.0%) |
| 12:00 PM to 3:59 PM | 2 (5.0%) | 2 (3.7%) |
| 4:00 PM to 11:59 PM | 2 (5.0%) | 4 (7.4%) |
| Total | 40 (100.0%) | 54 (100.0%) |
Housing Occupancy in Pavillion
Occupancy by Ownership in Pavillion
Of the total 96 dwellings in Pavillion, owner-occupied units account for 78 (81.2%), while renter-occupied units make up 18 (18.8%).
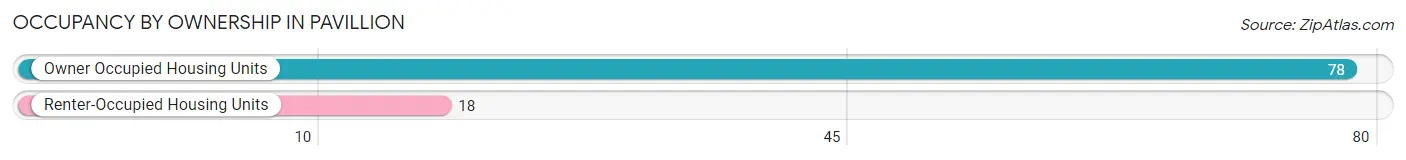
| Occupancy | # Housing Units | % Housing Units |
| Owner Occupied Housing Units | 78 | 81.2% |
| Renter-Occupied Housing Units | 18 | 18.8% |
| Total Occupied Housing Units | 96 | 100.0% |
Occupancy by Household Size in Pavillion
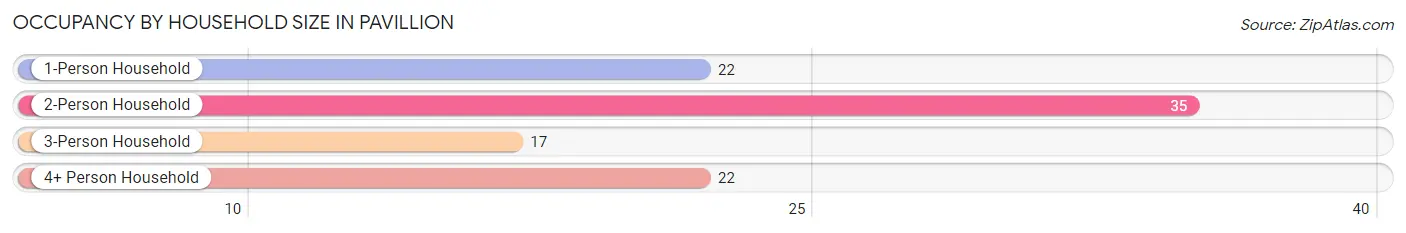
| Household Size | # Housing Units | % Housing Units |
| 1-Person Household | 22 | 22.9% |
| 2-Person Household | 35 | 36.5% |
| 3-Person Household | 17 | 17.7% |
| 4+ Person Household | 22 | 22.9% |
| Total Housing Units | 96 | 100.0% |
Occupancy by Ownership by Household Size in Pavillion
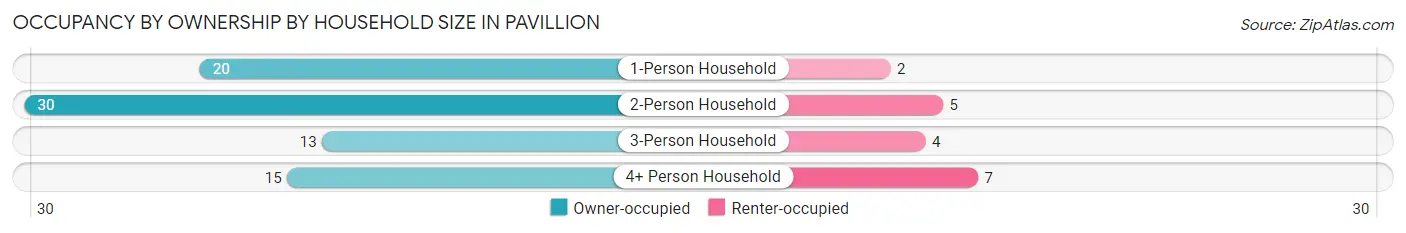
| Household Size | Owner-occupied | Renter-occupied |
| 1-Person Household | 20 (90.9%) | 2 (9.1%) |
| 2-Person Household | 30 (85.7%) | 5 (14.3%) |
| 3-Person Household | 13 (76.5%) | 4 (23.5%) |
| 4+ Person Household | 15 (68.2%) | 7 (31.8%) |
| Total Housing Units | 78 (81.2%) | 18 (18.8%) |
Occupancy by Educational Attainment in Pavillion
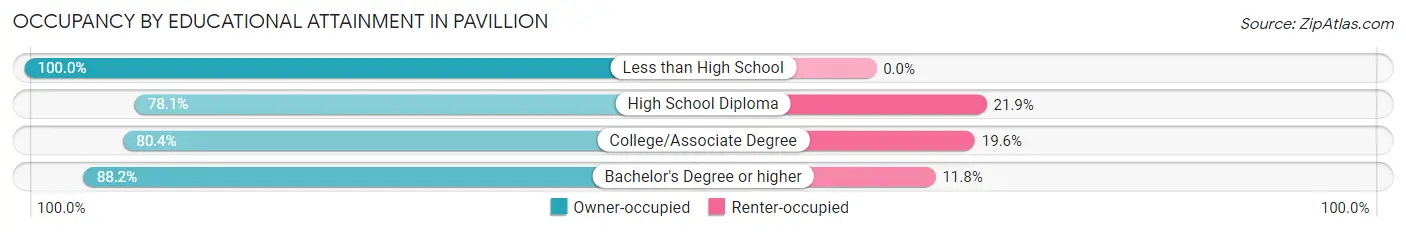
| Household Size | Owner-occupied | Renter-occupied |
| Less than High School | 1 (100.0%) | 0 (0.0%) |
| High School Diploma | 25 (78.1%) | 7 (21.9%) |
| College/Associate Degree | 37 (80.4%) | 9 (19.6%) |
| Bachelor's Degree or higher | 15 (88.2%) | 2 (11.8%) |
Occupancy by Age of Householder in Pavillion
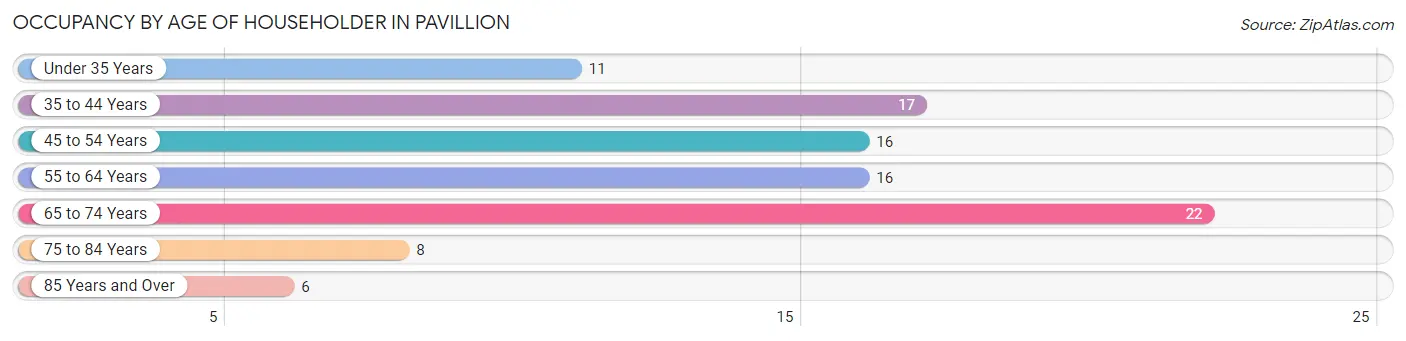
| Age Bracket | # Households | % Households |
| Under 35 Years | 11 | 11.5% |
| 35 to 44 Years | 17 | 17.7% |
| 45 to 54 Years | 16 | 16.7% |
| 55 to 64 Years | 16 | 16.7% |
| 65 to 74 Years | 22 | 22.9% |
| 75 to 84 Years | 8 | 8.3% |
| 85 Years and Over | 6 | 6.2% |
| Total | 96 | 100.0% |
Housing Finances in Pavillion
Median Income by Occupancy in Pavillion
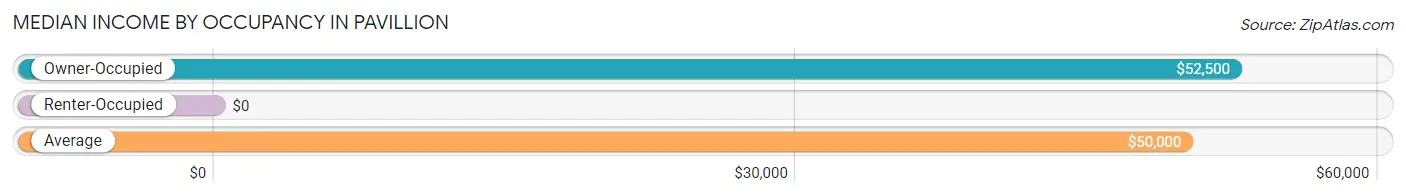
| Occupancy Type | # Households | Median Income |
| Owner-Occupied | 78 (81.2%) | $52,500 |
| Renter-Occupied | 18 (18.8%) | $0 |
| Average | 96 (100.0%) | $50,000 |
Occupancy by Householder Income Bracket in Pavillion
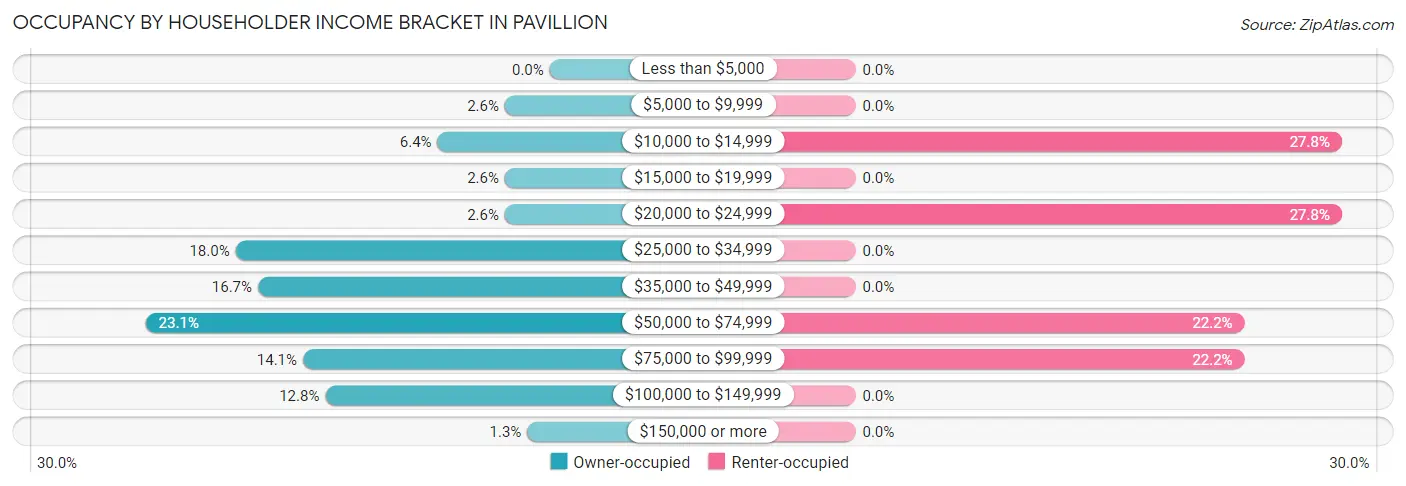
| Income Bracket | Owner-occupied | Renter-occupied |
| Less than $5,000 | 0 (0.0%) | 0 (0.0%) |
| $5,000 to $9,999 | 2 (2.6%) | 0 (0.0%) |
| $10,000 to $14,999 | 5 (6.4%) | 5 (27.8%) |
| $15,000 to $19,999 | 2 (2.6%) | 0 (0.0%) |
| $20,000 to $24,999 | 2 (2.6%) | 5 (27.8%) |
| $25,000 to $34,999 | 14 (17.9%) | 0 (0.0%) |
| $35,000 to $49,999 | 13 (16.7%) | 0 (0.0%) |
| $50,000 to $74,999 | 18 (23.1%) | 4 (22.2%) |
| $75,000 to $99,999 | 11 (14.1%) | 4 (22.2%) |
| $100,000 to $149,999 | 10 (12.8%) | 0 (0.0%) |
| $150,000 or more | 1 (1.3%) | 0 (0.0%) |
| Total | 78 (100.0%) | 18 (100.0%) |
Monthly Housing Cost Tiers in Pavillion
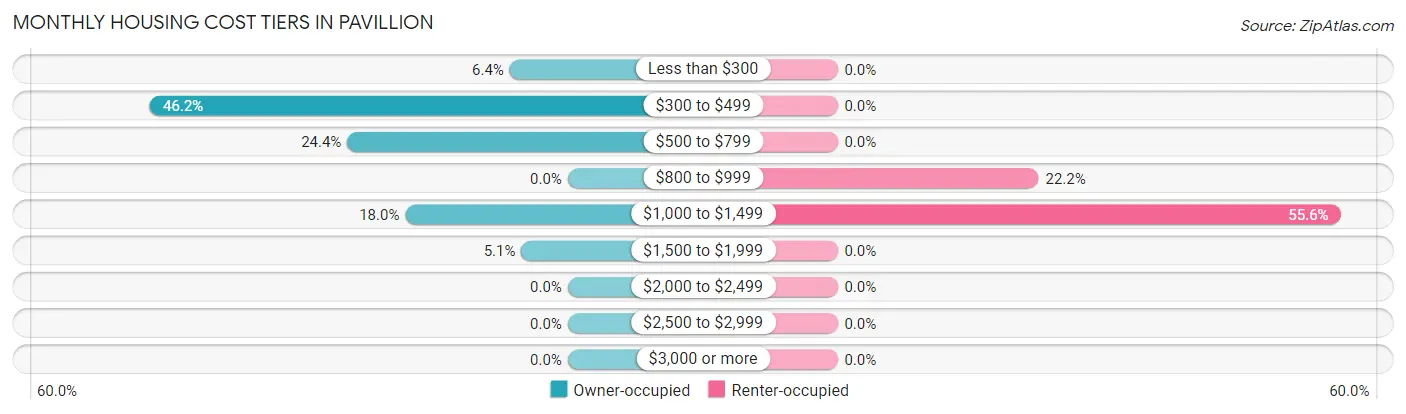
| Monthly Cost | Owner-occupied | Renter-occupied |
| Less than $300 | 5 (6.4%) | 0 (0.0%) |
| $300 to $499 | 36 (46.2%) | 0 (0.0%) |
| $500 to $799 | 19 (24.4%) | 0 (0.0%) |
| $800 to $999 | 0 (0.0%) | 4 (22.2%) |
| $1,000 to $1,499 | 14 (17.9%) | 10 (55.6%) |
| $1,500 to $1,999 | 4 (5.1%) | 0 (0.0%) |
| $2,000 to $2,499 | 0 (0.0%) | 0 (0.0%) |
| $2,500 to $2,999 | 0 (0.0%) | 0 (0.0%) |
| $3,000 or more | 0 (0.0%) | 0 (0.0%) |
| Total | 78 (100.0%) | 18 (100.0%) |
Physical Housing Characteristics in Pavillion
Housing Structures in Pavillion
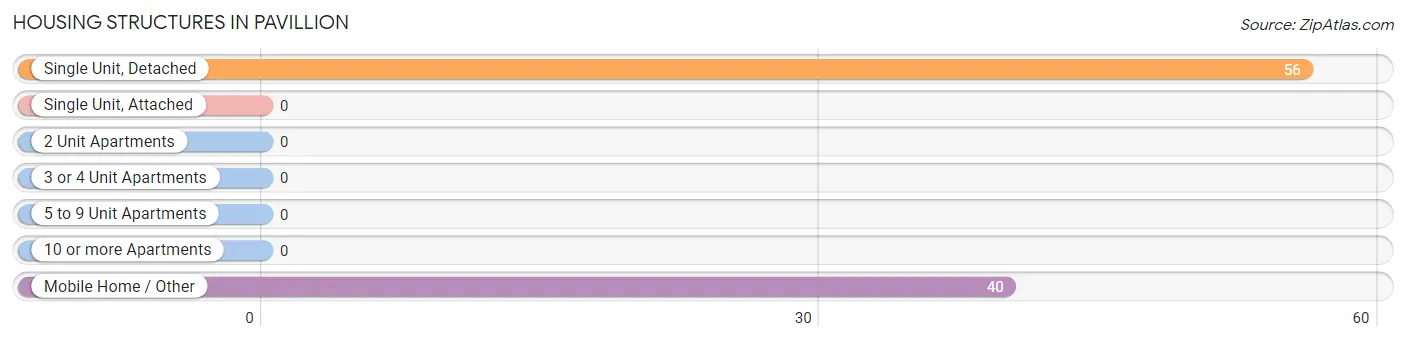
| Structure Type | # Housing Units | % Housing Units |
| Single Unit, Detached | 56 | 58.3% |
| Single Unit, Attached | 0 | 0.0% |
| 2 Unit Apartments | 0 | 0.0% |
| 3 or 4 Unit Apartments | 0 | 0.0% |
| 5 to 9 Unit Apartments | 0 | 0.0% |
| 10 or more Apartments | 0 | 0.0% |
| Mobile Home / Other | 40 | 41.7% |
| Total | 96 | 100.0% |
Housing Structures by Occupancy in Pavillion
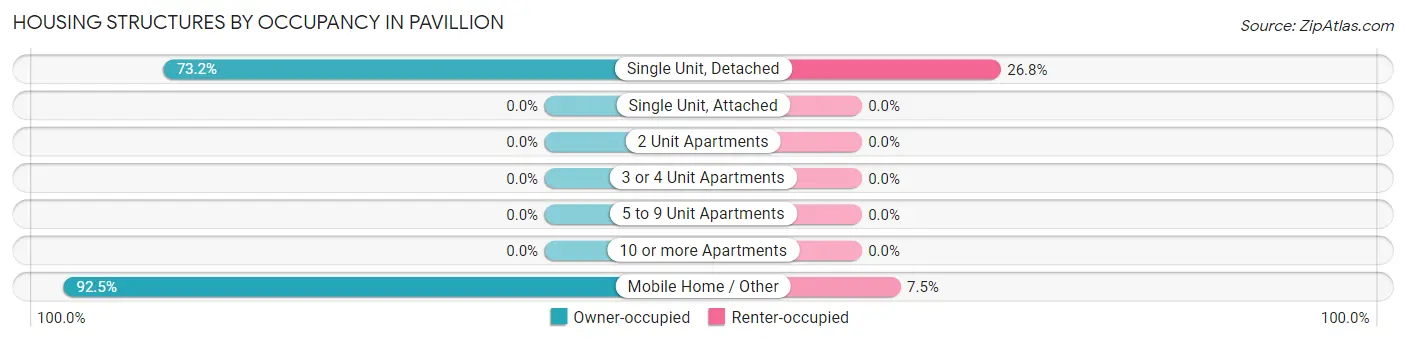
| Structure Type | Owner-occupied | Renter-occupied |
| Single Unit, Detached | 41 (73.2%) | 15 (26.8%) |
| Single Unit, Attached | 0 (0.0%) | 0 (0.0%) |
| 2 Unit Apartments | 0 (0.0%) | 0 (0.0%) |
| 3 or 4 Unit Apartments | 0 (0.0%) | 0 (0.0%) |
| 5 to 9 Unit Apartments | 0 (0.0%) | 0 (0.0%) |
| 10 or more Apartments | 0 (0.0%) | 0 (0.0%) |
| Mobile Home / Other | 37 (92.5%) | 3 (7.5%) |
| Total | 78 (81.2%) | 18 (18.8%) |
Housing Structures by Number of Rooms in Pavillion
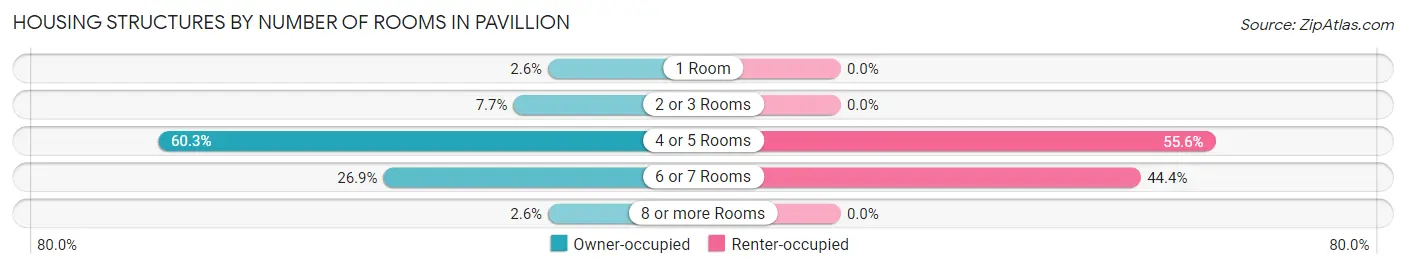
| Number of Rooms | Owner-occupied | Renter-occupied |
| 1 Room | 2 (2.6%) | 0 (0.0%) |
| 2 or 3 Rooms | 6 (7.7%) | 0 (0.0%) |
| 4 or 5 Rooms | 47 (60.3%) | 10 (55.6%) |
| 6 or 7 Rooms | 21 (26.9%) | 8 (44.4%) |
| 8 or more Rooms | 2 (2.6%) | 0 (0.0%) |
| Total | 78 (100.0%) | 18 (100.0%) |
Housing Structure by Heating Type in Pavillion
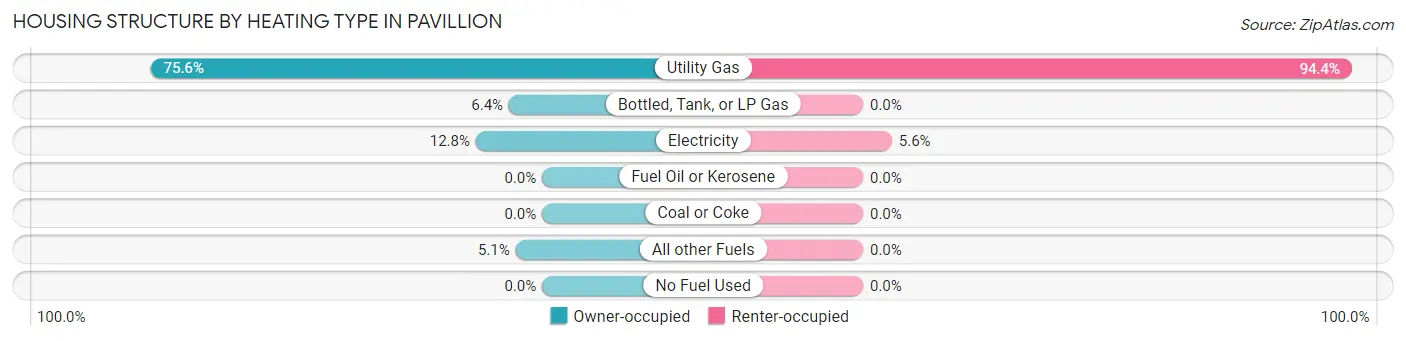
| Heating Type | Owner-occupied | Renter-occupied |
| Utility Gas | 59 (75.6%) | 17 (94.4%) |
| Bottled, Tank, or LP Gas | 5 (6.4%) | 0 (0.0%) |
| Electricity | 10 (12.8%) | 1 (5.6%) |
| Fuel Oil or Kerosene | 0 (0.0%) | 0 (0.0%) |
| Coal or Coke | 0 (0.0%) | 0 (0.0%) |
| All other Fuels | 4 (5.1%) | 0 (0.0%) |
| No Fuel Used | 0 (0.0%) | 0 (0.0%) |
| Total | 78 (100.0%) | 18 (100.0%) |
Household Vehicle Usage in Pavillion
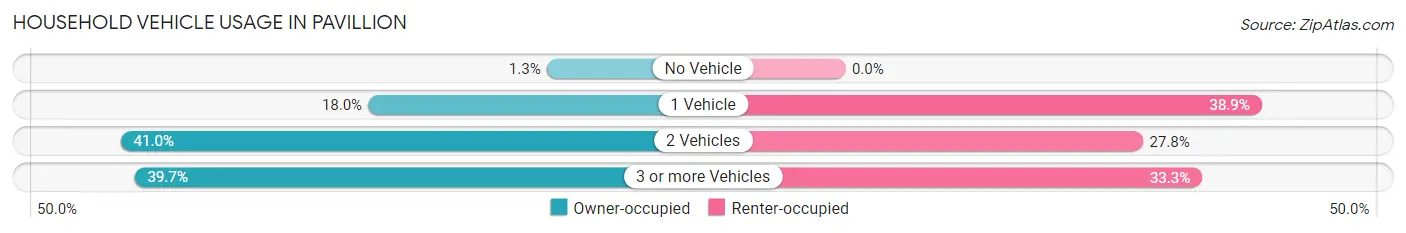
| Vehicles per Household | Owner-occupied | Renter-occupied |
| No Vehicle | 1 (1.3%) | 0 (0.0%) |
| 1 Vehicle | 14 (17.9%) | 7 (38.9%) |
| 2 Vehicles | 32 (41.0%) | 5 (27.8%) |
| 3 or more Vehicles | 31 (39.7%) | 6 (33.3%) |
| Total | 78 (100.0%) | 18 (100.0%) |
Real Estate & Mortgages in Pavillion
Real Estate and Mortgage Overview in Pavillion
| Characteristic | Without Mortgage | With Mortgage |
| Housing Units | 52 | 26 |
| Median Property Value | - | - |
| Median Household Income | $44,167 | $1 |
| Monthly Housing Costs | $435 | $0 |
| Real Estate Taxes | $482 | $0 |
Property Value by Mortgage Status in Pavillion
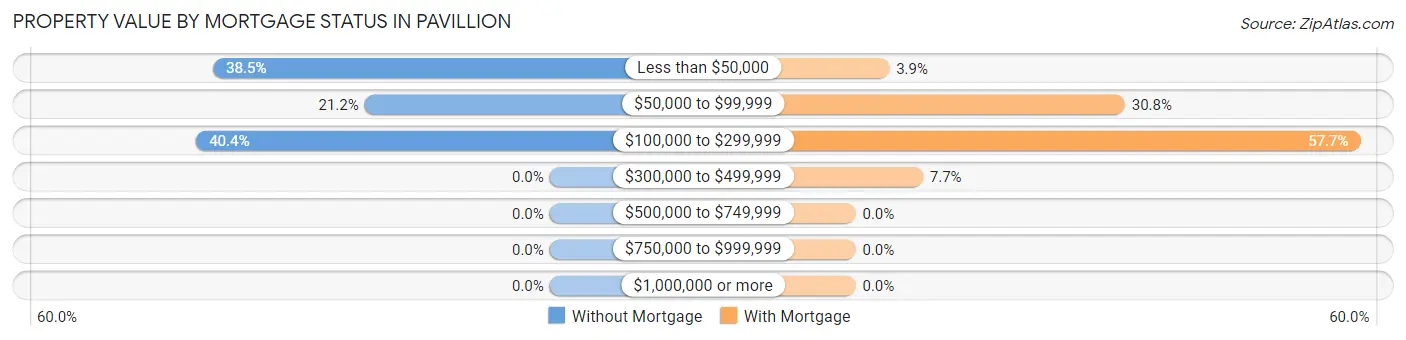
| Property Value | Without Mortgage | With Mortgage |
| Less than $50,000 | 20 (38.5%) | 1 (3.8%) |
| $50,000 to $99,999 | 11 (21.1%) | 8 (30.8%) |
| $100,000 to $299,999 | 21 (40.4%) | 15 (57.7%) |
| $300,000 to $499,999 | 0 (0.0%) | 2 (7.7%) |
| $500,000 to $749,999 | 0 (0.0%) | 0 (0.0%) |
| $750,000 to $999,999 | 0 (0.0%) | 0 (0.0%) |
| $1,000,000 or more | 0 (0.0%) | 0 (0.0%) |
| Total | 52 (100.0%) | 26 (100.0%) |
Household Income by Mortgage Status in Pavillion
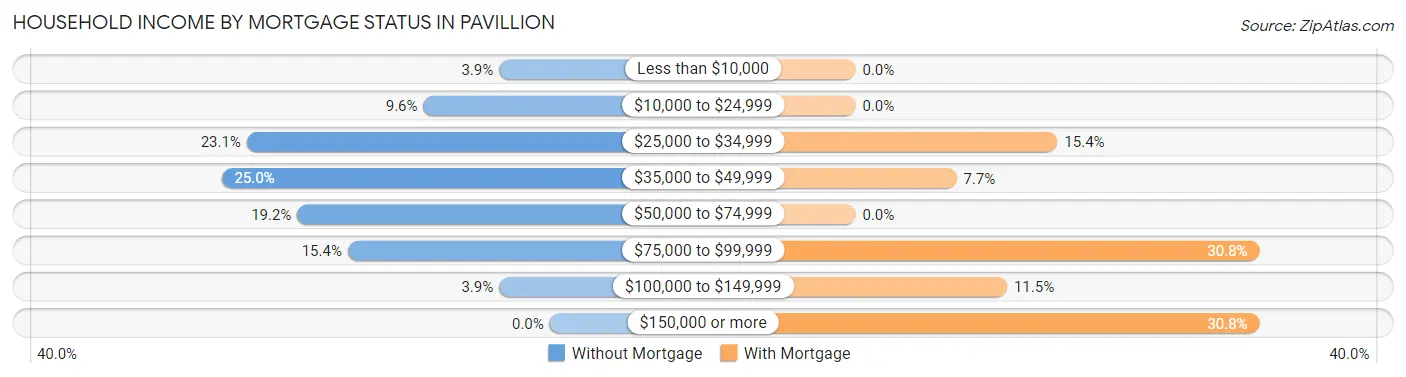
| Household Income | Without Mortgage | With Mortgage |
| Less than $10,000 | 2 (3.8%) | 0 (0.0%) |
| $10,000 to $24,999 | 5 (9.6%) | 0 (0.0%) |
| $25,000 to $34,999 | 12 (23.1%) | 4 (15.4%) |
| $35,000 to $49,999 | 13 (25.0%) | 2 (7.7%) |
| $50,000 to $74,999 | 10 (19.2%) | 0 (0.0%) |
| $75,000 to $99,999 | 8 (15.4%) | 8 (30.8%) |
| $100,000 to $149,999 | 2 (3.8%) | 3 (11.5%) |
| $150,000 or more | 0 (0.0%) | 8 (30.8%) |
| Total | 52 (100.0%) | 26 (100.0%) |
Property Value to Household Income Ratio in Pavillion
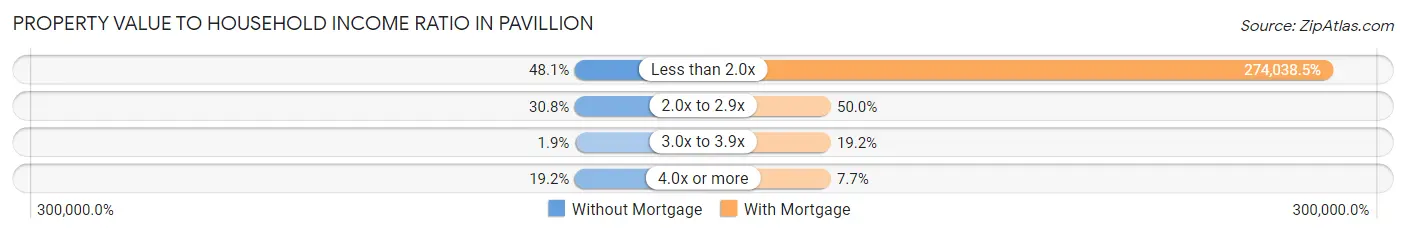
| Value-to-Income Ratio | Without Mortgage | With Mortgage |
| Less than 2.0x | 25 (48.1%) | 71,250 (274,038.5%) |
| 2.0x to 2.9x | 16 (30.8%) | 13 (50.0%) |
| 3.0x to 3.9x | 1 (1.9%) | 5 (19.2%) |
| 4.0x or more | 10 (19.2%) | 2 (7.7%) |
| Total | 52 (100.0%) | 26 (100.0%) |
Real Estate Taxes by Mortgage Status in Pavillion
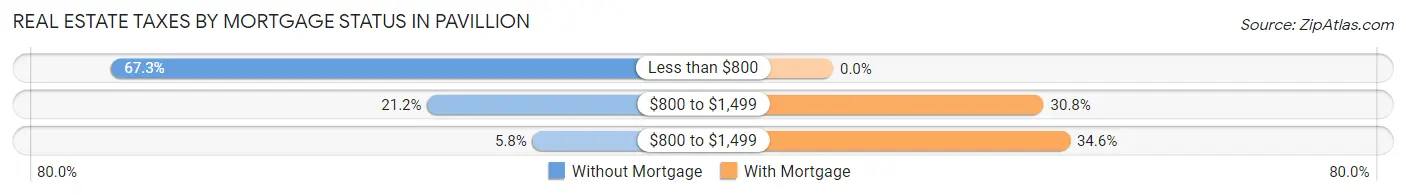
| Property Taxes | Without Mortgage | With Mortgage |
| Less than $800 | 35 (67.3%) | 0 (0.0%) |
| $800 to $1,499 | 11 (21.1%) | 8 (30.8%) |
| $800 to $1,499 | 3 (5.8%) | 9 (34.6%) |
| Total | 52 (100.0%) | 26 (100.0%) |
Health & Disability in Pavillion
Health Insurance Coverage by Age in Pavillion
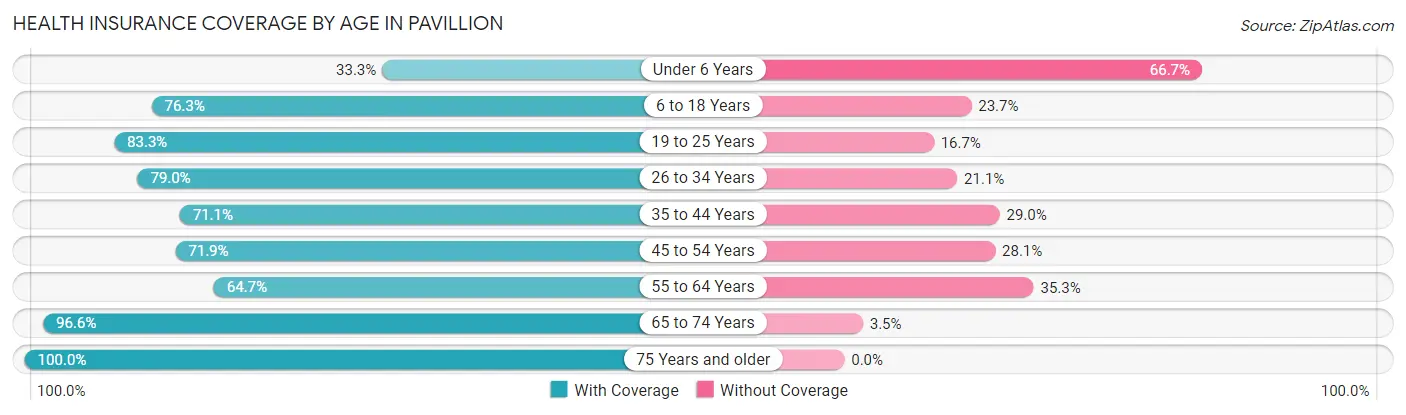
| Age Bracket | With Coverage | Without Coverage |
| Under 6 Years | 2 (33.3%) | 4 (66.7%) |
| 6 to 18 Years | 58 (76.3%) | 18 (23.7%) |
| 19 to 25 Years | 5 (83.3%) | 1 (16.7%) |
| 26 to 34 Years | 15 (78.9%) | 4 (21.0%) |
| 35 to 44 Years | 27 (71.1%) | 11 (28.9%) |
| 45 to 54 Years | 23 (71.9%) | 9 (28.1%) |
| 55 to 64 Years | 22 (64.7%) | 12 (35.3%) |
| 65 to 74 Years | 56 (96.6%) | 2 (3.5%) |
| 75 Years and older | 21 (100.0%) | 0 (0.0%) |
| Total | 229 (79.0%) | 61 (21.0%) |
Health Insurance Coverage by Citizenship Status in Pavillion
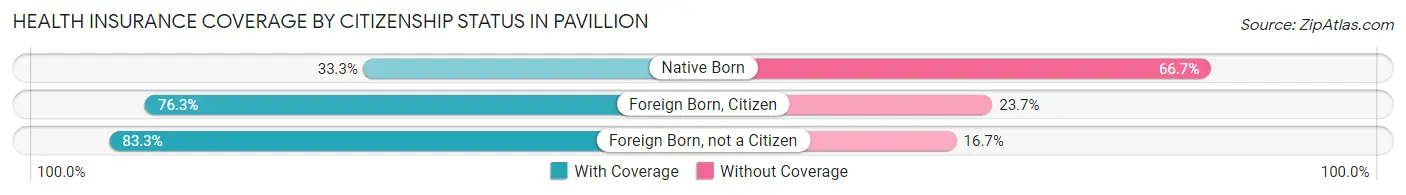
| Citizenship Status | With Coverage | Without Coverage |
| Native Born | 2 (33.3%) | 4 (66.7%) |
| Foreign Born, Citizen | 58 (76.3%) | 18 (23.7%) |
| Foreign Born, not a Citizen | 5 (83.3%) | 1 (16.7%) |
Health Insurance Coverage by Household Income in Pavillion
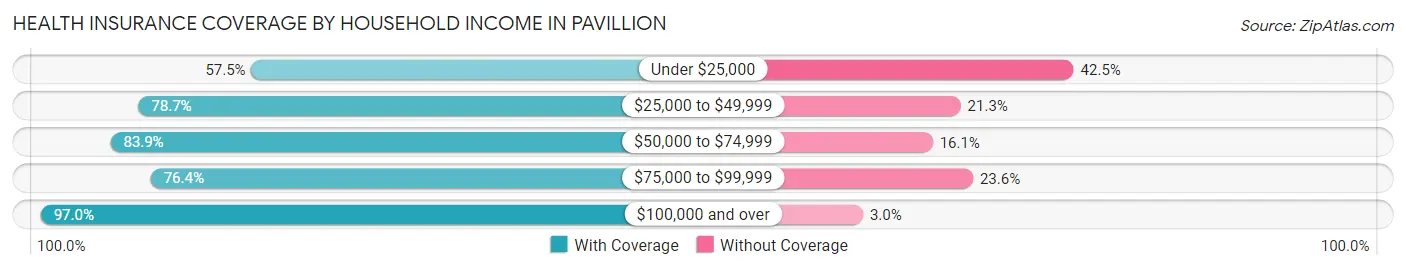
| Household Income | With Coverage | Without Coverage |
| Under $25,000 | 23 (57.5%) | 17 (42.5%) |
| $25,000 to $49,999 | 59 (78.7%) | 16 (21.3%) |
| $50,000 to $74,999 | 73 (83.9%) | 14 (16.1%) |
| $75,000 to $99,999 | 42 (76.4%) | 13 (23.6%) |
| $100,000 and over | 32 (97.0%) | 1 (3.0%) |
Public vs Private Health Insurance Coverage by Age in Pavillion
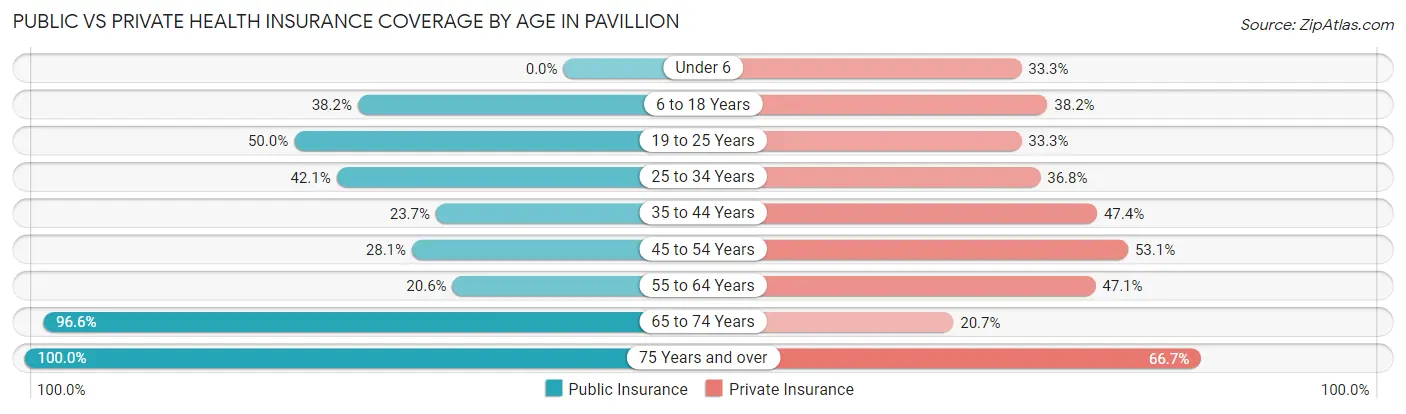
| Age Bracket | Public Insurance | Private Insurance |
| Under 6 | 0 (0.0%) | 2 (33.3%) |
| 6 to 18 Years | 29 (38.2%) | 29 (38.2%) |
| 19 to 25 Years | 3 (50.0%) | 2 (33.3%) |
| 25 to 34 Years | 8 (42.1%) | 7 (36.8%) |
| 35 to 44 Years | 9 (23.7%) | 18 (47.4%) |
| 45 to 54 Years | 9 (28.1%) | 17 (53.1%) |
| 55 to 64 Years | 7 (20.6%) | 16 (47.1%) |
| 65 to 74 Years | 56 (96.6%) | 12 (20.7%) |
| 75 Years and over | 21 (100.0%) | 14 (66.7%) |
| Total | 142 (49.0%) | 117 (40.3%) |
Disability Status by Sex by Age in Pavillion
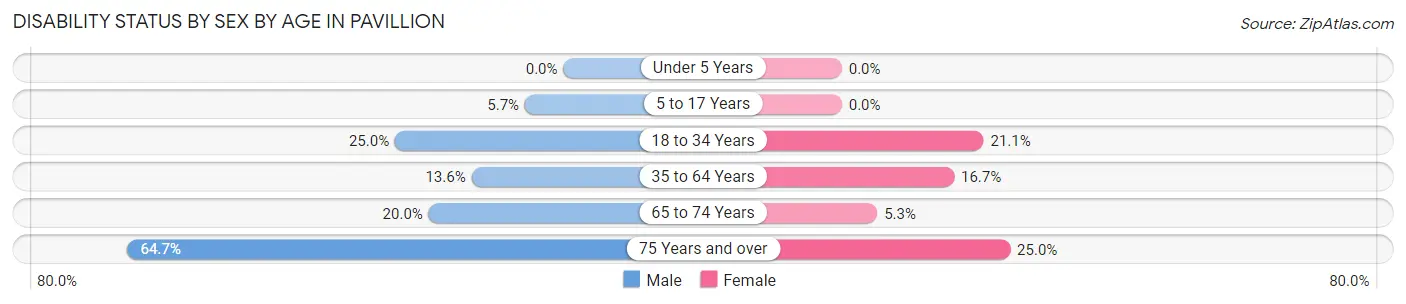
| Age Bracket | Male | Female |
| Under 5 Years | 0 (0.0%) | 0 (0.0%) |
| 5 to 17 Years | 2 (5.7%) | 0 (0.0%) |
| 18 to 34 Years | 4 (25.0%) | 4 (21.0%) |
| 35 to 64 Years | 6 (13.6%) | 10 (16.7%) |
| 65 to 74 Years | 4 (20.0%) | 2 (5.3%) |
| 75 Years and over | 11 (64.7%) | 1 (25.0%) |
Disability Class by Sex by Age in Pavillion
Disability Class: Hearing Difficulty
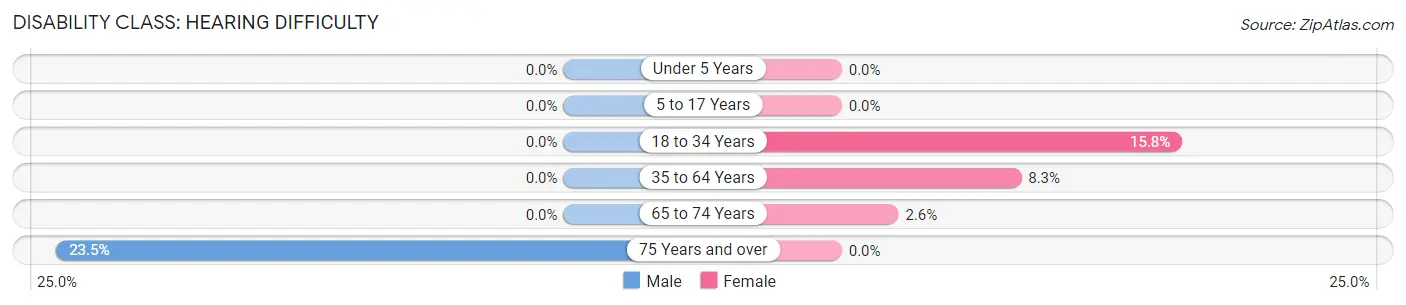
| Age Bracket | Male | Female |
| Under 5 Years | 0 (0.0%) | 0 (0.0%) |
| 5 to 17 Years | 0 (0.0%) | 0 (0.0%) |
| 18 to 34 Years | 0 (0.0%) | 3 (15.8%) |
| 35 to 64 Years | 0 (0.0%) | 5 (8.3%) |
| 65 to 74 Years | 0 (0.0%) | 1 (2.6%) |
| 75 Years and over | 4 (23.5%) | 0 (0.0%) |
Disability Class: Vision Difficulty
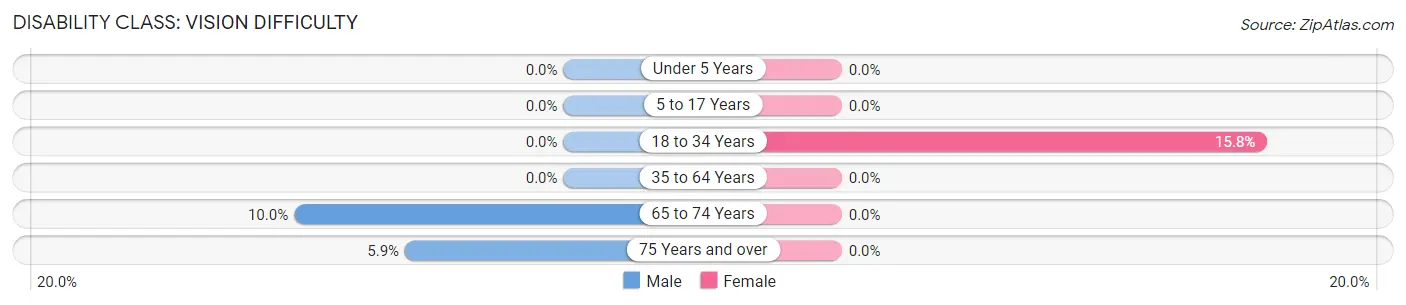
| Age Bracket | Male | Female |
| Under 5 Years | 0 (0.0%) | 0 (0.0%) |
| 5 to 17 Years | 0 (0.0%) | 0 (0.0%) |
| 18 to 34 Years | 0 (0.0%) | 3 (15.8%) |
| 35 to 64 Years | 0 (0.0%) | 0 (0.0%) |
| 65 to 74 Years | 2 (10.0%) | 0 (0.0%) |
| 75 Years and over | 1 (5.9%) | 0 (0.0%) |
Disability Class: Cognitive Difficulty
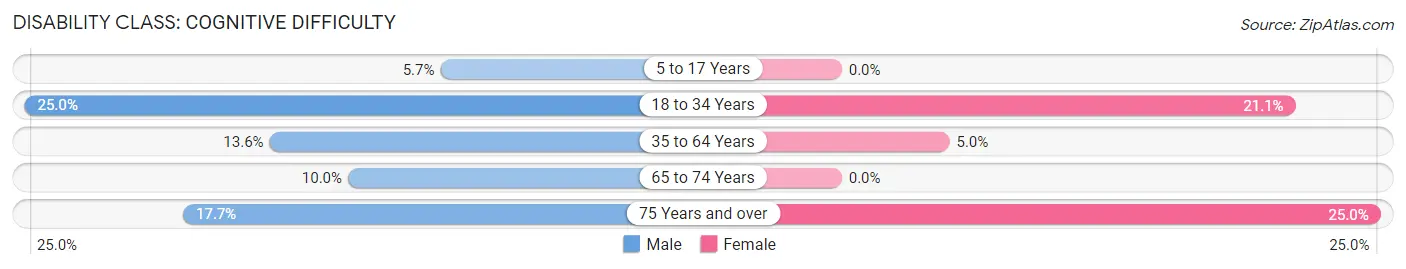
| Age Bracket | Male | Female |
| 5 to 17 Years | 2 (5.7%) | 0 (0.0%) |
| 18 to 34 Years | 4 (25.0%) | 4 (21.0%) |
| 35 to 64 Years | 6 (13.6%) | 3 (5.0%) |
| 65 to 74 Years | 2 (10.0%) | 0 (0.0%) |
| 75 Years and over | 3 (17.6%) | 1 (25.0%) |
Disability Class: Ambulatory Difficulty
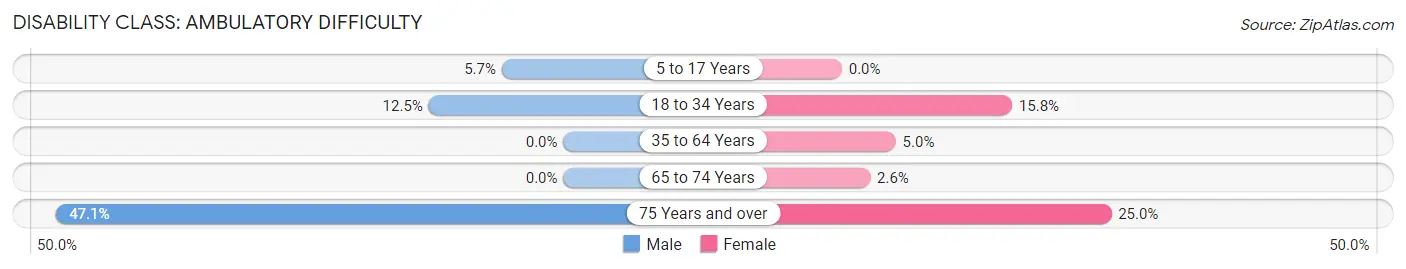
| Age Bracket | Male | Female |
| 5 to 17 Years | 2 (5.7%) | 0 (0.0%) |
| 18 to 34 Years | 2 (12.5%) | 3 (15.8%) |
| 35 to 64 Years | 0 (0.0%) | 3 (5.0%) |
| 65 to 74 Years | 0 (0.0%) | 1 (2.6%) |
| 75 Years and over | 8 (47.1%) | 1 (25.0%) |
Disability Class: Self-Care Difficulty
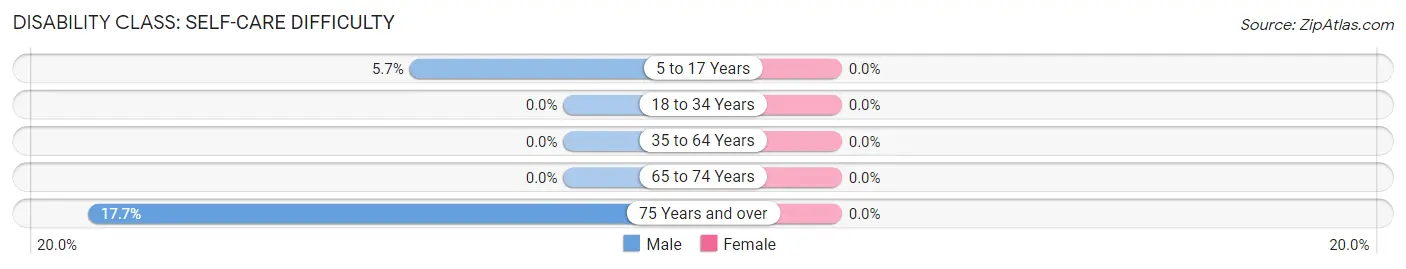
| Age Bracket | Male | Female |
| 5 to 17 Years | 2 (5.7%) | 0 (0.0%) |
| 18 to 34 Years | 0 (0.0%) | 0 (0.0%) |
| 35 to 64 Years | 0 (0.0%) | 0 (0.0%) |
| 65 to 74 Years | 0 (0.0%) | 0 (0.0%) |
| 75 Years and over | 3 (17.6%) | 0 (0.0%) |
Technology Access in Pavillion
Computing Device Access in Pavillion
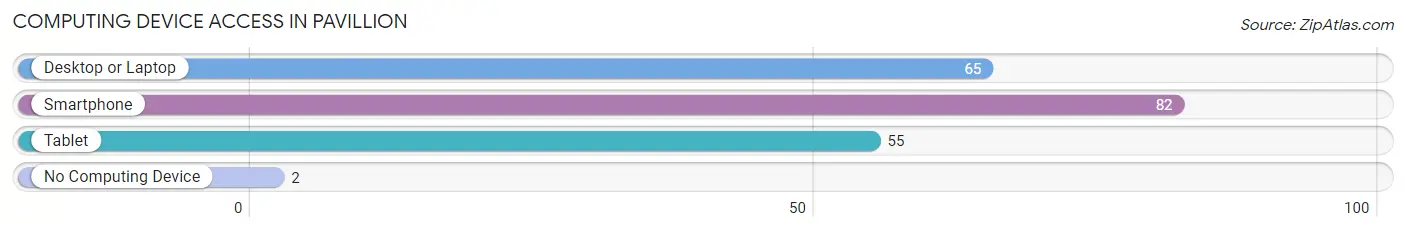
| Device Type | # Households | % Households |
| Desktop or Laptop | 65 | 67.7% |
| Smartphone | 82 | 85.4% |
| Tablet | 55 | 57.3% |
| No Computing Device | 2 | 2.1% |
| Total | 96 | 100.0% |
Internet Access in Pavillion
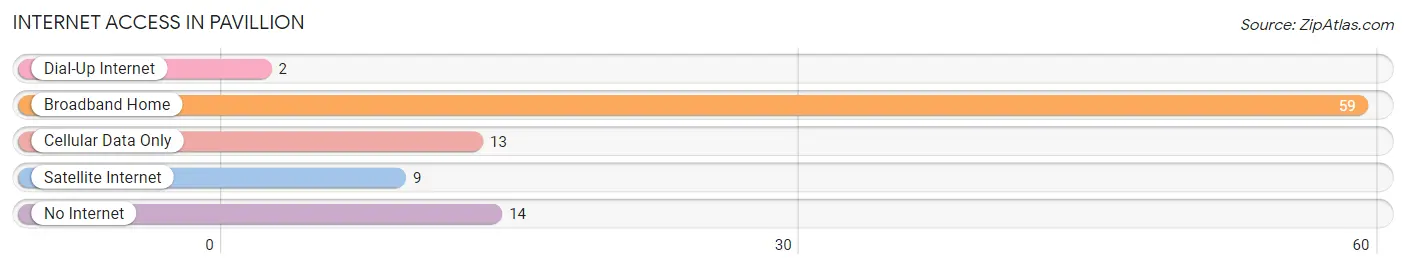
| Internet Type | # Households | % Households |
| Dial-Up Internet | 2 | 2.1% |
| Broadband Home | 59 | 61.5% |
| Cellular Data Only | 13 | 13.5% |
| Satellite Internet | 9 | 9.4% |
| No Internet | 14 | 14.6% |
| Total | 96 | 100.0% |
Pavillion Summary
Pavillion, Wyoming is a small unincorporated community located in Fremont County, Wyoming. It is situated in the Wind River Valley, approximately 30 miles east of Riverton and 40 miles south of Lander. The population of Pavillion was estimated to be around 200 people in 2020.
History
Pavillion was established in the late 1800s as a trading post for the Shoshone and Arapaho tribes. The town was named after the nearby Pavillion Butte, which was named by a French-Canadian fur trapper in the area. The town was officially incorporated in 1909.
In the early 1900s, Pavillion was a thriving agricultural community, with many farmers growing wheat, barley, and hay. The town also had a few small businesses, including a general store, a blacksmith shop, and a saloon.
In the 1950s, the town began to decline as the agricultural industry shifted away from the area. The population decreased and many of the businesses closed.
In the late 1970s, the town experienced a resurgence when the nearby Wind River Indian Reservation was established. The reservation brought new jobs and economic opportunities to the area, and the population began to grow again.
Geography
Pavillion is located in the Wind River Valley, which is part of the Great Basin Desert. The town is situated at an elevation of 5,400 feet, and the surrounding area is mostly flat and covered in sagebrush.
The town is located near the Wind River, which is a tributary of the Green River. The Wind River is a popular destination for fishing, boating, and other recreational activities.
The climate in Pavillion is semi-arid, with hot summers and cold winters. The average annual temperature is around 50 degrees Fahrenheit, and the average annual precipitation is around 10 inches.
Economy
The economy of Pavillion is largely based on agriculture and tourism. The town is home to several farms, which grow hay, wheat, and other crops. The nearby Wind River Indian Reservation also provides jobs and economic opportunities for the town.
Tourism is also an important part of the local economy. The Wind River is a popular destination for fishing, boating, and other recreational activities. The nearby Wind River Canyon is also a popular destination for hikers and campers.
Demographics
As of the 2020 census, the population of Pavillion was estimated to be around 200 people. The racial makeup of the town was 95.5% White, 0.5% Native American, 0.5% Asian, and 3.5% other. The median household income was $37,500, and the median home value was $125,000.
Conclusion
Pavillion, Wyoming is a small unincorporated community located in Fremont County, Wyoming. It is situated in the Wind River Valley, and the population was estimated to be around 200 people in 2020. The economy of Pavillion is largely based on agriculture and tourism, and the town is home to several farms and is a popular destination for fishing, boating, and other recreational activities. The racial makeup of the town was 95.5% White, 0.5% Native American, 0.5% Asian, and 3.5% other. The median household income was $37,500, and the median home value was $125,000.
Common Questions
What is Per Capita Income in Pavillion?
Per Capita income in Pavillion is $19,637.
What is the Median Family Income in Pavillion?
Median Family Income in Pavillion is $55,000.
What is the Median Household income in Pavillion?
Median Household Income in Pavillion is $50,000.
What is Income or Wage Gap in Pavillion?
Income or Wage Gap in Pavillion is 30.8%.
Women in Pavillion earn 69.2 cents for every dollar earned by a man.
What is Inequality or Gini Index in Pavillion?
Inequality or Gini Index in Pavillion is 0.34.
What is the Total Population of Pavillion?
Total Population of Pavillion is 290.
What is the Total Male Population of Pavillion?
Total Male Population of Pavillion is 133.
What is the Total Female Population of Pavillion?
Total Female Population of Pavillion is 157.
What is the Ratio of Males per 100 Females in Pavillion?
There are 84.71 Males per 100 Females in Pavillion.
What is the Ratio of Females per 100 Males in Pavillion?
There are 118.05 Females per 100 Males in Pavillion.
What is the Median Population Age in Pavillion?
Median Population Age in Pavillion is 45.0 Years.
What is the Average Family Size in Pavillion
Average Family Size in Pavillion is 3.6 People.
What is the Average Household Size in Pavillion
Average Household Size in Pavillion is 3.0 People.
How Large is the Labor Force in Pavillion?
There are 116 People in the Labor Forcein in Pavillion.
What is the Percentage of People in the Labor Force in Pavillion?
48.7% of People are in the Labor Force in Pavillion.
What is the Unemployment Rate in Pavillion?
Unemployment Rate in Pavillion is 4.3%.