Zip Codes with the Highest Percentage of Population with a Degree in Literature and Languages in Kirkland, WA

RELATED REPORTS & OPTIONS

Literature and Languages
Population
Families and Households
Female Fertility
Female Fertility (Unmarried)
Race (Community Size)
Race (Percentage)
Ancestry (Community Size)
AfricanAleutAmericanArabArgentineanArmenianAustralianAustrianBasqueBelgianBhutaneseBlackfeetBrazilianBritishBulgarianBurmeseCanadianCentral AmericanCherokeeChileanColombianCroatianCubanCzechCzechoslovakianDanishDutchEastern EuropeanEcuadorianEgyptianEnglishEstonianEthiopianEuropeanFilipinoFinnishFrenchFrench CanadianGermanGreekGuamanian / ChamorroGuatemalanHonduranHungarianIcelanderIndian (Asian)IranianIrishIroquoisIsraeliItalianJapaneseKoreanLaotianLebaneseLithuanianMalaysianMexicanMexican American IndianNative HawaiianNigerianNorthern EuropeanNorwegianPakistaniPalestinianPeruvianPolishPortuguesePuerto RicanPuget Sound SalishRomanianRussianSalvadoranSamoanScandinavianScotch-IrishScottishSerbianSlavicSlovakSouth AfricanSouth AmericanSpaniardSpanishSri LankanSubsaharan AfricanSwedishSwissThaiTurkishUkrainianWelshYaquiYugoslavian
Ancestry (Percentage)
AfricanAleutAmericanArabArgentineanArmenianAustralianAustrianBasqueBelgianBhutaneseBlackfeetBrazilianBritishBulgarianBurmeseCanadianCentral AmericanCherokeeChileanColombianCroatianCubanCzechCzechoslovakianDanishDutchEastern EuropeanEcuadorianEgyptianEnglishEstonianEthiopianEuropeanFilipinoFinnishFrenchFrench CanadianGermanGreekGuamanian / ChamorroGuatemalanHonduranHungarianIcelanderIndian (Asian)IranianIrishIroquoisIsraeliItalianJapaneseKoreanLaotianLebaneseLithuanianMalaysianMexicanMexican American IndianNative HawaiianNigerianNorthern EuropeanNorwegianPakistaniPalestinianPeruvianPolishPortuguesePuerto RicanPuget Sound SalishRomanianRussianSalvadoranSamoanScandinavianScotch-IrishScottishSerbianSlavicSlovakSouth AfricanSouth AmericanSpaniardSpanishSri LankanSubsaharan AfricanSwedishSwissThaiTurkishUkrainianWelshYaquiYugoslavian
Immigrant Origin (Total)
Immigrant Origin (Percentage)
Income
Income (Families)
Income (Households)
Poverty
Poverty (Families)
Unemployment
Employment Occupations
Employment Industries
Employer Class
Commute Time
Commute Means
School Enrollment
Education by Degree Field
Occupancy
Finances
Physical Characteristics
Kirkland
Compare Zip Codes
Comparison Subject

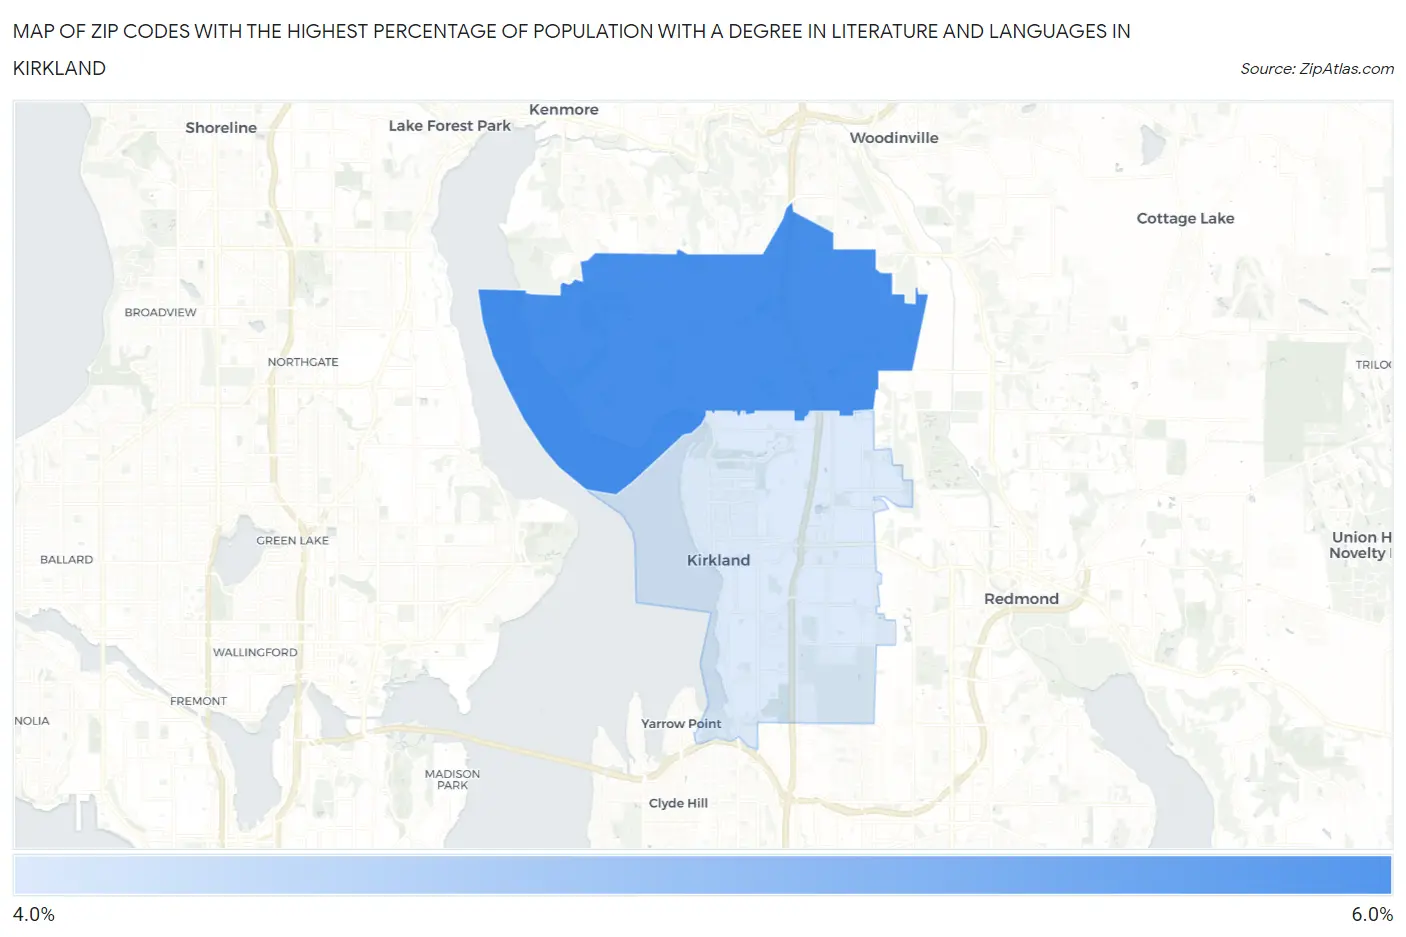
Map of Zip Codes with the Highest Percentage of Population with a Degree in Literature and Languages in Kirkland

0.0%
6.0%
Zip Codes with the Highest Percentage of Population with a Degree in Literature and Languages in Kirkland Map

Zip Codes with the Highest Percentage of Population with a Degree in Literature and Languages in Kirkland, WA

Zip Code % Graduates vs State vs National
1.980345.6%5.3%(+0.279)#1704.4%(+1.15)#6,201
2.980334.4%5.3%(-0.928)#2424.4%(-0.055)#9,133

Common Questions

What are the Top Zip Codes with the Highest Percentage of Population with a Degree in Literature and Languages in Kirkland, WA?
Top Zip Codes with the Highest Percentage of Population with a Degree in Literature and Languages in Kirkland, WA are:
#1
5.6%
#2
4.4%
What zip code has the Highest Percentage of Population with a Degree in Literature and Languages in Kirkland, WA?
98034 has the Highest Percentage of Population with a Degree in Literature and Languages in Kirkland, WA with 5.6%.
What is the Percentage of Population with a Degree in Literature and Languages in Kirkland, WA?
Percentage of Population with a Degree in Literature and Languages in Kirkland is 5.0%.
What is the Percentage of Population with a Degree in Literature and Languages in Washington?
Percentage of Population with a Degree in Literature and Languages in Washington is 5.3%.
What is the Percentage of Population with a Degree in Literature and Languages in the United States?
Percentage of Population with a Degree in Literature and Languages in the United States is 4.4%.