Zip Codes with the Highest Percentage of Population Employed in Arts, Media & Entertainment in Spokane, WA

RELATED REPORTS & OPTIONS

Arts, Media & Entertainment
Population
Families and Households
Female Fertility
Female Fertility (Unmarried)
Race (Community Size)
Race (Percentage)
Ancestry (Community Size)
AfricanAlaska NativeAlaskan AthabascanAlbanianAleutAmericanApacheArabArgentineanArmenianAustralianAustrianBangladeshiBasqueBelgianBhutaneseBlackfeetBrazilianBritishBulgarianBurmeseCambodianCanadianCape VerdeanCelticCentral AmericanCentral American IndianCherokeeCheyenneChickasawChippewaChoctawColombianColvilleCosta RicanCreeCreekCroatianCrowCubanCzechCzechoslovakianDanishDominicanDutchDutch West IndianEastern EuropeanEcuadorianEgyptianEnglishEstonianEthiopianEuropeanFijianFilipinoFinnishFrenchFrench American IndianFrench CanadianGermanGerman RussianGreekGuamanian / ChamorroGuatemalanHaitianHonduranHungarianIcelanderIndian (Asian)IndonesianInupiatIranianIraqiIrishIroquoisItalianJamaicanJapaneseKenyanKoreanLaotianLatvianLebaneseLithuanianLuxembourgerMacedonianMalaysianMalteseMarshalleseMexicanMexican American IndianNative HawaiianNavajoNepaleseNicaraguanNigerianNorthern EuropeanNorwegianOsagePakistaniPalestinianPanamanianPennsylvania GermanPeruvianPolishPortuguesePotawatomiPuebloPuerto RicanPuget Sound SalishRomanianRussianSalvadoranSamoanScandinavianScotch-IrishScottishSerbianSiouxSlavicSlovakSloveneSouth AfricanSouth AmericanSouth American IndianSpaniardSpanishSri LankanSubsaharan AfricanSudaneseSwedishSwissSyrianThaiTlingit-HaidaTonganTurkishUgandanUkrainianVenezuelanWelshWest IndianYakamaYaquiYugoslavianYup'ik
Ancestry (Percentage)
AfricanAlaska NativeAlaskan AthabascanAlbanianAleutAmericanApacheArabArgentineanArmenianAustralianAustrianBangladeshiBasqueBelgianBhutaneseBlackfeetBrazilianBritishBulgarianBurmeseCambodianCanadianCape VerdeanCelticCentral AmericanCentral American IndianCherokeeCheyenneChickasawChippewaChoctawColombianColvilleCosta RicanCreeCreekCroatianCrowCubanCzechCzechoslovakianDanishDominicanDutchDutch West IndianEastern EuropeanEcuadorianEgyptianEnglishEstonianEthiopianEuropeanFijianFilipinoFinnishFrenchFrench American IndianFrench CanadianGermanGerman RussianGreekGuamanian / ChamorroGuatemalanHaitianHonduranHungarianIcelanderIndian (Asian)IndonesianInupiatIranianIraqiIrishIroquoisItalianJamaicanJapaneseKenyanKoreanLaotianLatvianLebaneseLithuanianLuxembourgerMacedonianMalaysianMalteseMarshalleseMexicanMexican American IndianNative HawaiianNavajoNepaleseNicaraguanNigerianNorthern EuropeanNorwegianOsagePakistaniPalestinianPanamanianPennsylvania GermanPeruvianPolishPortuguesePotawatomiPuebloPuerto RicanPuget Sound SalishRomanianRussianSalvadoranSamoanScandinavianScotch-IrishScottishSerbianSiouxSlavicSlovakSloveneSouth AfricanSouth AmericanSouth American IndianSpaniardSpanishSri LankanSubsaharan AfricanSudaneseSwedishSwissSyrianThaiTlingit-HaidaTonganTurkishUgandanUkrainianVenezuelanWelshWest IndianYakamaYaquiYugoslavianYup'ik
Immigrant Origin (Total)
AfghanistanAfricaAlbaniaArgentinaAsiaAustraliaAustriaBelarusBosnia and HerzegovinaBrazilBurma / MyanmarCambodiaCanadaCaribbeanCentral AmericaChinaColombiaCroatiaCubaCzechoslovakiaDenmarkDominican RepublicEastern AfricaEastern AsiaEastern EuropeEcuadorEgyptEl SalvadorEnglandEritreaEthiopiaEuropeFranceGermanyGhanaGuatemalaHong KongHungaryIndiaIndonesiaIranIraqIrelandItalyJamaicaJapanKazakhstanKenyaKoreaLaosLatin AmericaMalaysiaMexicoMicronesiaMiddle AfricaMoldovaNepalNetherlandsNigeriaNorthern AfricaNorthern EuropeNorwayOceaniaPakistanPanamaPeruPhilippinesPolandRomaniaRussiaSaudi ArabiaScotlandSouth AfricaSouth AmericaSouth Central AsiaSouth Eastern AsiaSouthern EuropeSpainSudanSwedenSyriaTaiwanThailandTrinidad and TobagoUgandaUkraineVenezuelaVietnamWestern AfricaWestern AsiaWestern EuropeZaire
Immigrant Origin (Percentage)
AfghanistanAfricaAlbaniaArgentinaAsiaAustraliaAustriaBelarusBosnia and HerzegovinaBrazilBurma / MyanmarCambodiaCanadaCaribbeanCentral AmericaChinaColombiaCroatiaCubaCzechoslovakiaDenmarkDominican RepublicEastern AfricaEastern AsiaEastern EuropeEcuadorEgyptEl SalvadorEnglandEritreaEthiopiaEuropeFranceGermanyGhanaGuatemalaHong KongHungaryIndiaIndonesiaIranIraqIrelandItalyJamaicaJapanKazakhstanKenyaKoreaLaosLatin AmericaMalaysiaMexicoMicronesiaMiddle AfricaMoldovaNepalNetherlandsNigeriaNorthern AfricaNorthern EuropeNorwayOceaniaPakistanPanamaPeruPhilippinesPolandRomaniaRussiaSaudi ArabiaScotlandSouth AfricaSouth AmericaSouth Central AsiaSouth Eastern AsiaSouthern EuropeSpainSudanSwedenSyriaTaiwanThailandTrinidad and TobagoUgandaUkraineVenezuelaVietnamWestern AfricaWestern AsiaWestern EuropeZaire
Income
Income (Families)
Income (Households)
Poverty
Poverty (Families)
Unemployment
Employment Occupations
Employment Industries
Employer Class
Commute Time
Commute Means
School Enrollment
Education by Degree Field
Occupancy
Finances
Physical Characteristics
Spokane
Compare Zip Codes
Comparison Subject

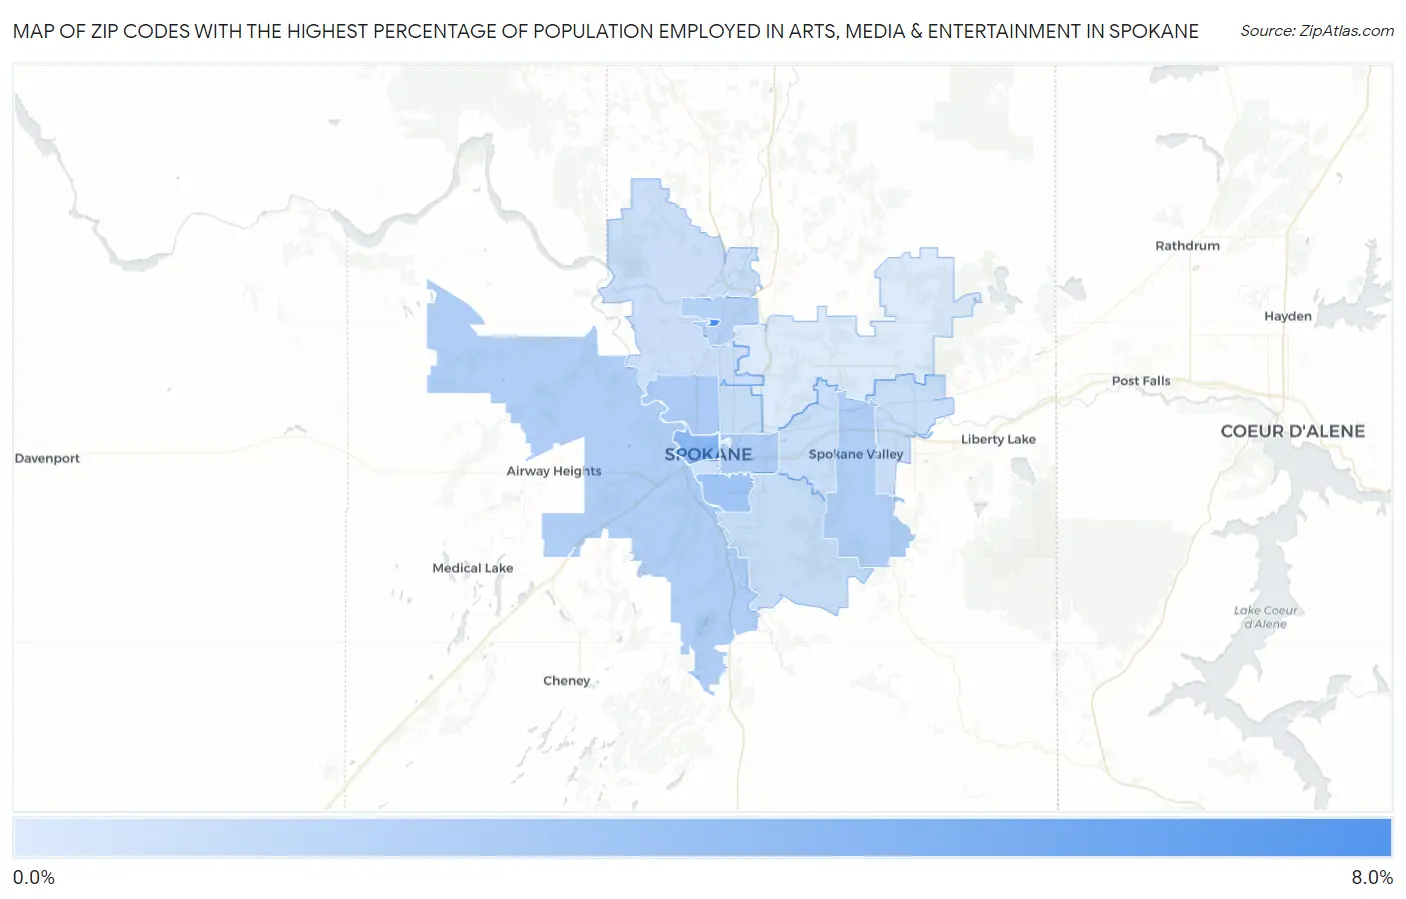
Map of Zip Codes with the Highest Percentage of Population Employed in Arts, Media & Entertainment in Spokane

0.0%
8.0%
Zip Codes with the Highest Percentage of Population Employed in Arts, Media & Entertainment in Spokane Map

Zip Codes with the Highest Percentage of Population Employed in Arts, Media & Entertainment in Spokane, WA

Zip Code % Employed vs State vs National
1.992516.2%2.1%(+4.11)#212.1%(+4.13)#978
2.992013.6%2.1%(+1.55)#612.1%(+1.57)#2,860
3.992032.9%2.1%(+0.771)#1022.1%(+0.793)#4,465
4.992052.4%2.1%(+0.354)#1292.1%(+0.376)#5,799
5.992022.3%2.1%(+0.263)#1402.1%(+0.285)#6,162
6.992242.3%2.1%(+0.180)#1492.1%(+0.202)#6,541
7.992062.2%2.1%(+0.144)#1552.1%(+0.166)#6,697
8.992182.0%2.1%(-0.038)#1762.1%(-0.016)#7,572
9.992231.5%2.1%(-0.631)#2692.1%(-0.609)#11,339
10.992071.4%2.1%(-0.634)#2702.1%(-0.612)#11,358
11.992121.3%2.1%(-0.757)#2892.1%(-0.735)#12,266
12.992161.3%2.1%(-0.769)#2932.1%(-0.747)#12,349
13.992081.3%2.1%(-0.825)#3052.1%(-0.803)#12,788
14.992041.2%2.1%(-0.884)#3112.1%(-0.862)#13,239
15.992170.56%2.1%(-1.52)#3822.1%(-1.50)#18,340

Common Questions

What are the Top 10 Zip Codes with the Highest Percentage of Population Employed in Arts, Media & Entertainment in Spokane, WA?
Top 10 Zip Codes with the Highest Percentage of Population Employed in Arts, Media & Entertainment in Spokane, WA are:
#1
6.2%
#2
3.6%
#3
2.9%
#4
2.4%
#5
2.3%
#6
2.3%
#7
2.2%
#8
2.0%
#9
1.5%
#10
1.4%
What zip code has the Highest Percentage of Population Employed in Arts, Media & Entertainment in Spokane, WA?
99251 has the Highest Percentage of Population Employed in Arts, Media & Entertainment in Spokane, WA with 6.2%.
What is the Percentage of Population Employed in Arts, Media & Entertainment in Spokane, WA?
Percentage of Population Employed in Arts, Media & Entertainment in Spokane is 2.0%.
What is the Percentage of Population Employed in Arts, Media & Entertainment in Washington?
Percentage of Population Employed in Arts, Media & Entertainment in Washington is 2.1%.
What is the Percentage of Population Employed in Arts, Media & Entertainment in the United States?
Percentage of Population Employed in Arts, Media & Entertainment in the United States is 2.1%.