Zip Codes with the Highest Percentage of Population Employed in Arts, Media & Entertainment in Lynnwood, WA
RELATED REPORTS & OPTIONS
Arts, Media & Entertainment
Lynnwood
Compare Zip Codes
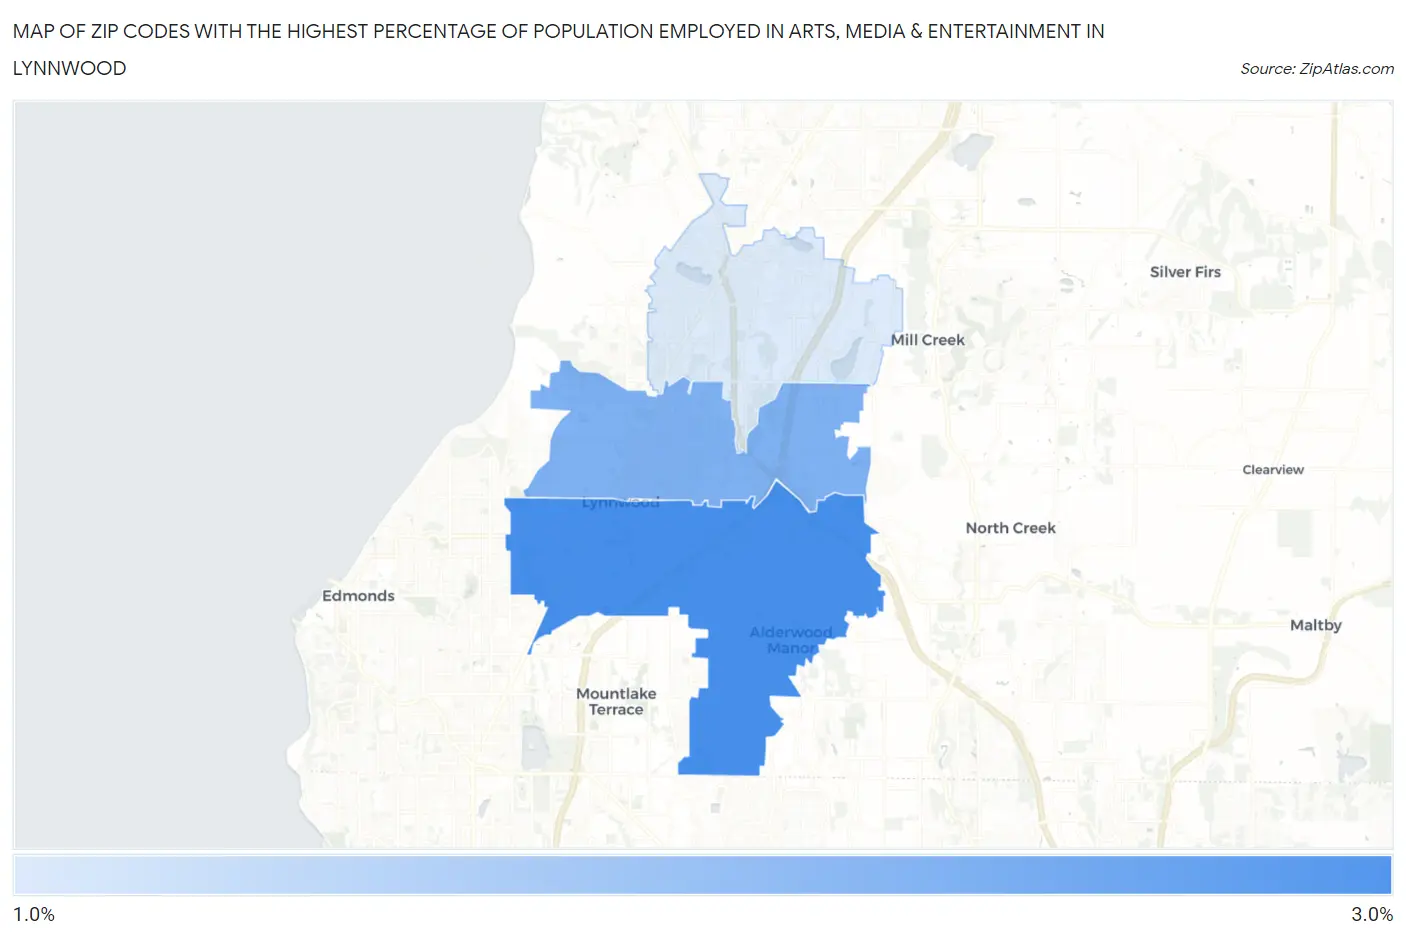
Map of Zip Codes with the Highest Percentage of Population Employed in Arts, Media & Entertainment in Lynnwood
1.4%
2.8%
Zip Codes with the Highest Percentage of Population Employed in Arts, Media & Entertainment in Lynnwood, WA
| Zip Code | % Employed | vs State | vs National | |
| 1. | 98036 | 2.8% | 2.1%(+0.690)#106 | 2.1%(+0.712)#4,690 |
| 2. | 98037 | 2.2% | 2.1%(+0.156)#152 | 2.1%(+0.178)#6,653 |
| 3. | 98087 | 1.4% | 2.1%(-0.721)#281 | 2.1%(-0.699)#11,983 |
1
Common Questions
What are the Top Zip Codes with the Highest Percentage of Population Employed in Arts, Media & Entertainment in Lynnwood, WA?
Top Zip Codes with the Highest Percentage of Population Employed in Arts, Media & Entertainment in Lynnwood, WA are:
What zip code has the Highest Percentage of Population Employed in Arts, Media & Entertainment in Lynnwood, WA?
98036 has the Highest Percentage of Population Employed in Arts, Media & Entertainment in Lynnwood, WA with 2.8%.
What is the Percentage of Population Employed in Arts, Media & Entertainment in Lynnwood, WA?
Percentage of Population Employed in Arts, Media & Entertainment in Lynnwood is 2.5%.
What is the Percentage of Population Employed in Arts, Media & Entertainment in Washington?
Percentage of Population Employed in Arts, Media & Entertainment in Washington is 2.1%.
What is the Percentage of Population Employed in Arts, Media & Entertainment in the United States?
Percentage of Population Employed in Arts, Media & Entertainment in the United States is 2.1%.