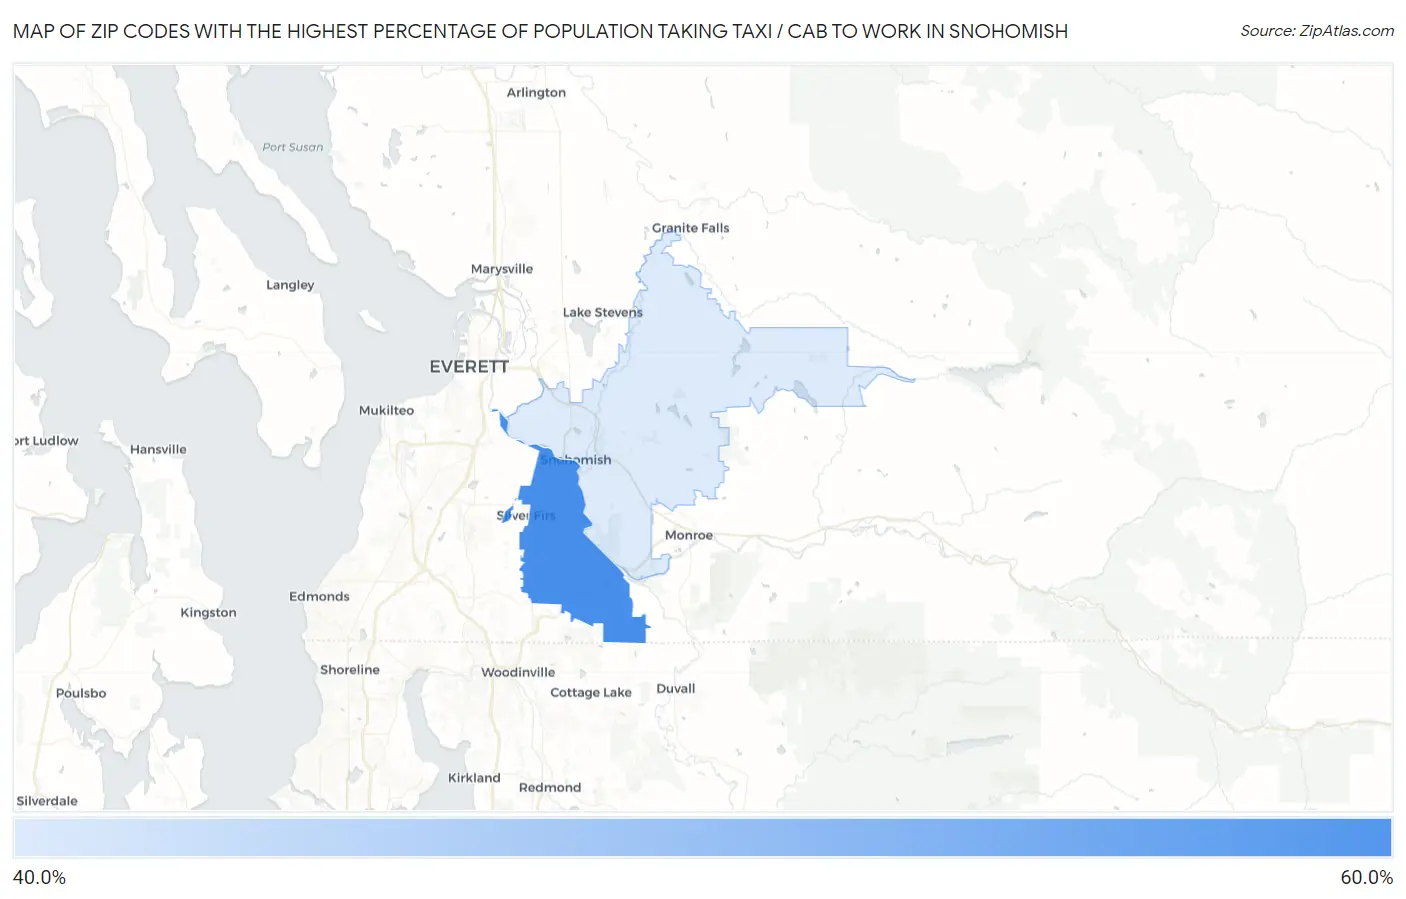
Zip Codes with the Highest Percentage of Population Taking Taxi / Cab to Work in Snohomish, WA
RELATED REPORTS & OPTIONS
Taxi / Cab
Snohomish
Compare Zip Codes
Map of Zip Codes with the Highest Percentage of Population Taking Taxi / Cab to Work in Snohomish
49.9%
58.5%
Zip Codes with the Highest Percentage of Population Taking Taxi / Cab to Work in Snohomish, WA
| Zip Code | % Take Taxi / Cab | vs State | vs National | |
| 1. | 98296 | 58.5% | 38.8%(+19.7)#20 | 38.2%(+20.3)#899 |
| 2. | 98290 | 49.9% | 38.8%(+11.1)#75 | 38.2%(+11.7)#2,989 |
1
Common Questions
What are the Top Zip Codes with the Highest Percentage of Population Taking Taxi / Cab to Work in Snohomish, WA?
Top Zip Codes with the Highest Percentage of Population Taking Taxi / Cab to Work in Snohomish, WA are:
What zip code has the Highest Percentage of Population Taking Taxi / Cab to Work in Snohomish, WA?
98296 has the Highest Percentage of Population Taking Taxi / Cab to Work in Snohomish, WA with 58.5%.
What is the Percentage of Population Taking Taxi / Cab to Work in Snohomish, WA?
Percentage of Population Taking Taxi / Cab to Work in Snohomish is 53.5%.
What is the Percentage of Population Taking Taxi / Cab to Work in Washington?
Percentage of Population Taking Taxi / Cab to Work in Washington is 38.8%.
What is the Percentage of Population Taking Taxi / Cab to Work in the United States?
Percentage of Population Taking Taxi / Cab to Work in the United States is 38.2%.