Zip Codes with the Highest Percentage of Self-Employed / Not Incorporated in Snohomish, WA
RELATED REPORTS & OPTIONS
Self-Employed / Not Incorporated
Snohomish
Compare Zip Codes
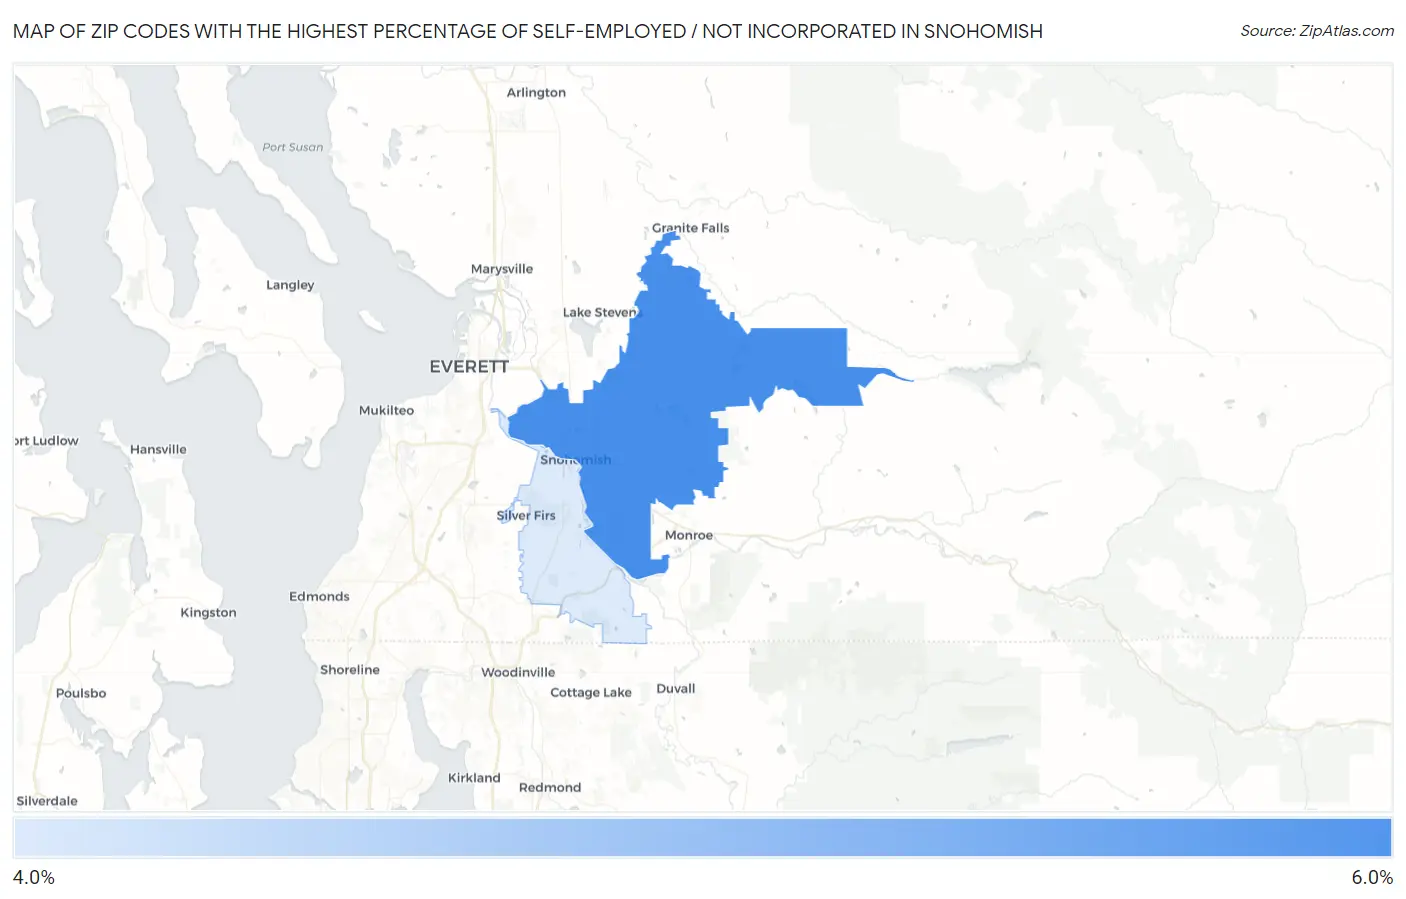
Map of Zip Codes with the Highest Percentage of Self-Employed / Not Incorporated in Snohomish
0.0%
6.0%
Zip Codes with the Highest Percentage of Self-Employed / Not Incorporated in Snohomish, WA
| Zip Code | % Self-Employed / Not Incorporated | vs State | vs National | |
| 1. | 98290 | 5.4% | 5.4%(-0.036)#295 | 5.8%(-0.414)#18,119 |
| 2. | 98296 | 4.3% | 5.4%(-1.17)#401 | 5.8%(-1.55)#22,444 |
1
Common Questions
What are the Top Zip Codes with the Highest Percentage of Self-Employed / Not Incorporated in Snohomish, WA?
Top Zip Codes with the Highest Percentage of Self-Employed / Not Incorporated in Snohomish, WA are:
What zip code has the Highest Percentage of Self-Employed / Not Incorporated in Snohomish, WA?
98290 has the Highest Percentage of Self-Employed / Not Incorporated in Snohomish, WA with 5.4%.
What is the Percentage of Self-Employed / Not Incorporated in Snohomish, WA?
Percentage of Self-Employed / Not Incorporated in Snohomish is 4.3%.
What is the Percentage of Self-Employed / Not Incorporated in Washington?
Percentage of Self-Employed / Not Incorporated in Washington is 5.4%.
What is the Percentage of Self-Employed / Not Incorporated in the United States?
Percentage of Self-Employed / Not Incorporated in the United States is 5.8%.