Zip Codes with the Highest Percentage of Population Employed in Administrative & Support Services in Snohomish, WA
RELATED REPORTS & OPTIONS
Administrative & Support Services
Snohomish
Compare Zip Codes
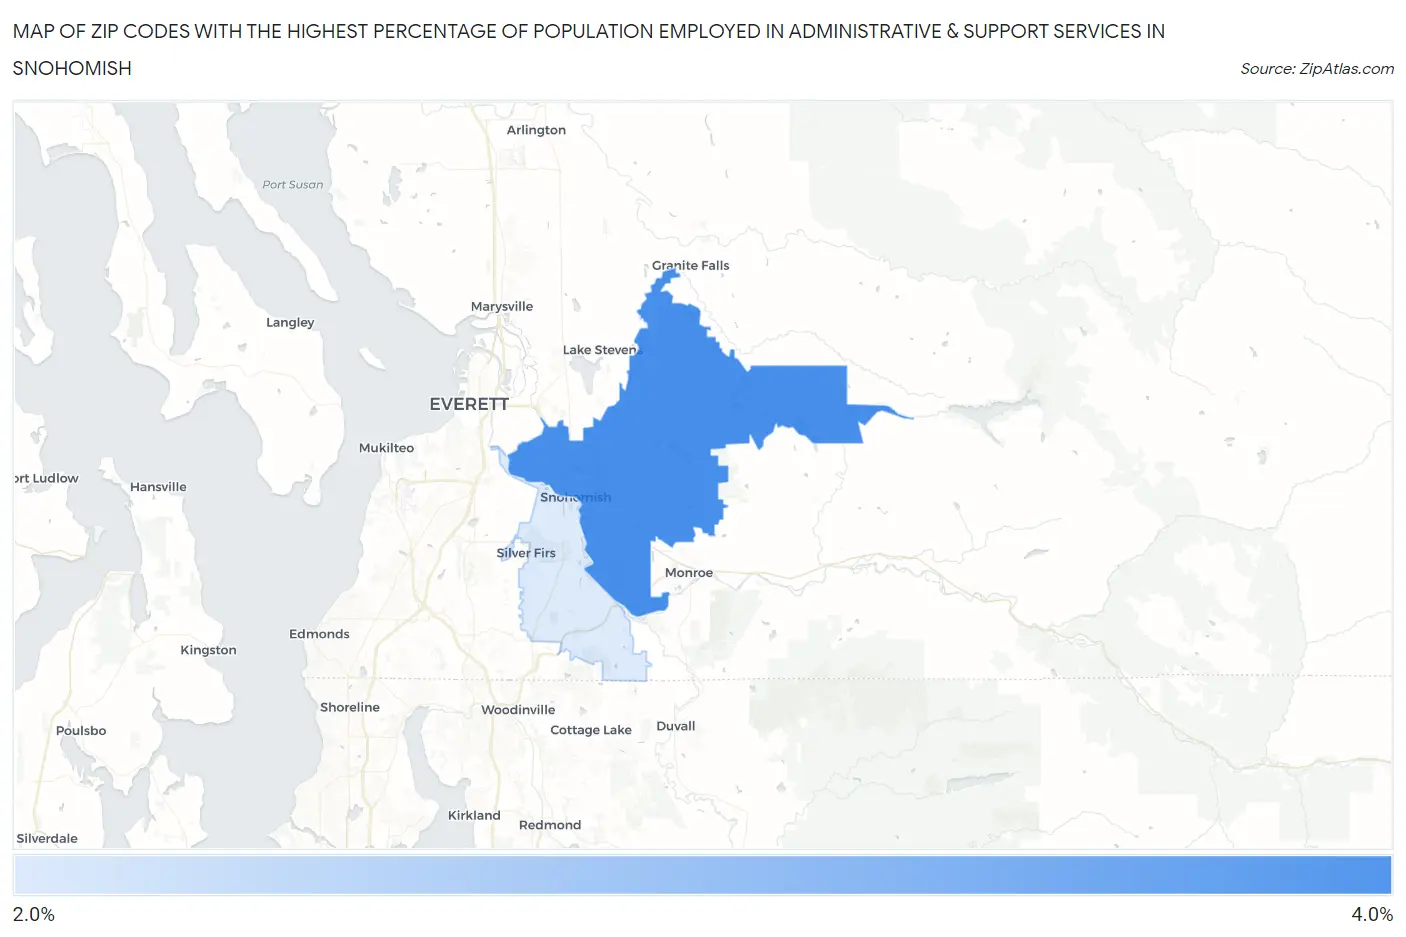
Map of Zip Codes with the Highest Percentage of Population Employed in Administrative & Support Services in Snohomish
2.7%
3.6%
Zip Codes with the Highest Percentage of Population Employed in Administrative & Support Services in Snohomish, WA
| Zip Code | % Employed | vs State | vs National | |
| 1. | 98290 | 3.6% | 3.8%(-0.124)#231 | 4.1%(-0.508)#12,277 |
| 2. | 98296 | 2.7% | 3.8%(-1.08)#346 | 4.1%(-1.47)#17,183 |
1
Common Questions
What are the Top Zip Codes with the Highest Percentage of Population Employed in Administrative & Support Services in Snohomish, WA?
Top Zip Codes with the Highest Percentage of Population Employed in Administrative & Support Services in Snohomish, WA are:
What zip code has the Highest Percentage of Population Employed in Administrative & Support Services in Snohomish, WA?
98290 has the Highest Percentage of Population Employed in Administrative & Support Services in Snohomish, WA with 3.6%.
What is the Percentage of Population Employed in Administrative & Support Services in Snohomish, WA?
Percentage of Population Employed in Administrative & Support Services in Snohomish is 4.1%.
What is the Percentage of Population Employed in Administrative & Support Services in Washington?
Percentage of Population Employed in Administrative & Support Services in Washington is 3.8%.
What is the Percentage of Population Employed in Administrative & Support Services in the United States?
Percentage of Population Employed in Administrative & Support Services in the United States is 4.1%.