Zip Codes with the Highest Percentage of Families with Income Above $200,000 in Amarillo, TX

RELATED REPORTS & OPTIONS

Family Income | $200k+
Population
Families and Households
Female Fertility
Female Fertility (Unmarried)
Race (Community Size)
Race (Percentage)
Ancestry (Community Size)
AfricanAmericanApacheArabArgentineanAustralianAustrianBasqueBelgianBhutaneseBlackfeetBritishBulgarianBurmeseCajunCanadianCelticCentral AmericanCentral American IndianCherokeeChickasawChoctawColombianComancheCreekCroatianCubanCzechCzechoslovakianDanishDominicanDutchDutch West IndianEastern EuropeanEcuadorianEnglishEthiopianEuropeanFinnishFrenchFrench American IndianFrench CanadianGermanGhanaianGreekGuamanian / ChamorroGuatemalanHonduranHungarianIndian (Asian)IndonesianIranianIraqiIrishIroquoisItalianJamaicanKoreanLebaneseLithuanianMalaysianMexicanMexican American IndianNative HawaiianNavajoNigerianNorthern EuropeanNorwegianPakistaniPanamanianPennsylvania GermanPeruvianPolishPortuguesePuerto RicanRomanianRussianSalvadoranSamoanScandinavianScotch-IrishScottishSiouxSlavicSomaliSouth AmericanSpaniardSpanishSpanish AmericanSri LankanSubsaharan AfricanSudaneseSwedishSwissThaiTurkishUkrainianVenezuelanWelshWest IndianYugoslavian
Ancestry (Percentage)
AfricanAmericanApacheArabArgentineanAustralianAustrianBasqueBelgianBhutaneseBlackfeetBritishBulgarianBurmeseCajunCanadianCelticCentral AmericanCentral American IndianCherokeeChickasawChoctawColombianComancheCreekCroatianCubanCzechCzechoslovakianDanishDominicanDutchDutch West IndianEastern EuropeanEcuadorianEnglishEthiopianEuropeanFinnishFrenchFrench American IndianFrench CanadianGermanGhanaianGreekGuamanian / ChamorroGuatemalanHonduranHungarianIndian (Asian)IndonesianIranianIraqiIrishIroquoisItalianJamaicanKoreanLebaneseLithuanianMalaysianMexicanMexican American IndianNative HawaiianNavajoNigerianNorthern EuropeanNorwegianPakistaniPanamanianPennsylvania GermanPeruvianPolishPortuguesePuerto RicanRomanianRussianSalvadoranSamoanScandinavianScotch-IrishScottishSiouxSlavicSomaliSouth AmericanSpaniardSpanishSpanish AmericanSri LankanSubsaharan AfricanSudaneseSwedishSwissThaiTurkishUkrainianVenezuelanWelshWest IndianYugoslavian
Immigrant Origin (Total)
Immigrant Origin (Percentage)
Income
Income (Families)
Income (Households)
Poverty
Poverty (Families)
Unemployment
Employment Occupations
Employment Industries
Employer Class
Commute Time
Commute Means
School Enrollment
Education by Degree Field
Occupancy
Finances
Physical Characteristics
Amarillo
Compare Zip Codes
Comparison Subject

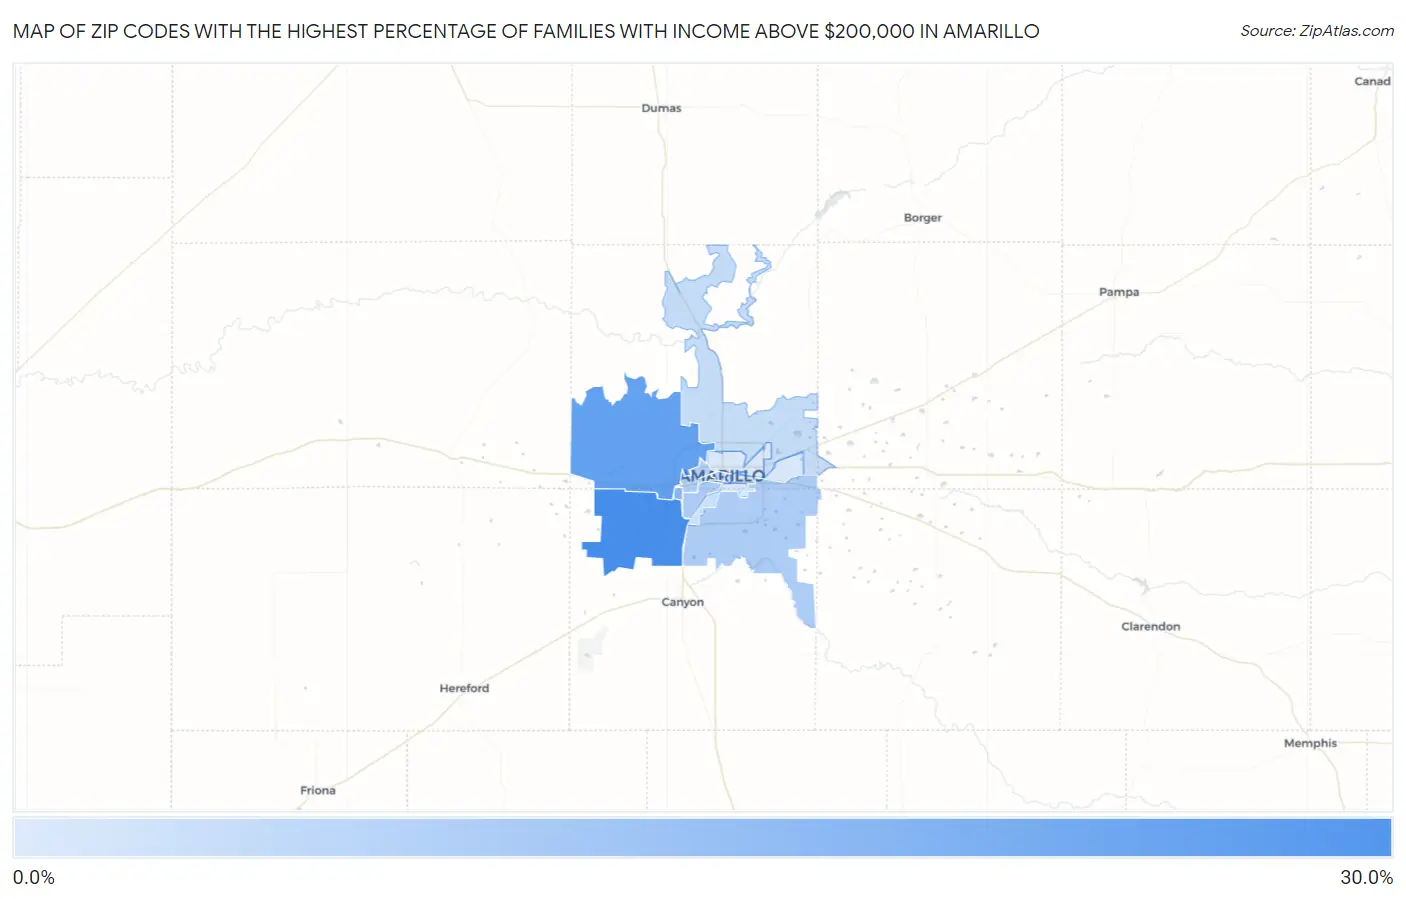
Map of Zip Codes with the Highest Percentage of Families with Income Above $200,000 in Amarillo

0.0%
30.0%
Zip Codes with the Highest Percentage of Families with Income Above $200,000 in Amarillo Map

Zip Codes with the Highest Percentage of Families with Income Above $200,000 in Amarillo, TX

Zip Code Families with Income > $200k vs State vs National
1.7911926.1%13.5%(+12.6)#16214.8%(+11.3)#3,217
2.7912420.8%13.5%(+7.30)#23414.8%(+6.00)#4,575
3.7912114.1%13.5%(+0.600)#39914.8%(-0.700)#7,493
4.791098.7%13.5%(-4.80)#73014.8%(-6.10)#12,246
5.791188.1%13.5%(-5.40)#77914.8%(-6.70)#13,053
6.791067.1%13.5%(-6.40)#87414.8%(-7.70)#14,479
7.791016.2%13.5%(-7.30)#96314.8%(-8.60)#16,181
8.791084.0%13.5%(-9.50)#1,21914.8%(-10.8)#20,438
9.791103.2%13.5%(-10.3)#1,31314.8%(-11.6)#22,068
10.791022.4%13.5%(-11.1)#1,41914.8%(-12.4)#23,736
11.791041.2%13.5%(-12.3)#1,53714.8%(-13.6)#25,811
12.791111.1%13.5%(-12.4)#1,54614.8%(-13.7)#25,995
13.791071.0%13.5%(-12.5)#1,54914.8%(-13.8)#26,071
14.791030.60%13.5%(-12.9)#1,59214.8%(-14.2)#26,599

Common Questions

What are the Top 10 Zip Codes with the Highest Percentage of Families with Income Above $200,000 in Amarillo, TX?
Top 10 Zip Codes with the Highest Percentage of Families with Income Above $200,000 in Amarillo, TX are:
#1
26.1%
#2
20.8%
#3
14.1%
#4
8.7%
#5
8.1%
#6
7.1%
#7
6.2%
#8
4.0%
#9
3.2%
#10
2.4%
What zip code has the Highest Percentage of Families with Income Above $200,000 in Amarillo, TX?
79119 has the Highest Percentage of Families with Income Above $200,000 in Amarillo, TX with 26.1%.
What is the Percentage of Families with Income Above $200,000 in Amarillo, TX?
Percentage of Families with Income Above $200,000 in Amarillo is 8.1%.
What is the Percentage of Families with Income Above $200,000 in Texas?
Percentage of Families with Income Above $200,000 in Texas is 13.5%.
What is the Percentage of Families with Income Above $200,000 in the United States?
Percentage of Families with Income Above $200,000 in the United States is 14.8%.