Zip Codes with the Highest Percentage of Families with Income Above $200,000 in Brownsville, TX
RELATED REPORTS & OPTIONS
Family Income | $200k+
Brownsville
Compare Zip Codes
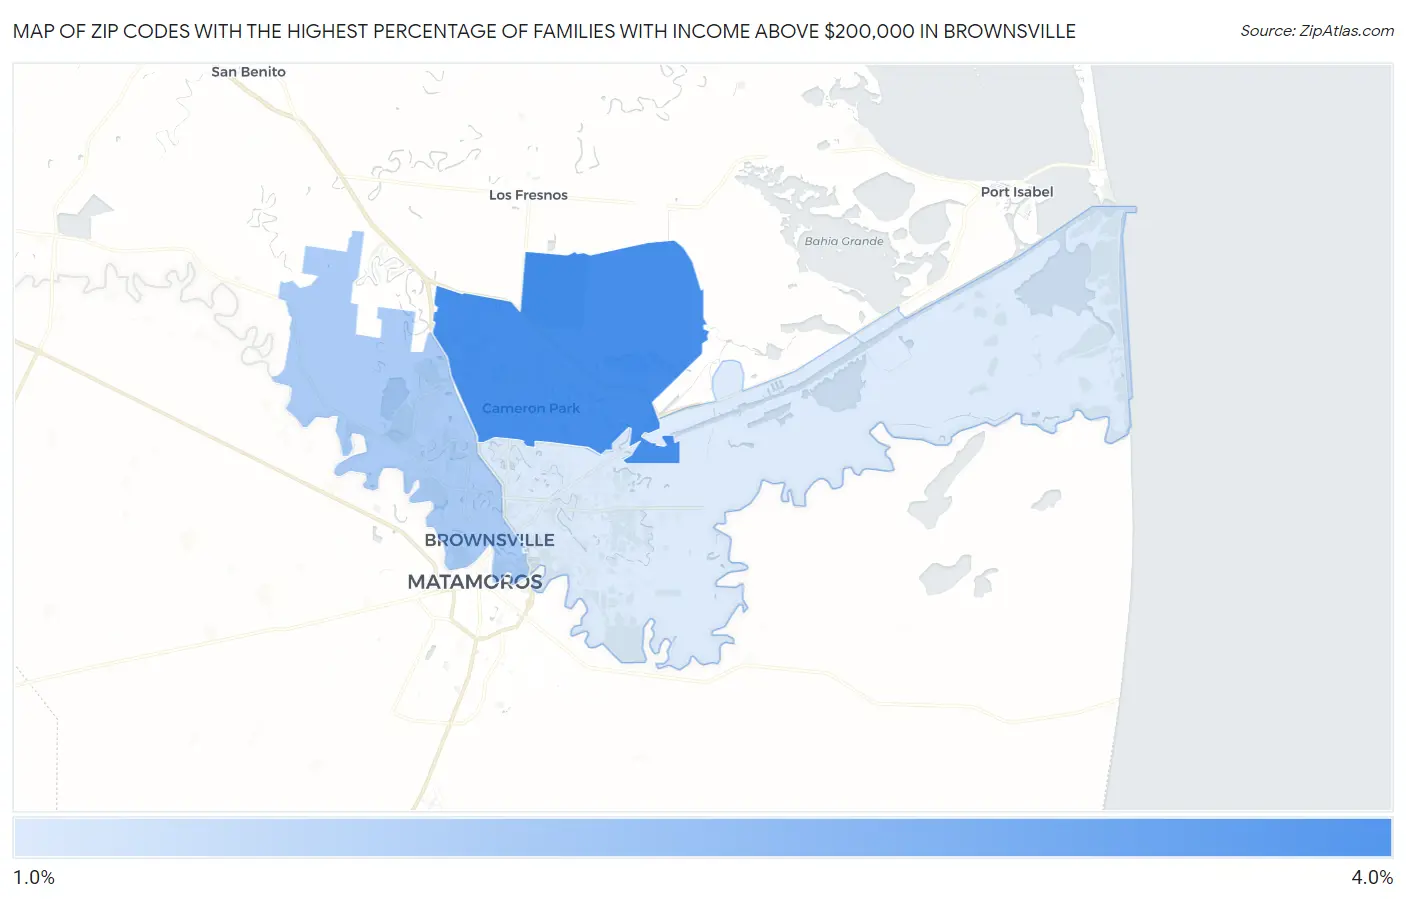
Map of Zip Codes with the Highest Percentage of Families with Income Above $200,000 in Brownsville
1.9%
4.0%
Zip Codes with the Highest Percentage of Families with Income Above $200,000 in Brownsville, TX
| Zip Code | Families with Income > $200k | vs State | vs National | |
| 1. | 78526 | 4.0% | 13.5%(-9.50)#1,213 | 14.8%(-10.8)#20,385 |
| 2. | 78520 | 2.6% | 13.5%(-10.9)#1,394 | 14.8%(-12.2)#23,290 |
| 3. | 78521 | 1.9% | 13.5%(-11.6)#1,457 | 14.8%(-12.9)#24,607 |
1
Common Questions
What are the Top Zip Codes with the Highest Percentage of Families with Income Above $200,000 in Brownsville, TX?
Top Zip Codes with the Highest Percentage of Families with Income Above $200,000 in Brownsville, TX are:
What zip code has the Highest Percentage of Families with Income Above $200,000 in Brownsville, TX?
78526 has the Highest Percentage of Families with Income Above $200,000 in Brownsville, TX with 4.0%.
What is the Percentage of Families with Income Above $200,000 in Brownsville, TX?
Percentage of Families with Income Above $200,000 in Brownsville is 3.0%.
What is the Percentage of Families with Income Above $200,000 in Texas?
Percentage of Families with Income Above $200,000 in Texas is 13.5%.
What is the Percentage of Families with Income Above $200,000 in the United States?
Percentage of Families with Income Above $200,000 in the United States is 14.8%.