Zip Codes with the Highest Percentage of Population with a Degree in Science and Engineering in South Carolina
RELATED REPORTS & OPTIONS
Science and Engineering
South Carolina
Compare Zip Codes
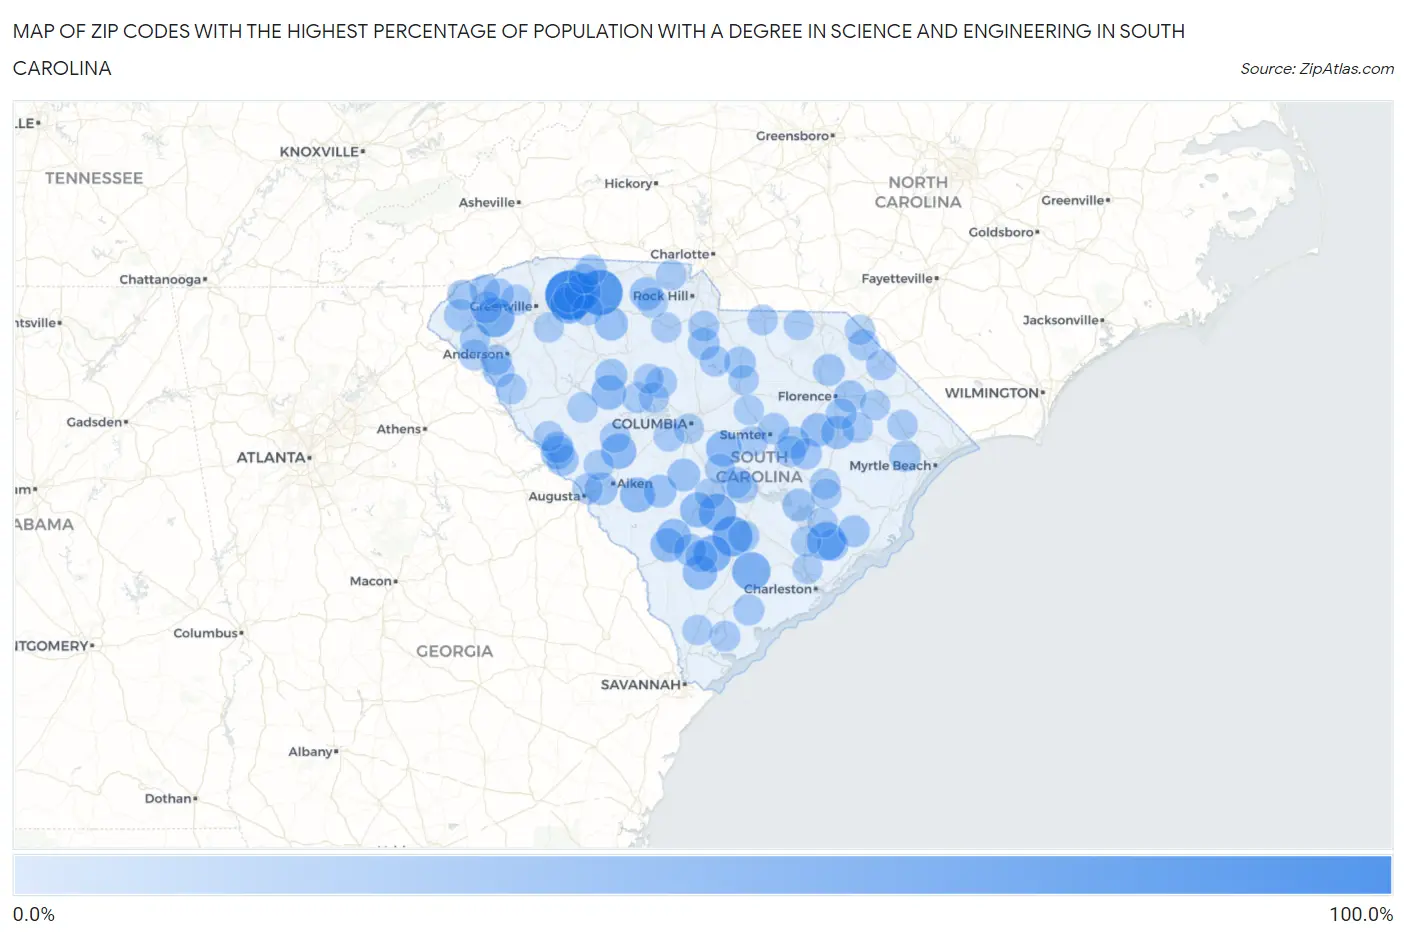
Map of Zip Codes with the Highest Percentage of Population with a Degree in Science and Engineering in South Carolina
0.0%
100.0%
Zip Codes with the Highest Percentage of Population with a Degree in Science and Engineering in South Carolina
| Zip Code | % Graduates | vs State | vs National | |
| 1. | 29377 | 100.0% | 10.2%(+89.8)#1 | 9.8%(+90.2)#15 |
| 2. | 29346 | 81.0% | 10.2%(+70.7)#2 | 9.8%(+71.2)#131 |
| 3. | 29471 | 55.8% | 10.2%(+45.5)#3 | 9.8%(+46.0)#309 |
| 4. | 29667 | 53.1% | 10.2%(+42.9)#4 | 9.8%(+43.3)#345 |
| 5. | 29434 | 50.0% | 10.2%(+39.8)#5 | 9.8%(+40.2)#378 |
| 6. | 29474 | 49.5% | 10.2%(+39.3)#6 | 9.8%(+39.7)#428 |
| 7. | 29133 | 45.5% | 10.2%(+35.2)#7 | 9.8%(+35.7)#506 |
| 8. | 29493 | 45.2% | 10.2%(+34.9)#8 | 9.8%(+35.4)#521 |
| 9. | 29375 | 45.2% | 10.2%(+34.9)#9 | 9.8%(+35.4)#522 |
| 10. | 29320 | 41.2% | 10.2%(+31.0)#10 | 9.8%(+31.5)#623 |
| 11. | 29052 | 36.5% | 10.2%(+26.3)#11 | 9.8%(+26.8)#834 |
| 12. | 29129 | 35.7% | 10.2%(+25.5)#12 | 9.8%(+25.9)#898 |
| 13. | 29038 | 34.2% | 10.2%(+24.0)#13 | 9.8%(+24.4)#978 |
| 14. | 29856 | 34.0% | 10.2%(+23.7)#14 | 9.8%(+24.2)#1,001 |
| 15. | 29145 | 33.3% | 10.2%(+23.1)#15 | 9.8%(+23.6)#1,029 |
| 16. | 29843 | 32.9% | 10.2%(+22.7)#16 | 9.8%(+23.1)#1,082 |
| 17. | 29929 | 32.6% | 10.2%(+22.4)#17 | 9.8%(+22.9)#1,096 |
| 18. | 29849 | 30.8% | 10.2%(+20.6)#18 | 9.8%(+21.0)#1,243 |
| 19. | 29114 | 28.7% | 10.2%(+18.5)#19 | 9.8%(+18.9)#1,443 |
| 20. | 29844 | 28.0% | 10.2%(+17.8)#20 | 9.8%(+18.2)#1,534 |
| 21. | 29321 | 27.4% | 10.2%(+17.2)#21 | 9.8%(+17.6)#1,606 |
| 22. | 29591 | 27.1% | 10.2%(+16.9)#22 | 9.8%(+17.3)#1,655 |
| 23. | 29717 | 26.5% | 10.2%(+16.3)#23 | 9.8%(+16.7)#1,720 |
| 24. | 29146 | 25.7% | 10.2%(+15.5)#24 | 9.8%(+16.0)#1,824 |
| 25. | 29112 | 25.5% | 10.2%(+15.3)#25 | 9.8%(+15.7)#1,861 |
| 26. | 29828 | 25.0% | 10.2%(+14.8)#26 | 9.8%(+15.2)#1,954 |
| 27. | 29468 | 23.8% | 10.2%(+13.6)#27 | 9.8%(+14.0)#2,190 |
| 28. | 29081 | 23.2% | 10.2%(+13.0)#28 | 9.8%(+13.5)#2,332 |
| 29. | 29355 | 23.0% | 10.2%(+12.8)#29 | 9.8%(+13.2)#2,384 |
| 30. | 29691 | 21.8% | 10.2%(+11.6)#30 | 9.8%(+12.0)#2,696 |
| 31. | 29838 | 21.6% | 10.2%(+11.4)#31 | 9.8%(+11.8)#2,759 |
| 32. | 29540 | 21.4% | 10.2%(+11.1)#32 | 9.8%(+11.6)#2,840 |
| 33. | 29055 | 21.4% | 10.2%(+11.1)#33 | 9.8%(+11.6)#2,841 |
| 34. | 29082 | 21.2% | 10.2%(+11.0)#34 | 9.8%(+11.4)#2,885 |
| 35. | 29051 | 21.1% | 10.2%(+10.8)#35 | 9.8%(+11.3)#2,948 |
| 36. | 29175 | 20.9% | 10.2%(+10.7)#36 | 9.8%(+11.1)#2,985 |
| 37. | 29845 | 20.9% | 10.2%(+10.7)#37 | 9.8%(+11.1)#2,993 |
| 38. | 29682 | 20.6% | 10.2%(+10.4)#38 | 9.8%(+10.9)#3,088 |
| 39. | 29450 | 20.4% | 10.2%(+10.2)#39 | 9.8%(+10.7)#3,165 |
| 40. | 29506 | 20.4% | 10.2%(+10.1)#40 | 9.8%(+10.6)#3,197 |
| 41. | 29453 | 20.3% | 10.2%(+10.1)#41 | 9.8%(+10.5)#3,206 |
| 42. | 29684 | 19.3% | 10.2%(+9.12)#42 | 9.8%(+9.56)#3,637 |
| 43. | 29153 | 19.3% | 10.2%(+9.10)#43 | 9.8%(+9.54)#3,644 |
| 44. | 29001 | 19.3% | 10.2%(+9.10)#44 | 9.8%(+9.54)#3,645 |
| 45. | 29111 | 19.2% | 10.2%(+9.03)#45 | 9.8%(+9.47)#3,675 |
| 46. | 29477 | 19.2% | 10.2%(+9.03)#46 | 9.8%(+9.46)#3,679 |
| 47. | 29065 | 19.0% | 10.2%(+8.83)#47 | 9.8%(+9.27)#3,778 |
| 48. | 29047 | 18.7% | 10.2%(+8.46)#48 | 9.8%(+8.89)#3,952 |
| 49. | 29527 | 18.2% | 10.2%(+7.94)#49 | 9.8%(+8.37)#4,233 |
| 50. | 29525 | 17.9% | 10.2%(+7.72)#50 | 9.8%(+8.16)#4,362 |
| 51. | 29323 | 17.6% | 10.2%(+7.37)#51 | 9.8%(+7.81)#4,559 |
| 52. | 29030 | 17.5% | 10.2%(+7.30)#52 | 9.8%(+7.73)#4,613 |
| 53. | 29583 | 16.9% | 10.2%(+6.64)#53 | 9.8%(+7.08)#5,063 |
| 54. | 29541 | 16.8% | 10.2%(+6.55)#54 | 9.8%(+6.99)#5,147 |
| 55. | 29376 | 16.7% | 10.2%(+6.48)#55 | 9.8%(+6.92)#5,196 |
| 56. | 29446 | 16.7% | 10.2%(+6.45)#56 | 9.8%(+6.89)#5,220 |
| 57. | 29714 | 16.6% | 10.2%(+6.34)#57 | 9.8%(+6.77)#5,320 |
| 58. | 29626 | 16.5% | 10.2%(+6.29)#58 | 9.8%(+6.73)#5,350 |
| 59. | 29074 | 16.4% | 10.2%(+6.20)#59 | 9.8%(+6.64)#5,433 |
| 60. | 29906 | 16.2% | 10.2%(+5.97)#60 | 9.8%(+6.41)#5,591 |
| 61. | 29655 | 16.0% | 10.2%(+5.78)#61 | 9.8%(+6.22)#5,728 |
| 62. | 29166 | 16.0% | 10.2%(+5.78)#62 | 9.8%(+6.22)#5,731 |
| 63. | 29115 | 15.8% | 10.2%(+5.59)#63 | 9.8%(+6.03)#5,880 |
| 64. | 29073 | 15.8% | 10.2%(+5.55)#64 | 9.8%(+5.99)#5,923 |
| 65. | 29590 | 15.7% | 10.2%(+5.51)#65 | 9.8%(+5.95)#5,954 |
| 66. | 29640 | 15.7% | 10.2%(+5.47)#66 | 9.8%(+5.90)#6,000 |
| 67. | 29841 | 15.5% | 10.2%(+5.29)#67 | 9.8%(+5.73)#6,179 |
| 68. | 29666 | 15.5% | 10.2%(+5.28)#68 | 9.8%(+5.72)#6,185 |
| 69. | 29544 | 15.4% | 10.2%(+5.14)#69 | 9.8%(+5.58)#6,346 |
| 70. | 29742 | 15.3% | 10.2%(+5.11)#70 | 9.8%(+5.55)#6,367 |
| 71. | 29671 | 15.3% | 10.2%(+5.04)#71 | 9.8%(+5.47)#6,449 |
| 72. | 29127 | 15.2% | 10.2%(+4.94)#72 | 9.8%(+5.38)#6,545 |
| 73. | 29728 | 15.1% | 10.2%(+4.88)#73 | 9.8%(+5.31)#6,613 |
| 74. | 29685 | 15.1% | 10.2%(+4.86)#74 | 9.8%(+5.29)#6,629 |
| 75. | 29154 | 15.1% | 10.2%(+4.84)#75 | 9.8%(+5.27)#6,650 |
| 76. | 29710 | 15.0% | 10.2%(+4.81)#76 | 9.8%(+5.25)#6,682 |
| 77. | 29686 | 15.0% | 10.2%(+4.78)#77 | 9.8%(+5.22)#6,713 |
| 78. | 29643 | 15.0% | 10.2%(+4.75)#78 | 9.8%(+5.18)#6,765 |
| 79. | 29461 | 14.9% | 10.2%(+4.73)#79 | 9.8%(+5.16)#6,783 |
| 80. | 29536 | 14.9% | 10.2%(+4.66)#80 | 9.8%(+5.09)#6,839 |
| 81. | 29564 | 14.7% | 10.2%(+4.45)#81 | 9.8%(+4.89)#7,039 |
| 82. | 29571 | 14.7% | 10.2%(+4.44)#82 | 9.8%(+4.87)#7,058 |
| 83. | 29135 | 14.6% | 10.2%(+4.35)#83 | 9.8%(+4.78)#7,167 |
| 84. | 29334 | 14.5% | 10.2%(+4.33)#84 | 9.8%(+4.76)#7,187 |
| 85. | 29835 | 14.5% | 10.2%(+4.29)#85 | 9.8%(+4.72)#7,233 |
| 86. | 29678 | 14.5% | 10.2%(+4.27)#86 | 9.8%(+4.70)#7,262 |
| 87. | 29075 | 14.4% | 10.2%(+4.23)#87 | 9.8%(+4.66)#7,305 |
| 88. | 29316 | 14.4% | 10.2%(+4.19)#88 | 9.8%(+4.62)#7,348 |
| 89. | 29431 | 14.4% | 10.2%(+4.15)#89 | 9.8%(+4.58)#7,386 |
| 90. | 29706 | 14.3% | 10.2%(+4.07)#90 | 9.8%(+4.50)#7,452 |
| 91. | 29936 | 14.3% | 10.2%(+4.04)#91 | 9.8%(+4.48)#7,555 |
| 92. | 29033 | 14.2% | 10.2%(+4.02)#92 | 9.8%(+4.46)#7,572 |
| 93. | 29020 | 14.2% | 10.2%(+3.99)#93 | 9.8%(+4.42)#7,617 |
| 94. | 29570 | 14.1% | 10.2%(+3.91)#94 | 9.8%(+4.34)#7,710 |
| 95. | 29847 | 14.0% | 10.2%(+3.80)#95 | 9.8%(+4.23)#7,840 |
| 96. | 29406 | 14.0% | 10.2%(+3.79)#96 | 9.8%(+4.22)#7,846 |
| 97. | 29709 | 14.0% | 10.2%(+3.78)#97 | 9.8%(+4.22)#7,852 |
| 98. | 29128 | 13.9% | 10.2%(+3.71)#98 | 9.8%(+4.15)#7,942 |
| 99. | 29680 | 13.8% | 10.2%(+3.62)#99 | 9.8%(+4.06)#8,071 |
| 100. | 29126 | 13.8% | 10.2%(+3.61)#100 | 9.8%(+4.05)#8,094 |
Common Questions
What are the Top 10 Zip Codes with the Highest Percentage of Population with a Degree in Science and Engineering in South Carolina?
Top 10 Zip Codes with the Highest Percentage of Population with a Degree in Science and Engineering in South Carolina are:
What zip code has the Highest Percentage of Population with a Degree in Science and Engineering in South Carolina?
29377 has the Highest Percentage of Population with a Degree in Science and Engineering in South Carolina with 100.0%.
What is the Percentage of Population with a Degree in Science and Engineering in the State of South Carolina?
Percentage of Population with a Degree in Science and Engineering in South Carolina is 10.2%.
What is the Percentage of Population with a Degree in Science and Engineering in the United States?
Percentage of Population with a Degree in Science and Engineering in the United States is 9.8%.