Zip Codes with the Highest Percentage of Guamanian / Chamorro Population in South Carolina
RELATED REPORTS & OPTIONS
Guamanian / Chamorro
South Carolina
Compare Zip Codes
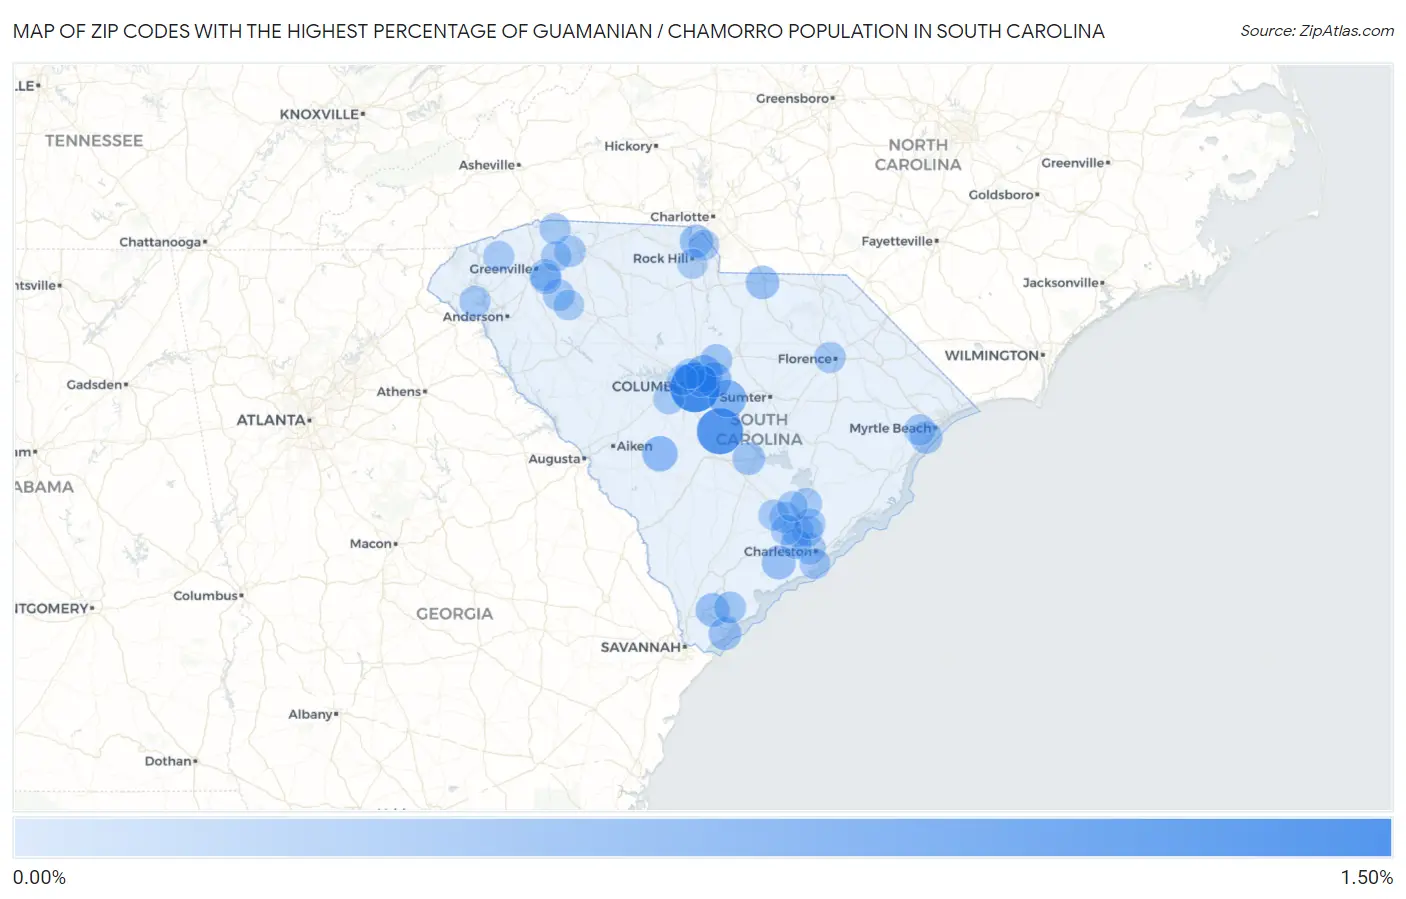
Map of Zip Codes with the Highest Percentage of Guamanian / Chamorro Population in South Carolina
0.00%
1.50%
Zip Codes with the Highest Percentage of Guamanian / Chamorro Population in South Carolina
| Zip Code | Guamanian / Chamorro | vs State | vs National | |
| 1. | 29205 | 1.23% | 0.026%(+1.20)#1 | 0.047%(+1.18)#111 |
| 2. | 29135 | 1.00% | 0.026%(+0.977)#2 | 0.047%(+0.957)#159 |
| 3. | 29044 | 0.45% | 0.026%(+0.425)#3 | 0.047%(+0.405)#469 |
| 4. | 29223 | 0.44% | 0.026%(+0.412)#4 | 0.047%(+0.392)#480 |
| 5. | 29207 | 0.32% | 0.026%(+0.295)#5 | 0.047%(+0.275)#654 |
| 6. | 29146 | 0.32% | 0.026%(+0.290)#6 | 0.047%(+0.269)#666 |
| 7. | 29449 | 0.22% | 0.026%(+0.198)#7 | 0.047%(+0.177)#939 |
| 8. | 29909 | 0.21% | 0.026%(+0.187)#8 | 0.047%(+0.166)#981 |
| 9. | 29728 | 0.19% | 0.026%(+0.168)#9 | 0.047%(+0.148)#1,064 |
| 10. | 29708 | 0.18% | 0.026%(+0.157)#10 | 0.047%(+0.137)#1,117 |
| 11. | 29928 | 0.16% | 0.026%(+0.131)#11 | 0.047%(+0.110)#1,260 |
| 12. | 29142 | 0.14% | 0.026%(+0.117)#12 | 0.047%(+0.096)#1,337 |
| 13. | 29575 | 0.14% | 0.026%(+0.112)#13 | 0.047%(+0.092)#1,366 |
| 14. | 29644 | 0.10% | 0.026%(+0.075)#14 | 0.047%(+0.055)#1,667 |
| 15. | 29045 | 0.10% | 0.026%(+0.075)#15 | 0.047%(+0.054)#1,671 |
| 16. | 29902 | 0.094% | 0.026%(+0.068)#16 | 0.047%(+0.048)#1,737 |
| 17. | 29607 | 0.083% | 0.026%(+0.057)#17 | 0.047%(+0.036)#1,848 |
| 18. | 29206 | 0.080% | 0.026%(+0.054)#18 | 0.047%(+0.033)#1,879 |
| 19. | 29407 | 0.075% | 0.026%(+0.049)#19 | 0.047%(+0.029)#1,927 |
| 20. | 29385 | 0.075% | 0.026%(+0.049)#20 | 0.047%(+0.028)#1,932 |
| 21. | 29420 | 0.075% | 0.026%(+0.048)#21 | 0.047%(+0.028)#1,935 |
| 22. | 29461 | 0.073% | 0.026%(+0.047)#22 | 0.047%(+0.027)#1,950 |
| 23. | 29662 | 0.062% | 0.026%(+0.036)#23 | 0.047%(+0.015)#2,089 |
| 24. | 29588 | 0.060% | 0.026%(+0.034)#24 | 0.047%(+0.014)#2,111 |
| 25. | 29501 | 0.059% | 0.026%(+0.033)#25 | 0.047%(+0.013)#2,135 |
| 26. | 29356 | 0.057% | 0.026%(+0.030)#26 | 0.047%(+0.010)#2,157 |
| 27. | 29483 | 0.056% | 0.026%(+0.030)#27 | 0.047%(+0.010)#2,158 |
| 28. | 29073 | 0.054% | 0.026%(+0.028)#28 | 0.047%(+0.008)#2,184 |
| 29. | 29678 | 0.051% | 0.026%(+0.025)#29 | 0.047%(+0.005)#2,222 |
| 30. | 29210 | 0.044% | 0.026%(+0.018)#30 | 0.047%(-0.003)#2,356 |
| 31. | 29406 | 0.043% | 0.026%(+0.017)#31 | 0.047%(-0.004)#2,369 |
| 32. | 29671 | 0.041% | 0.026%(+0.015)#32 | 0.047%(-0.005)#2,390 |
| 33. | 29414 | 0.038% | 0.026%(+0.012)#33 | 0.047%(-0.008)#2,441 |
| 34. | 29472 | 0.037% | 0.026%(+0.011)#34 | 0.047%(-0.009)#2,467 |
| 35. | 29445 | 0.026% | 0.026%(+0.000)#35 | 0.047%(-0.020)#2,702 |
| 36. | 29715 | 0.026% | 0.026%(+0.000)#36 | 0.047%(-0.020)#2,704 |
| 37. | 29412 | 0.022% | 0.026%(-0.004)#37 | 0.047%(-0.024)#2,790 |
| 38. | 29651 | 0.020% | 0.026%(-0.006)#38 | 0.047%(-0.026)#2,827 |
| 39. | 29645 | 0.019% | 0.026%(-0.007)#39 | 0.047%(-0.028)#2,856 |
| 40. | 29485 | 0.019% | 0.026%(-0.007)#40 | 0.047%(-0.028)#2,862 |
| 41. | 29486 | 0.016% | 0.026%(-0.010)#41 | 0.047%(-0.030)#2,918 |
| 42. | 29203 | 0.015% | 0.026%(-0.012)#42 | 0.047%(-0.032)#2,950 |
| 43. | 29730 | 0.0071% | 0.026%(-0.019)#43 | 0.047%(-0.039)#3,068 |
1
2Common Questions
What are the Top 10 Zip Codes with the Highest Percentage of Guamanian / Chamorro Population in South Carolina?
Top 10 Zip Codes with the Highest Percentage of Guamanian / Chamorro Population in South Carolina are:
What zip code has the Highest Percentage of Guamanian / Chamorro Population in South Carolina?
29205 has the Highest Percentage of Guamanian / Chamorro Population in South Carolina with 1.23%.
What is the Percentage of Guamanian / Chamorro Population in the State of South Carolina?
Percentage of Guamanian / Chamorro Population in South Carolina is 0.026%.
What is the Percentage of Guamanian / Chamorro Population in the United States?
Percentage of Guamanian / Chamorro Population in the United States is 0.047%.