Foster Center, RI Map & Demographics
Foster Center Map
Foster Center Overview
$31,717
PER CAPITA INCOME
$78,875
AVG FAMILY INCOME
$52,742
AVG HOUSEHOLD INCOME
0.47
INEQUALITY / GINI INDEX
343
TOTAL POPULATION
154
MALE POPULATION
189
FEMALE POPULATION
81.48
MALES / 100 FEMALES
122.73
FEMALES / 100 MALES
55.8
MEDIAN AGE
3.5
AVG FAMILY SIZE
2.0
AVG HOUSEHOLD SIZE
121
LABOR FORCE [ PEOPLE ]
41.9%
PERCENT IN LABOR FORCE
Income in Foster Center
Income Overview in Foster Center
Per Capita Income in Foster Center is $31,717, while median incomes of families and households are $78,875 and $52,742 respectively.
| Characteristic | Number | Measure |
| Per Capita Income | 343 | $31,717 |
| Median Family Income | 51 | $78,875 |
| Mean Family Income | 51 | $106,604 |
| Median Household Income | 174 | $52,742 |
| Mean Household Income | 174 | $60,809 |
| Income Deficit | 51 | $0 |
| Wage / Income Gap (%) | 343 | 0.00% |
| Wage / Income Gap ($) | 343 | 100.00¢ per $1 |
| Gini / Inequality Index | 343 | 0.47 |
Earnings by Sex in Foster Center
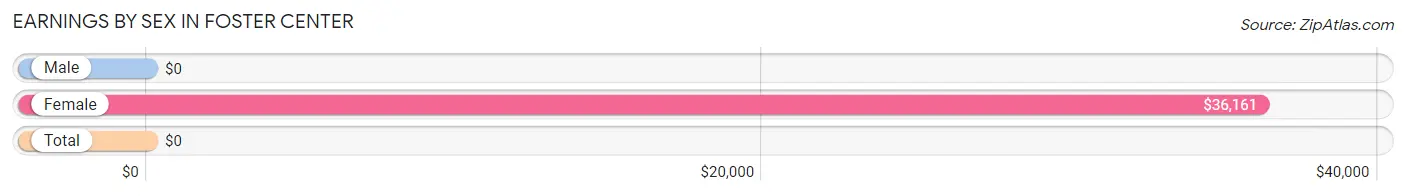
| Sex | Number | Average Earnings |
| Male | 52 (43.0%) | $0 |
| Female | 69 (57.0%) | $36,161 |
| Total | 121 (100.0%) | $0 |
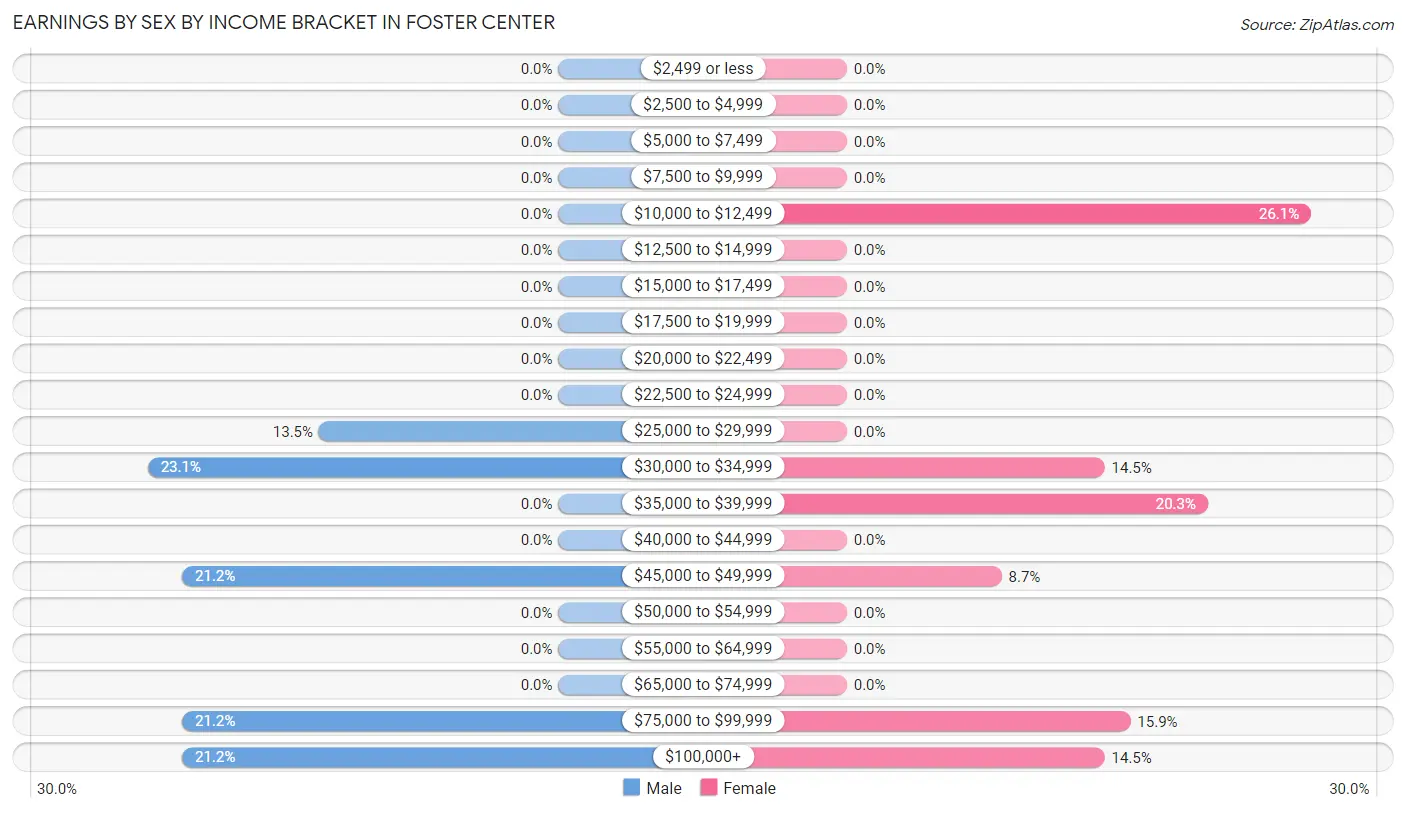
Earnings by Sex by Income Bracket in Foster Center
The most common earnings brackets in Foster Center are $30,000 to $34,999 for men (12 | 23.1%) and $10,000 to $12,499 for women (18 | 26.1%).
| Income | Male | Female |
| $2,499 or less | 0 (0.0%) | 0 (0.0%) |
| $2,500 to $4,999 | 0 (0.0%) | 0 (0.0%) |
| $5,000 to $7,499 | 0 (0.0%) | 0 (0.0%) |
| $7,500 to $9,999 | 0 (0.0%) | 0 (0.0%) |
| $10,000 to $12,499 | 0 (0.0%) | 18 (26.1%) |
| $12,500 to $14,999 | 0 (0.0%) | 0 (0.0%) |
| $15,000 to $17,499 | 0 (0.0%) | 0 (0.0%) |
| $17,500 to $19,999 | 0 (0.0%) | 0 (0.0%) |
| $20,000 to $22,499 | 0 (0.0%) | 0 (0.0%) |
| $22,500 to $24,999 | 0 (0.0%) | 0 (0.0%) |
| $25,000 to $29,999 | 7 (13.5%) | 0 (0.0%) |
| $30,000 to $34,999 | 12 (23.1%) | 10 (14.5%) |
| $35,000 to $39,999 | 0 (0.0%) | 14 (20.3%) |
| $40,000 to $44,999 | 0 (0.0%) | 0 (0.0%) |
| $45,000 to $49,999 | 11 (21.1%) | 6 (8.7%) |
| $50,000 to $54,999 | 0 (0.0%) | 0 (0.0%) |
| $55,000 to $64,999 | 0 (0.0%) | 0 (0.0%) |
| $65,000 to $74,999 | 0 (0.0%) | 0 (0.0%) |
| $75,000 to $99,999 | 11 (21.1%) | 11 (15.9%) |
| $100,000+ | 11 (21.1%) | 10 (14.5%) |
| Total | 52 (100.0%) | 69 (100.0%) |
Earnings by Sex by Educational Attainment in Foster Center
| Educational Attainment | Male Income | Female Income |
| Less than High School | - | - |
| High School Diploma | - | - |
| College or Associate's Degree | - | - |
| Bachelor's Degree | - | - |
| Graduate Degree | - | - |
| Total | - | - |
Family Income in Foster Center
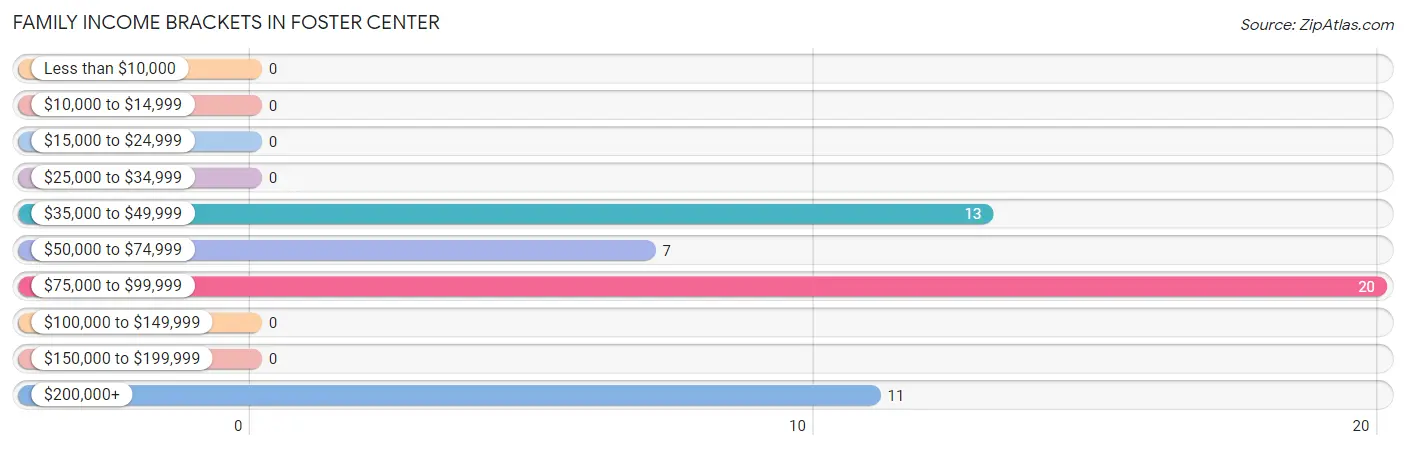
Family Income Brackets in Foster Center
According to the Foster Center family income data, there are 20 families falling into the $75,000 to $99,999 income range, which is the most common income bracket and makes up 39.2% of all families.
| Income Bracket | # Families | % Families |
| Less than $10,000 | 0 | 0.0% |
| $10,000 to $14,999 | 0 | 0.0% |
| $15,000 to $24,999 | 0 | 0.0% |
| $25,000 to $34,999 | 0 | 0.0% |
| $35,000 to $49,999 | 13 | 25.5% |
| $50,000 to $74,999 | 7 | 13.7% |
| $75,000 to $99,999 | 20 | 39.2% |
| $100,000 to $149,999 | 0 | 0.0% |
| $150,000 to $199,999 | 0 | 0.0% |
| $200,000+ | 11 | 21.6% |
Family Income by Famaliy Size in Foster Center
| Income Bracket | # Families | Median Income |
| 2-Person Families | 13 (25.5%) | $0 |
| 3-Person Families | 20 (39.2%) | $0 |
| 4-Person Families | 7 (13.7%) | $0 |
| 5-Person Families | 11 (21.6%) | $0 |
| 6-Person Families | 0 (0.0%) | $0 |
| 7+ Person Families | 0 (0.0%) | $0 |
| Total | 51 (100.0%) | $78,875 |
Family Income by Number of Earners in Foster Center
| Number of Earners | # Families | Median Income |
| No Earners | 0 (0.0%) | $0 |
| 1 Earner | 13 (25.5%) | $0 |
| 2 Earners | 38 (74.5%) | $0 |
| 3+ Earners | 0 (0.0%) | $0 |
| Total | 51 (100.0%) | $78,875 |
Household Income in Foster Center
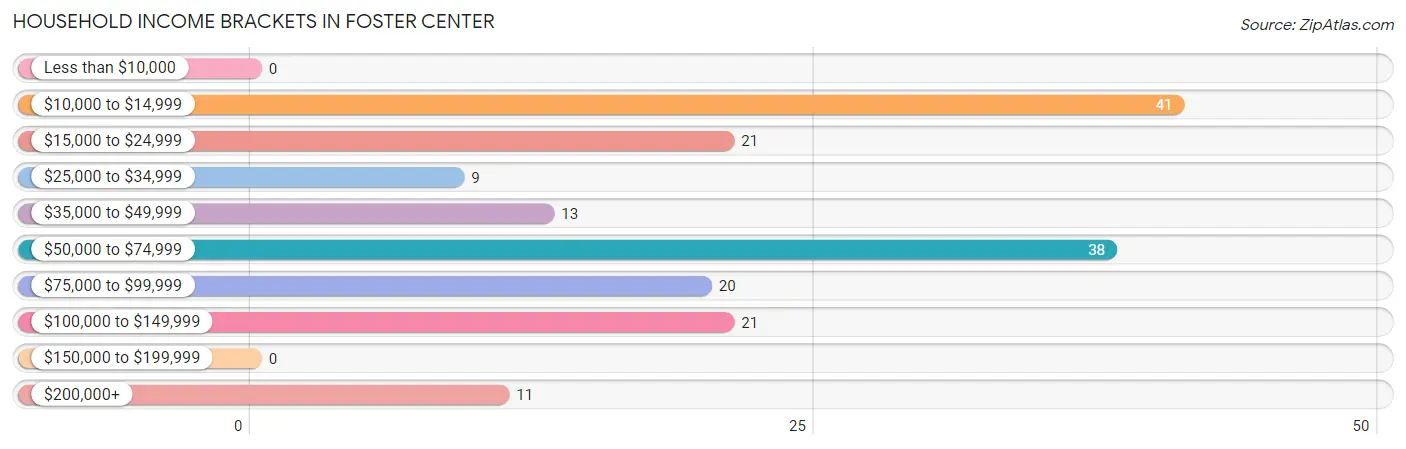
Household Income Brackets in Foster Center
With 41 households falling in the category, the $10,000 to $14,999 income range is the most frequent in Foster Center, accounting for 23.6% of all households.
| Income Bracket | # Households | % Households |
| Less than $10,000 | 0 | 0.0% |
| $10,000 to $14,999 | 41 | 23.6% |
| $15,000 to $24,999 | 21 | 12.1% |
| $25,000 to $34,999 | 9 | 5.2% |
| $35,000 to $49,999 | 13 | 7.5% |
| $50,000 to $74,999 | 38 | 21.8% |
| $75,000 to $99,999 | 20 | 11.5% |
| $100,000 to $149,999 | 21 | 12.1% |
| $150,000 to $199,999 | 0 | 0.0% |
| $200,000+ | 11 | 6.3% |
Household Income by Householder Age in Foster Center
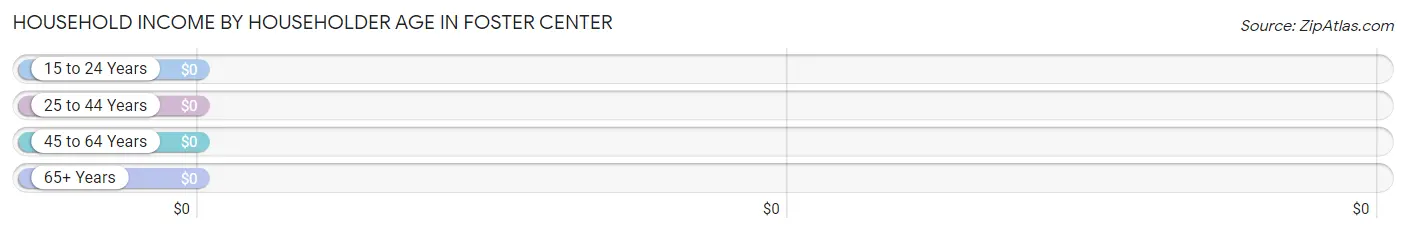
| Income Bracket | # Households | Median Income |
| 15 to 24 Years | 0 (0.0%) | $0 |
| 25 to 44 Years | 28 (16.1%) | $0 |
| 45 to 64 Years | 36 (20.7%) | $0 |
| 65+ Years | 110 (63.2%) | $0 |
| Total | 174 (100.0%) | $52,742 |
Poverty in Foster Center
Income Below Poverty by Sex and Age in Foster Center
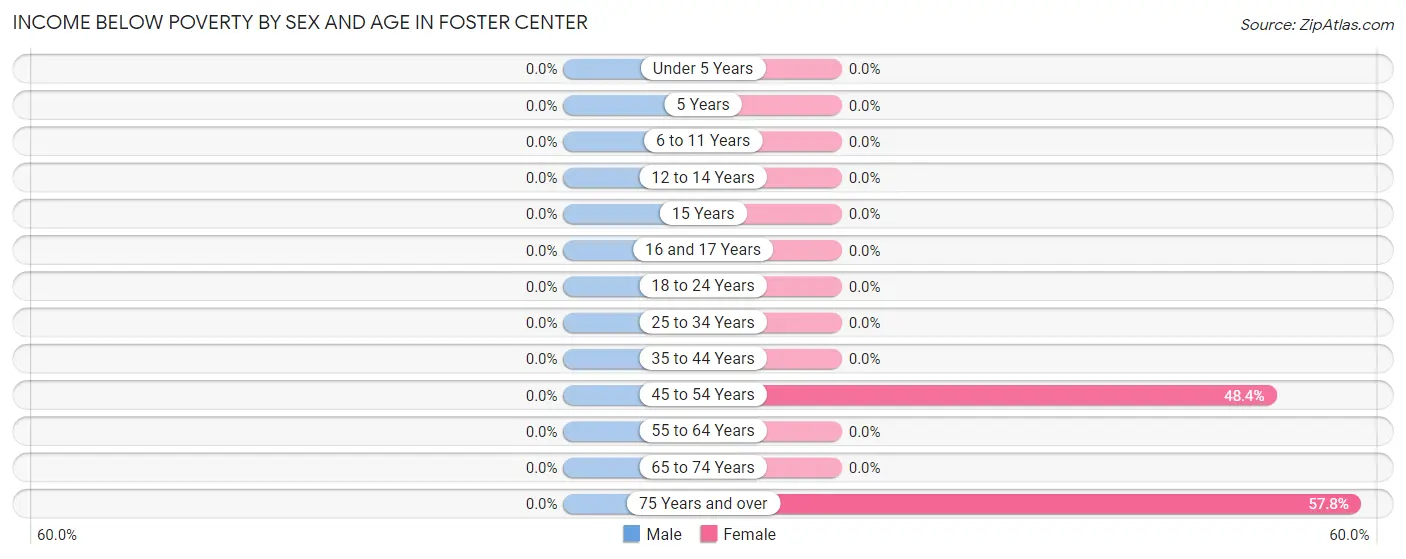
| Age Bracket | Male | Female |
| Under 5 Years | 0 (0.0%) | 0 (0.0%) |
| 5 Years | 0 (0.0%) | 0 (0.0%) |
| 6 to 11 Years | 0 (0.0%) | 0 (0.0%) |
| 12 to 14 Years | 0 (0.0%) | 0 (0.0%) |
| 15 Years | 0 (0.0%) | 0 (0.0%) |
| 16 and 17 Years | 0 (0.0%) | 0 (0.0%) |
| 18 to 24 Years | 0 (0.0%) | 0 (0.0%) |
| 25 to 34 Years | 0 (0.0%) | 0 (0.0%) |
| 35 to 44 Years | 0 (0.0%) | 0 (0.0%) |
| 45 to 54 Years | 0 (0.0%) | 15 (48.4%) |
| 55 to 64 Years | 0 (0.0%) | 0 (0.0%) |
| 65 to 74 Years | 0 (0.0%) | 0 (0.0%) |
| 75 Years and over | 0 (0.0%) | 26 (57.8%) |
| Total | 0 (0.0%) | 41 (21.7%) |
Income Above Poverty by Sex and Age in Foster Center
According to the poverty statistics in Foster Center, males aged 6 to 11 years and females aged under 5 years are the age groups that are most secure financially, with 100.0% of males and 100.0% of females in these age groups living above the poverty line.
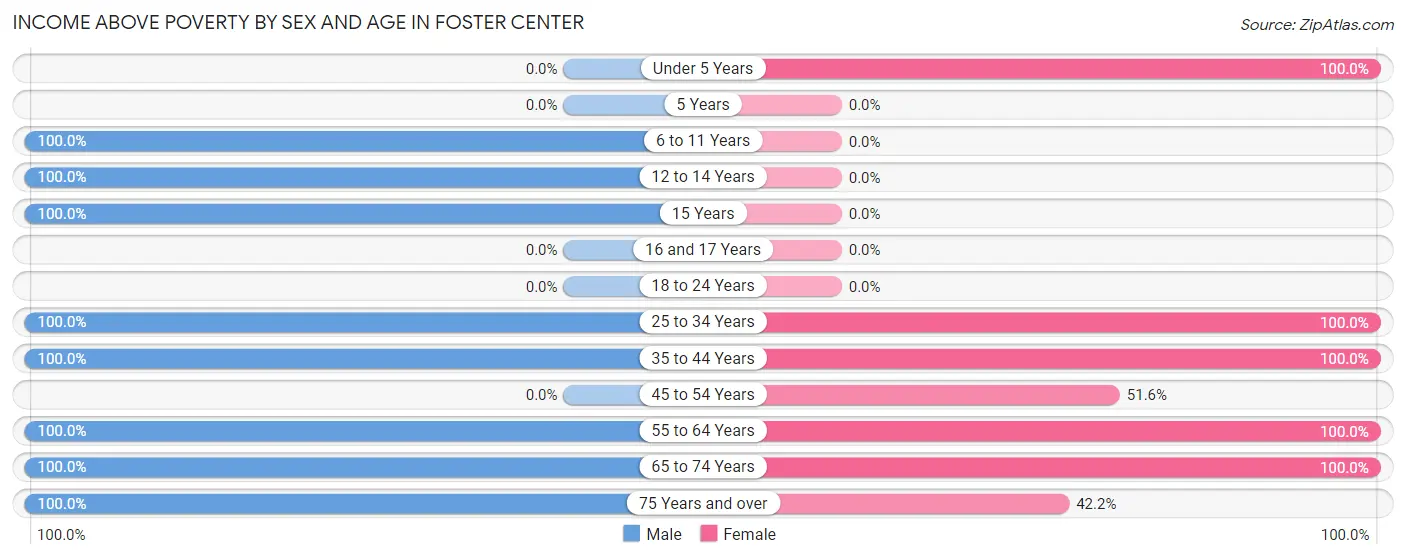
| Age Bracket | Male | Female |
| Under 5 Years | 0 (0.0%) | 6 (100.0%) |
| 5 Years | 0 (0.0%) | 0 (0.0%) |
| 6 to 11 Years | 11 (100.0%) | 0 (0.0%) |
| 12 to 14 Years | 30 (100.0%) | 0 (0.0%) |
| 15 Years | 7 (100.0%) | 0 (0.0%) |
| 16 and 17 Years | 0 (0.0%) | 0 (0.0%) |
| 18 to 24 Years | 0 (0.0%) | 0 (0.0%) |
| 25 to 34 Years | 23 (100.0%) | 24 (100.0%) |
| 35 to 44 Years | 18 (100.0%) | 11 (100.0%) |
| 45 to 54 Years | 0 (0.0%) | 16 (51.6%) |
| 55 to 64 Years | 11 (100.0%) | 31 (100.0%) |
| 65 to 74 Years | 30 (100.0%) | 41 (100.0%) |
| 75 Years and over | 24 (100.0%) | 19 (42.2%) |
| Total | 154 (100.0%) | 148 (78.3%) |
Income Below Poverty Among Married-Couple Families in Foster Center
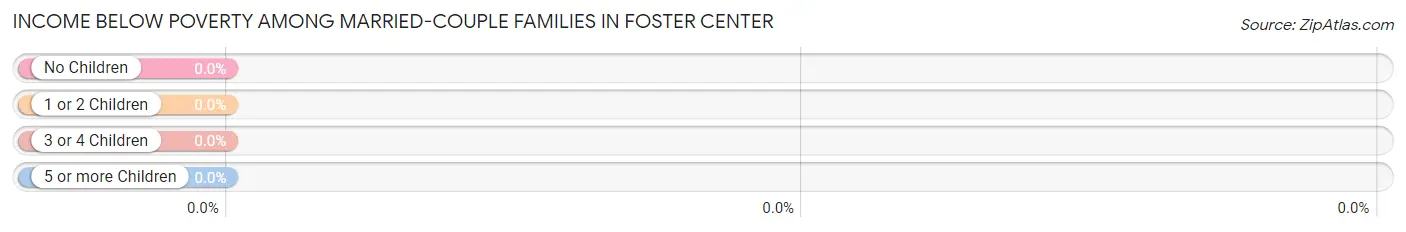
| Children | Above Poverty | Below Poverty |
| No Children | 0 (0.0%) | 0 (0.0%) |
| 1 or 2 Children | 17 (100.0%) | 0 (0.0%) |
| 3 or 4 Children | 11 (100.0%) | 0 (0.0%) |
| 5 or more Children | 0 (0.0%) | 0 (0.0%) |
| Total | 28 (100.0%) | 0 (0.0%) |
Income Below Poverty Among Single-Parent Households in Foster Center
| Children | Single Father | Single Mother |
| No Children | 0 (0.0%) | 0 (0.0%) |
| 1 or 2 Children | 0 (0.0%) | 0 (0.0%) |
| 3 or 4 Children | 0 (0.0%) | 0 (0.0%) |
| 5 or more Children | 0 (0.0%) | 0 (0.0%) |
| Total | 0 (0.0%) | 0 (0.0%) |
Income Below Poverty Among Married-Couple vs Single-Parent Households in Foster Center
| Children | Married-Couple Families | Single-Parent Households |
| No Children | 0 (0.0%) | 0 (0.0%) |
| 1 or 2 Children | 0 (0.0%) | 0 (0.0%) |
| 3 or 4 Children | 0 (0.0%) | 0 (0.0%) |
| 5 or more Children | 0 (0.0%) | 0 (0.0%) |
| Total | 0 (0.0%) | 0 (0.0%) |
Race in Foster Center
The most populous races in Foster Center are , and White / Caucasian (343 | 100.0%).
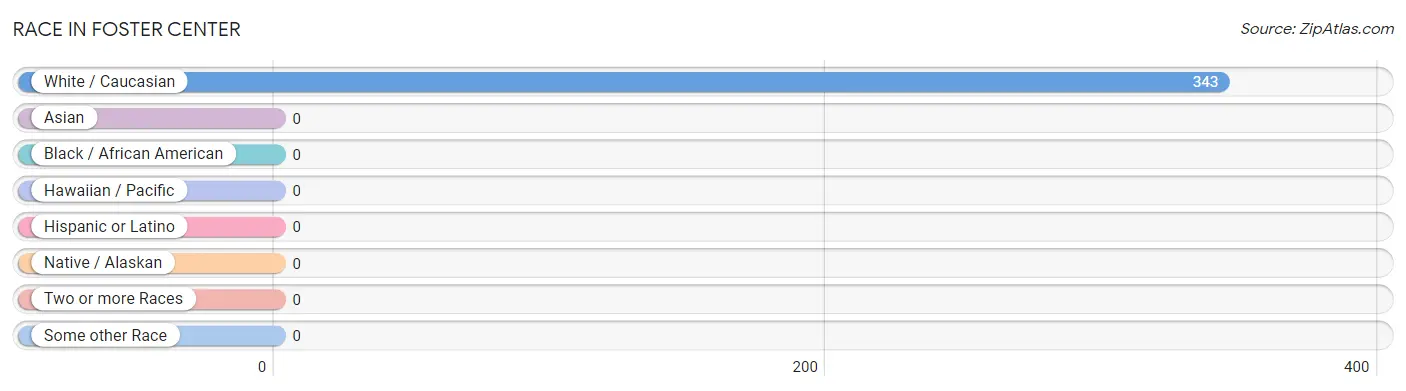
| Race | # Population | % Population |
| Asian | 0 | 0.0% |
| Black / African American | 0 | 0.0% |
| Hawaiian / Pacific | 0 | 0.0% |
| Hispanic or Latino | 0 | 0.0% |
| Native / Alaskan | 0 | 0.0% |
| White / Caucasian | 343 | 100.0% |
| Two or more Races | 0 | 0.0% |
| Some other Race | 0 | 0.0% |
| Total | 343 | 100.0% |
Ancestry in Foster Center
The most populous ancestries reported in Foster Center are Italian (94 | 27.4%), English (70 | 20.4%), Irish (55 | 16.0%), Scottish (37 | 10.8%), and French (22 | 6.4%), together accounting for 81.1% of all Foster Center residents.
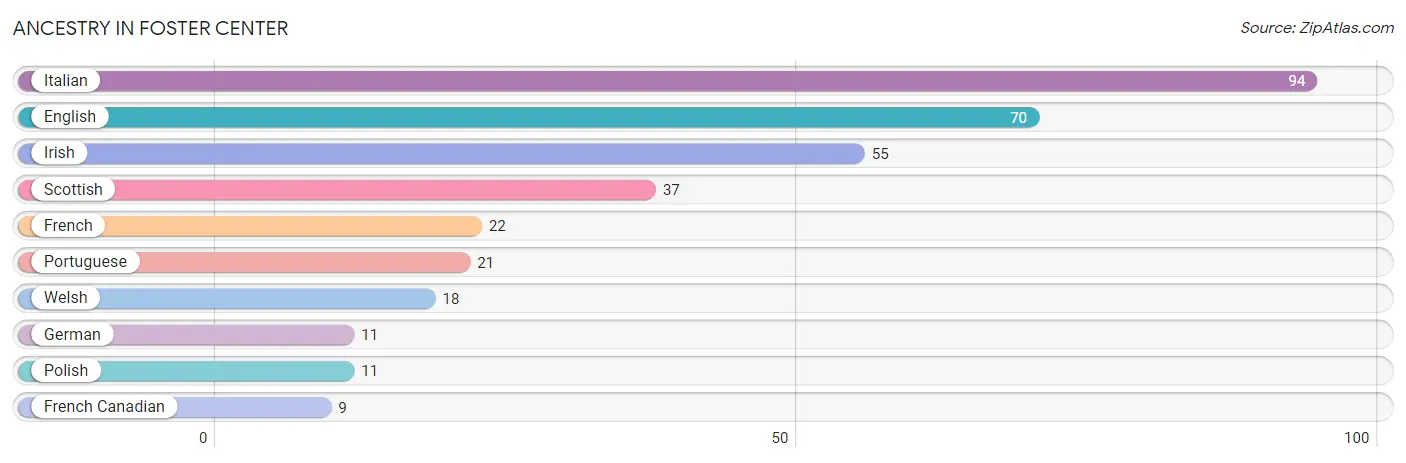
| Ancestry | # Population | % Population |
| English | 70 | 20.4% |
| French | 22 | 6.4% |
| French Canadian | 9 | 2.6% |
| German | 11 | 3.2% |
| Irish | 55 | 16.0% |
| Italian | 94 | 27.4% |
| Polish | 11 | 3.2% |
| Portuguese | 21 | 6.1% |
| Scottish | 37 | 10.8% |
| Welsh | 18 | 5.2% | View All 10 Rows |
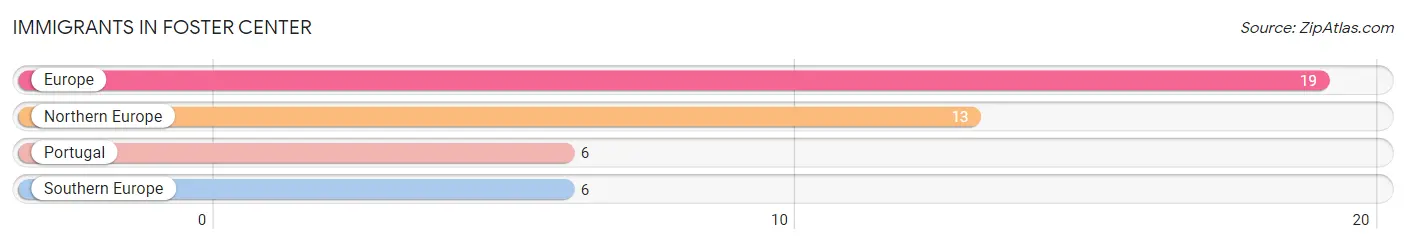
Immigrants in Foster Center
The most numerous immigrant groups reported in Foster Center came from Europe (19 | 5.5%), Northern Europe (13 | 3.8%), Portugal (6 | 1.8%), and Southern Europe (6 | 1.8%), together accounting for 12.8% of all Foster Center residents.
| Immigration Origin | # Population | % Population |
| Europe | 19 | 5.5% |
| Northern Europe | 13 | 3.8% |
| Portugal | 6 | 1.8% |
| Southern Europe | 6 | 1.8% | View All 4 Rows |
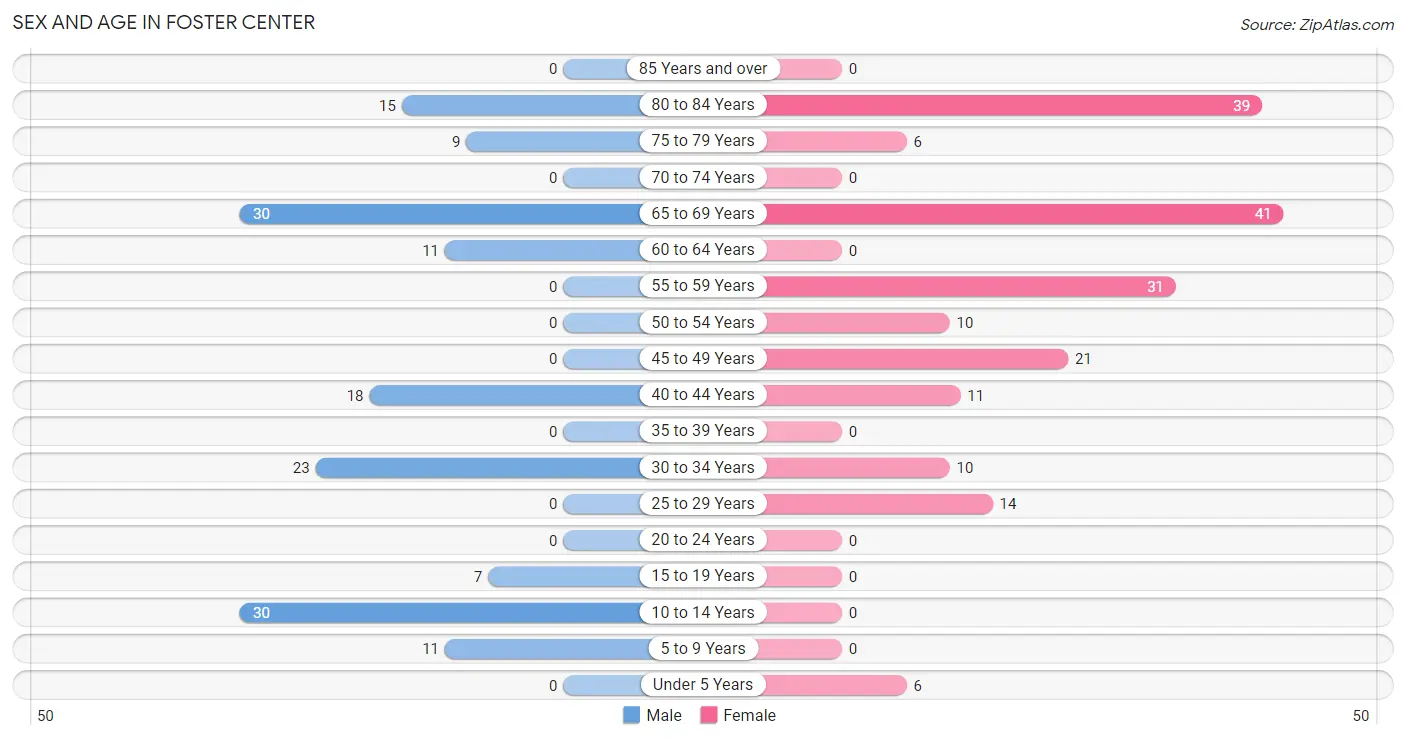
Sex and Age in Foster Center
Sex and Age in Foster Center
The most populous age groups in Foster Center are 10 to 14 Years (30 | 19.5%) for men and 65 to 69 Years (41 | 21.7%) for women.
| Age Bracket | Male | Female |
| Under 5 Years | 0 (0.0%) | 6 (3.2%) |
| 5 to 9 Years | 11 (7.1%) | 0 (0.0%) |
| 10 to 14 Years | 30 (19.5%) | 0 (0.0%) |
| 15 to 19 Years | 7 (4.5%) | 0 (0.0%) |
| 20 to 24 Years | 0 (0.0%) | 0 (0.0%) |
| 25 to 29 Years | 0 (0.0%) | 14 (7.4%) |
| 30 to 34 Years | 23 (14.9%) | 10 (5.3%) |
| 35 to 39 Years | 0 (0.0%) | 0 (0.0%) |
| 40 to 44 Years | 18 (11.7%) | 11 (5.8%) |
| 45 to 49 Years | 0 (0.0%) | 21 (11.1%) |
| 50 to 54 Years | 0 (0.0%) | 10 (5.3%) |
| 55 to 59 Years | 0 (0.0%) | 31 (16.4%) |
| 60 to 64 Years | 11 (7.1%) | 0 (0.0%) |
| 65 to 69 Years | 30 (19.5%) | 41 (21.7%) |
| 70 to 74 Years | 0 (0.0%) | 0 (0.0%) |
| 75 to 79 Years | 9 (5.8%) | 6 (3.2%) |
| 80 to 84 Years | 15 (9.7%) | 39 (20.6%) |
| 85 Years and over | 0 (0.0%) | 0 (0.0%) |
| Total | 154 (100.0%) | 189 (100.0%) |
Families and Households in Foster Center
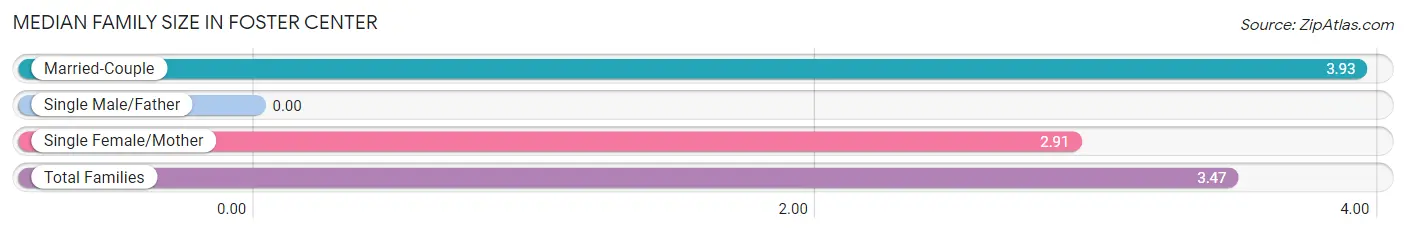
Median Family Size in Foster Center
| Family Type | # Families | Family Size |
| Married-Couple | 28 (54.9%) | 3.93 |
| Single Male/Father | 0 (0.0%) | - |
| Single Female/Mother | 23 (45.1%) | 2.91 |
| Total Families | 51 (100.0%) | 3.47 |
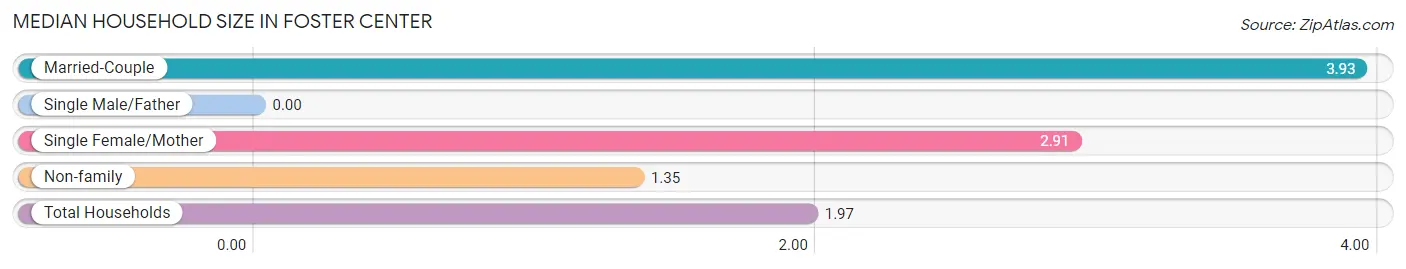
Median Household Size in Foster Center
| Household Type | # Households | Household Size |
| Married-Couple | 28 (16.1%) | 3.93 |
| Single Male/Father | 0 (0.0%) | - |
| Single Female/Mother | 23 (13.2%) | 2.91 |
| Non-family | 123 (70.7%) | 1.35 |
| Total Households | 174 (100.0%) | 1.97 |
Household Size by Marriage Status in Foster Center
Out of a total of 174 households in Foster Center, 51 (29.3%) are family households, while 123 (70.7%) are nonfamily households. The most numerous type of family households are 3-person households, comprising 20, and the most common type of nonfamily households are 1-person households, comprising 81.
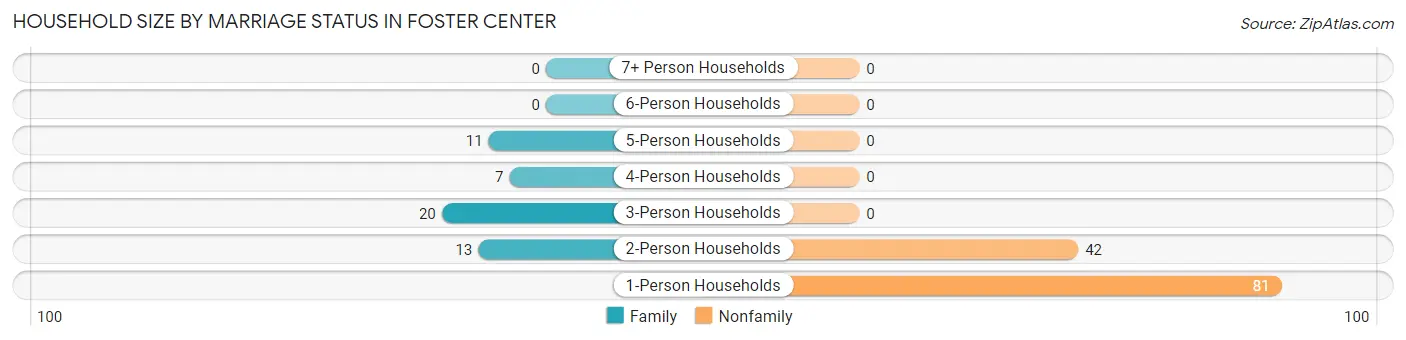
| Household Size | Family Households | Nonfamily Households |
| 1-Person Households | - | 81 (46.6%) |
| 2-Person Households | 13 (7.5%) | 42 (24.1%) |
| 3-Person Households | 20 (11.5%) | 0 (0.0%) |
| 4-Person Households | 7 (4.0%) | 0 (0.0%) |
| 5-Person Households | 11 (6.3%) | 0 (0.0%) |
| 6-Person Households | 0 (0.0%) | 0 (0.0%) |
| 7+ Person Households | 0 (0.0%) | 0 (0.0%) |
| Total | 51 (29.3%) | 123 (70.7%) |
Female Fertility in Foster Center
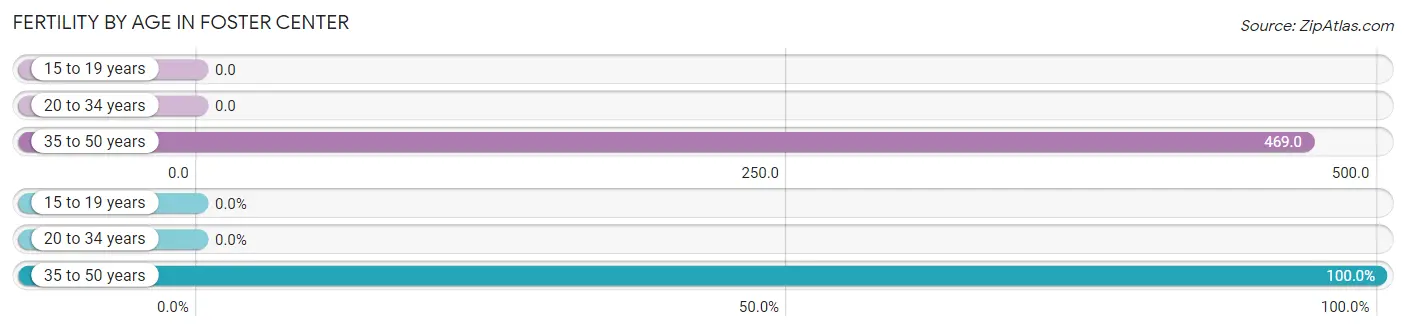
Fertility by Age in Foster Center
Average fertility rate in Foster Center is 268.0 births per 1,000 women. Women in the age bracket of 35 to 50 years have the highest fertility rate with 469.0 births per 1,000 women. Women in the age bracket of 35 to 50 years acount for 100.0% of all women with births.
| Age Bracket | Women with Births | Births / 1,000 Women |
| 15 to 19 years | 0 (0.0%) | 0.0 |
| 20 to 34 years | 0 (0.0%) | 0.0 |
| 35 to 50 years | 15 (100.0%) | 469.0 |
| Total | 15 (100.0%) | 268.0 |
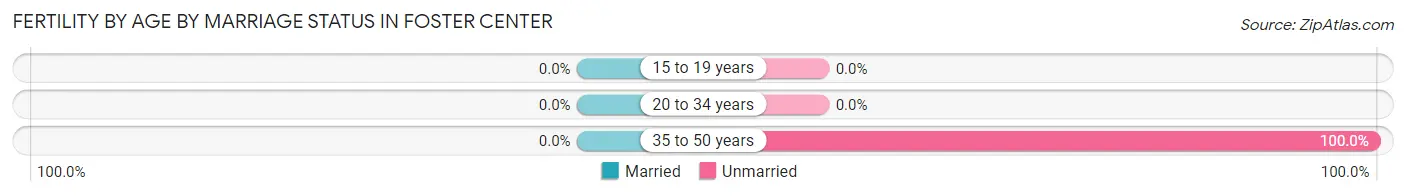
Fertility by Age by Marriage Status in Foster Center
| Age Bracket | Married | Unmarried |
| 15 to 19 years | 0 (0.0%) | 0 (0.0%) |
| 20 to 34 years | 0 (0.0%) | 0 (0.0%) |
| 35 to 50 years | 0 (0.0%) | 15 (100.0%) |
| Total | 0 (0.0%) | 15 (100.0%) |
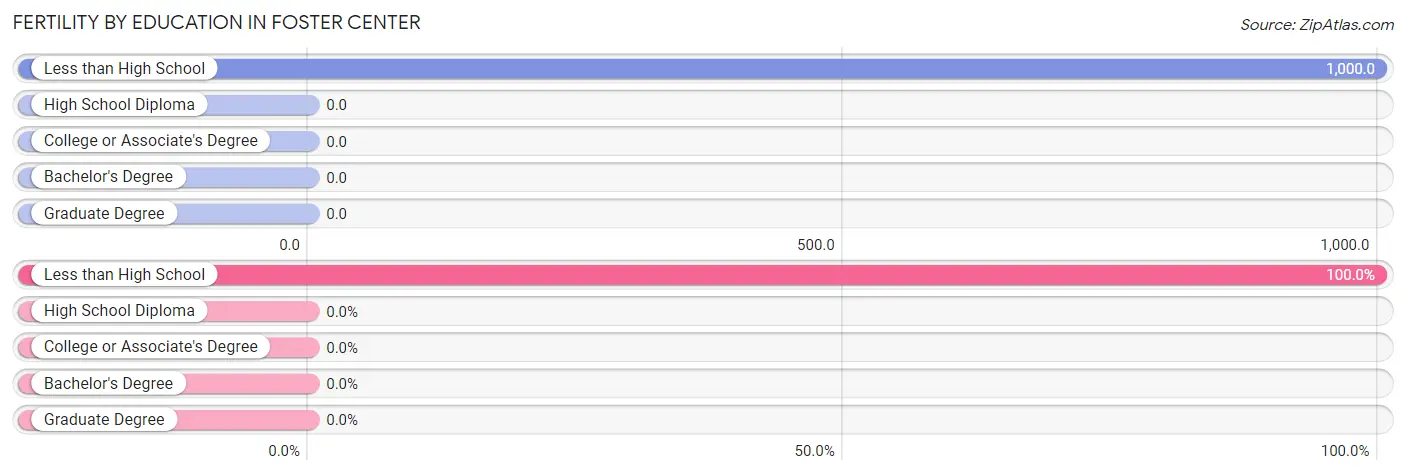
Fertility by Education in Foster Center
| Educational Attainment | Women with Births | Births / 1,000 Women |
| Less than High School | 15 (100.0%) | 1,000.0 |
| High School Diploma | 0 (0.0%) | 0.0 |
| College or Associate's Degree | 0 (0.0%) | 0.0 |
| Bachelor's Degree | 0 (0.0%) | 0.0 |
| Graduate Degree | 0 (0.0%) | 0.0 |
| Total | 15 (100.0%) | 268.0 |
Fertility by Education by Marriage Status in Foster Center
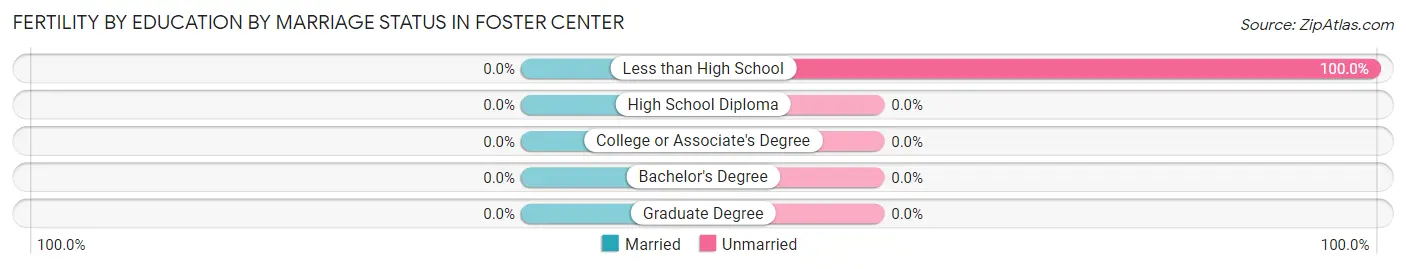
| Educational Attainment | Married | Unmarried |
| Less than High School | 0 (0.0%) | 15 (100.0%) |
| High School Diploma | 0 (0.0%) | 0 (0.0%) |
| College or Associate's Degree | 0 (0.0%) | 0 (0.0%) |
| Bachelor's Degree | 0 (0.0%) | 0 (0.0%) |
| Graduate Degree | 0 (0.0%) | 0 (0.0%) |
| Total | 0 (0.0%) | 15 (100.0%) |
Employment Characteristics in Foster Center
Employment by Class of Employer in Foster Center
Among the 121 employed individuals in Foster Center, private company employees (86 | 71.1%), state government employees (24 | 19.8%), and local government employees (11 | 9.1%) make up the most common classes of employment.
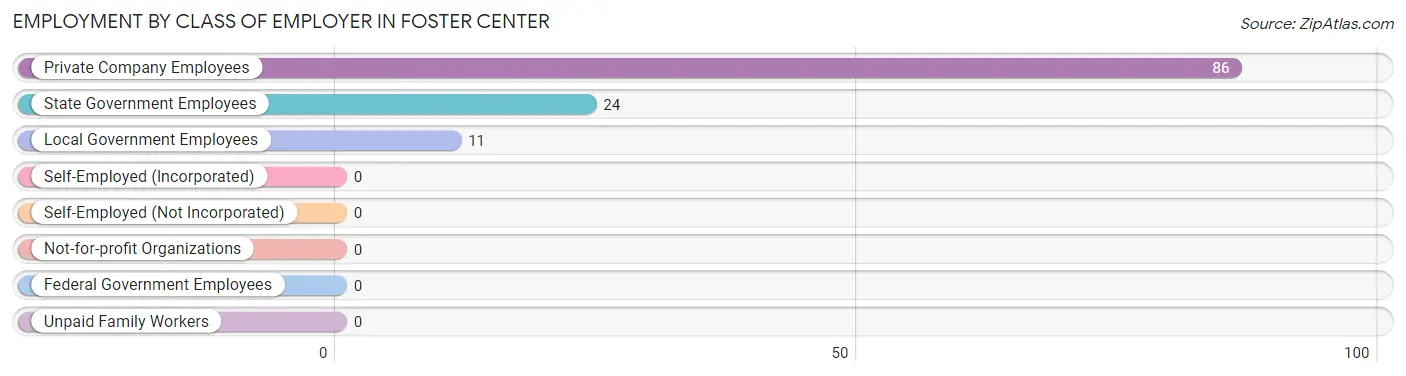
| Employer Class | # Employees | % Employees |
| Private Company Employees | 86 | 71.1% |
| Self-Employed (Incorporated) | 0 | 0.0% |
| Self-Employed (Not Incorporated) | 0 | 0.0% |
| Not-for-profit Organizations | 0 | 0.0% |
| Local Government Employees | 11 | 9.1% |
| State Government Employees | 24 | 19.8% |
| Federal Government Employees | 0 | 0.0% |
| Unpaid Family Workers | 0 | 0.0% |
| Total | 121 | 100.0% |
Employment Status by Age in Foster Center
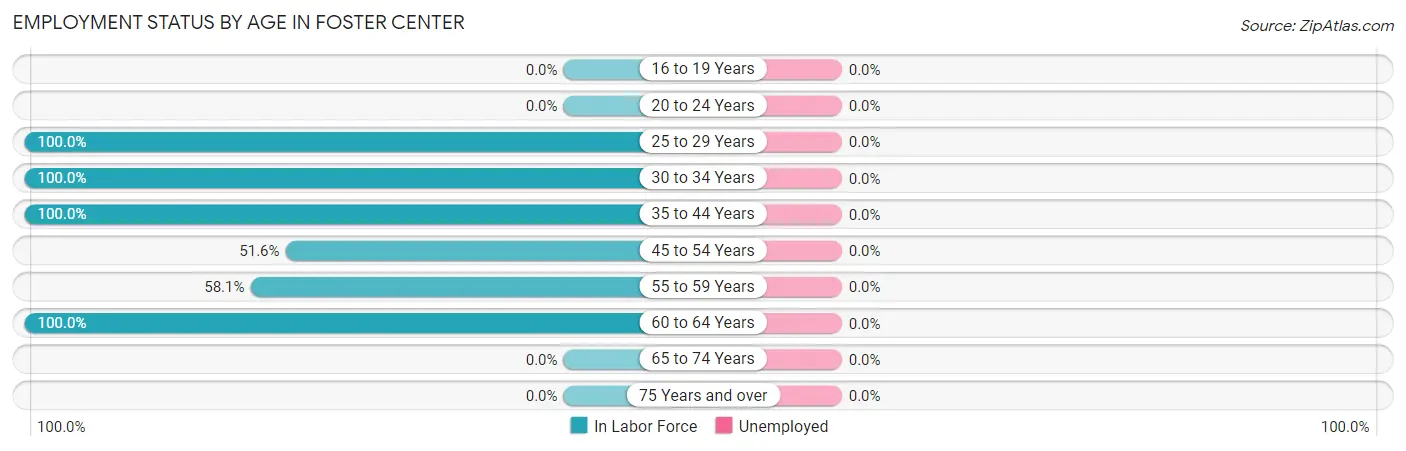
| Age Bracket | In Labor Force | Unemployed |
| 16 to 19 Years | 0 (0.0%) | 0 (0.0%) |
| 20 to 24 Years | 0 (0.0%) | 0 (0.0%) |
| 25 to 29 Years | 14 (100.0%) | 0 (0.0%) |
| 30 to 34 Years | 33 (100.0%) | 0 (0.0%) |
| 35 to 44 Years | 29 (100.0%) | 0 (0.0%) |
| 45 to 54 Years | 16 (51.6%) | 0 (0.0%) |
| 55 to 59 Years | 18 (58.1%) | 0 (0.0%) |
| 60 to 64 Years | 11 (100.0%) | 0 (0.0%) |
| 65 to 74 Years | 0 (0.0%) | 0 (0.0%) |
| 75 Years and over | 0 (0.0%) | 0 (0.0%) |
| Total | 121 (41.9%) | 0 (0.0%) |
Employment Status by Educational Attainment in Foster Center
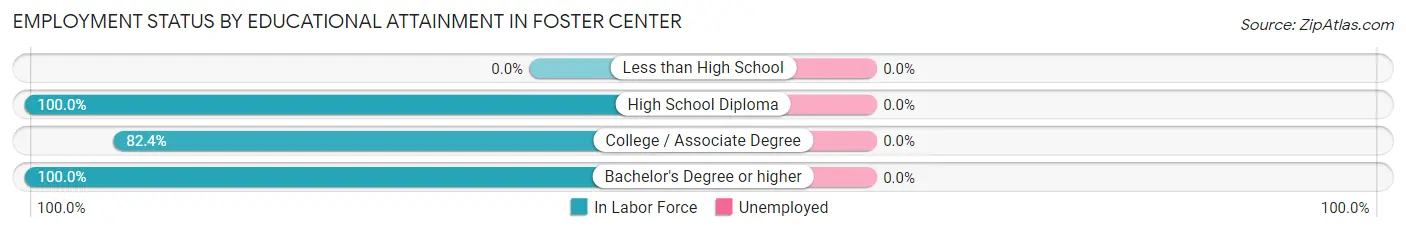
| Educational Attainment | In Labor Force | Unemployed |
| Less than High School | 0 (0.0%) | 0 (0.0%) |
| High School Diploma | 38 (100.0%) | 0 (0.0%) |
| College / Associate Degree | 61 (82.4%) | 0 (0.0%) |
| Bachelor's Degree or higher | 22 (100.0%) | 0 (0.0%) |
| Total | 121 (81.2%) | 0 (0.0%) |
Employment Occupations by Sex in Foster Center
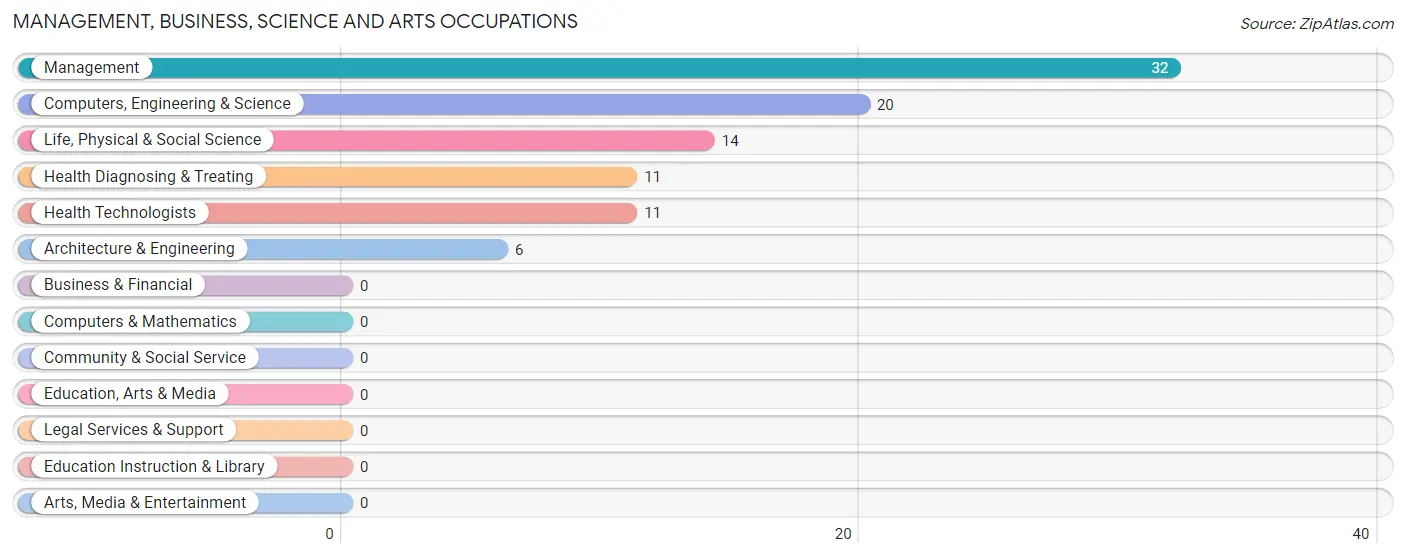
Management, Business, Science and Arts Occupations
The most common Management, Business, Science and Arts occupations in Foster Center are Management (32 | 26.5%), Computers, Engineering & Science (20 | 16.5%), Life, Physical & Social Science (14 | 11.6%), Health Diagnosing & Treating (11 | 9.1%), and Health Technologists (11 | 9.1%).
Management, Business, Science and Arts Occupations by Sex
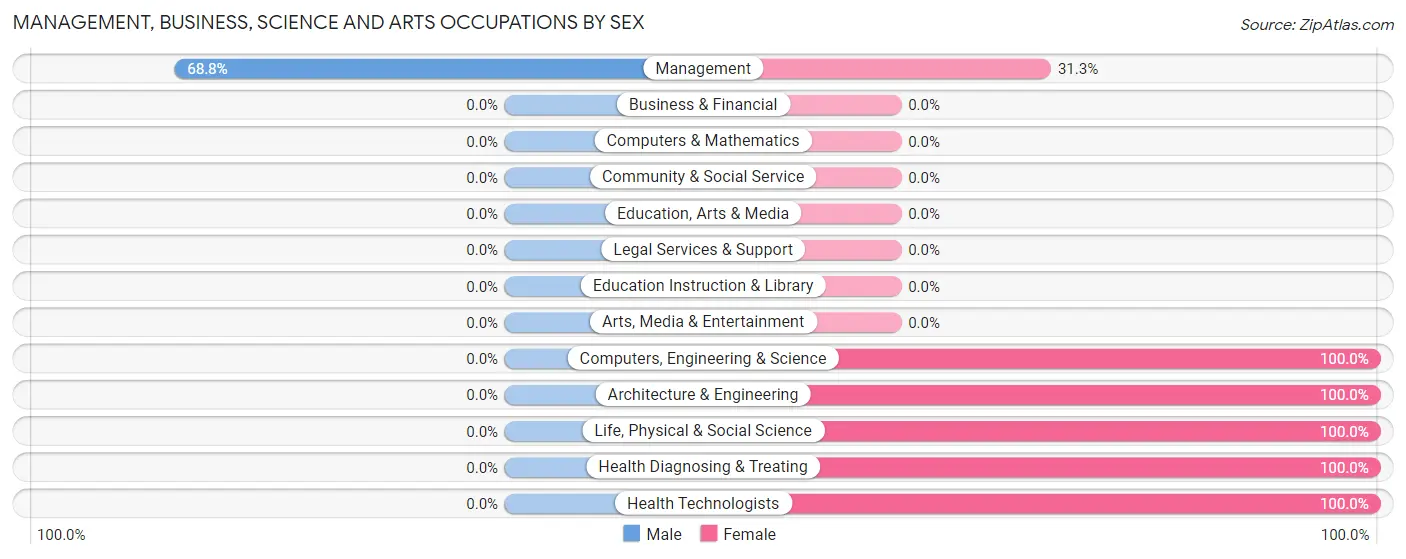
| Occupation | Male | Female |
| Management | 22 (68.8%) | 10 (31.2%) |
| Business & Financial | 0 (0.0%) | 0 (0.0%) |
| Computers, Engineering & Science | 0 (0.0%) | 20 (100.0%) |
| Computers & Mathematics | 0 (0.0%) | 0 (0.0%) |
| Architecture & Engineering | 0 (0.0%) | 6 (100.0%) |
| Life, Physical & Social Science | 0 (0.0%) | 14 (100.0%) |
| Community & Social Service | 0 (0.0%) | 0 (0.0%) |
| Education, Arts & Media | 0 (0.0%) | 0 (0.0%) |
| Legal Services & Support | 0 (0.0%) | 0 (0.0%) |
| Education Instruction & Library | 0 (0.0%) | 0 (0.0%) |
| Arts, Media & Entertainment | 0 (0.0%) | 0 (0.0%) |
| Health Diagnosing & Treating | 0 (0.0%) | 11 (100.0%) |
| Health Technologists | 0 (0.0%) | 11 (100.0%) |
| Total (Category) | 22 (34.9%) | 41 (65.1%) |
| Total (Overall) | 52 (43.0%) | 69 (57.0%) |
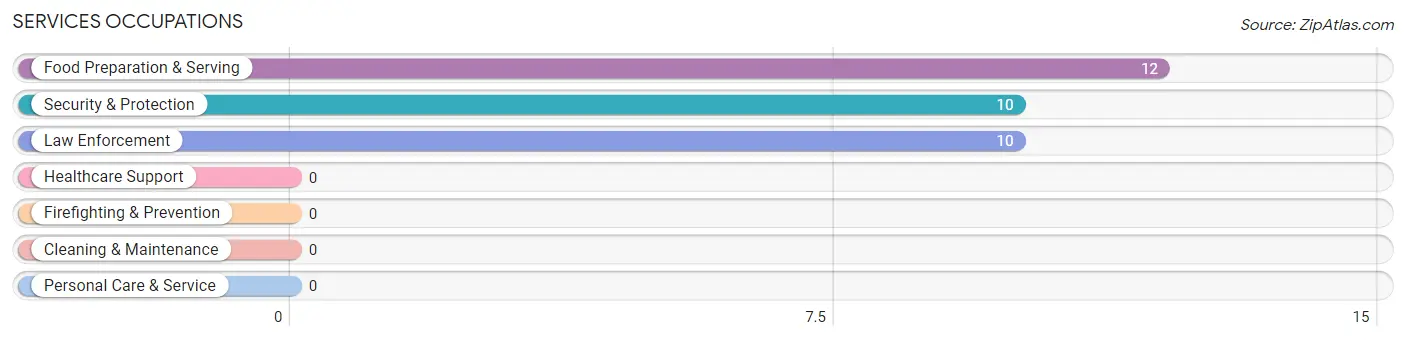
Services Occupations
The most common Services occupations in Foster Center are Food Preparation & Serving (12 | 9.9%), Security & Protection (10 | 8.3%), and Law Enforcement (10 | 8.3%).
Services Occupations by Sex
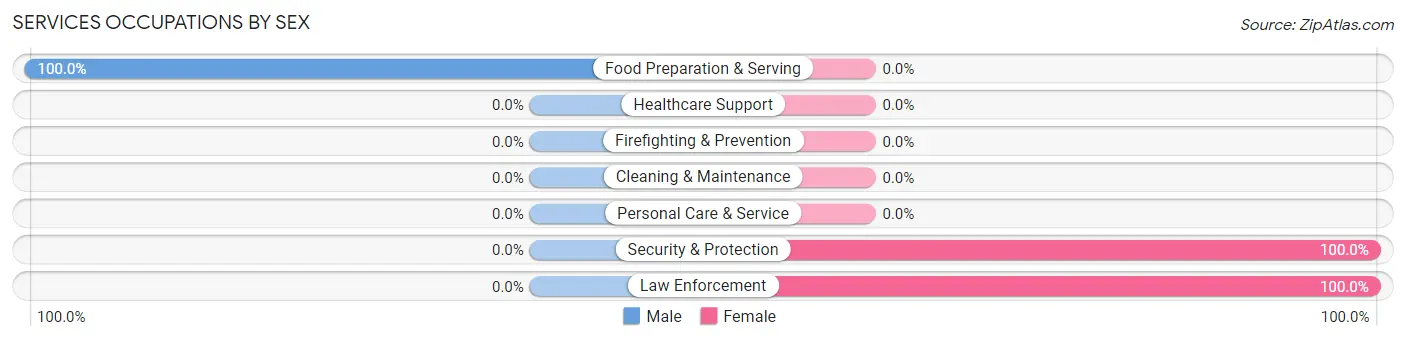
| Occupation | Male | Female |
| Healthcare Support | 0 (0.0%) | 0 (0.0%) |
| Security & Protection | 0 (0.0%) | 10 (100.0%) |
| Firefighting & Prevention | 0 (0.0%) | 0 (0.0%) |
| Law Enforcement | 0 (0.0%) | 10 (100.0%) |
| Food Preparation & Serving | 12 (100.0%) | 0 (0.0%) |
| Cleaning & Maintenance | 0 (0.0%) | 0 (0.0%) |
| Personal Care & Service | 0 (0.0%) | 0 (0.0%) |
| Total (Category) | 12 (54.5%) | 10 (45.5%) |
| Total (Overall) | 52 (43.0%) | 69 (57.0%) |
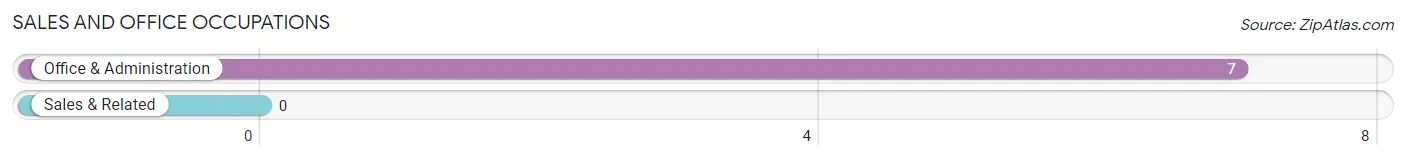
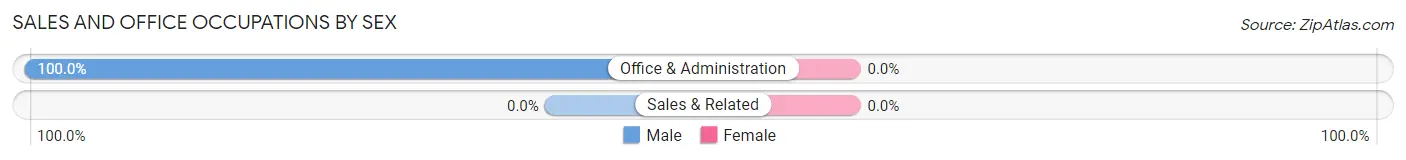
Sales and Office Occupations
The most common Sales and Office occupations in Foster Center are , and Office & Administration (7 | 5.8%).
Sales and Office Occupations by Sex
| Occupation | Male | Female |
| Sales & Related | 0 (0.0%) | 0 (0.0%) |
| Office & Administration | 7 (100.0%) | 0 (0.0%) |
| Total (Category) | 7 (100.0%) | 0 (0.0%) |
| Total (Overall) | 52 (43.0%) | 69 (57.0%) |
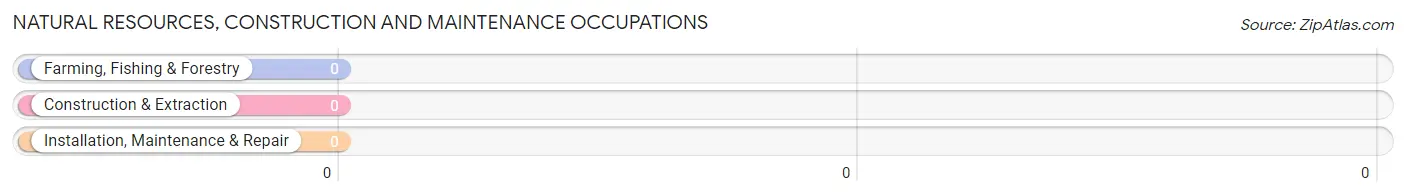
Natural Resources, Construction and Maintenance Occupations
Natural Resources, Construction and Maintenance Occupations by Sex
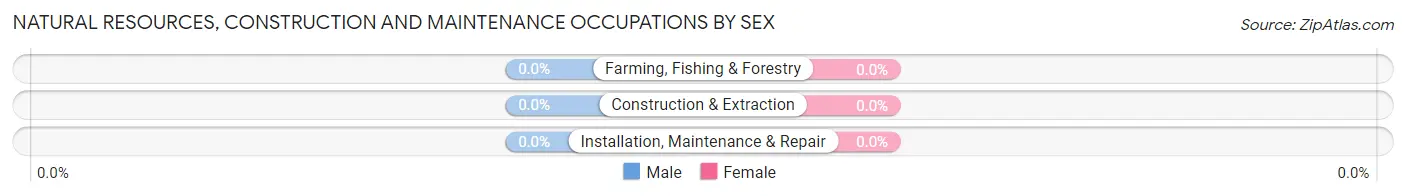
| Occupation | Male | Female |
| Farming, Fishing & Forestry | 0 (0.0%) | 0 (0.0%) |
| Construction & Extraction | 0 (0.0%) | 0 (0.0%) |
| Installation, Maintenance & Repair | 0 (0.0%) | 0 (0.0%) |
| Total (Category) | 0 (0.0%) | 0 (0.0%) |
| Total (Overall) | 52 (43.0%) | 69 (57.0%) |
Production, Transportation and Moving Occupations
The most common Production, Transportation and Moving occupations in Foster Center are Material Moving (18 | 14.9%), and Production (11 | 9.1%).
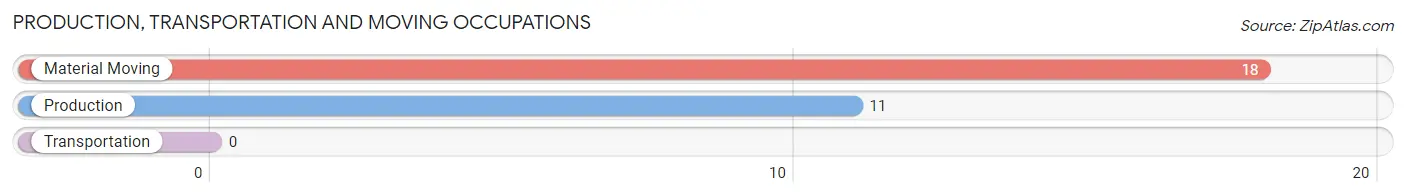
Production, Transportation and Moving Occupations by Sex
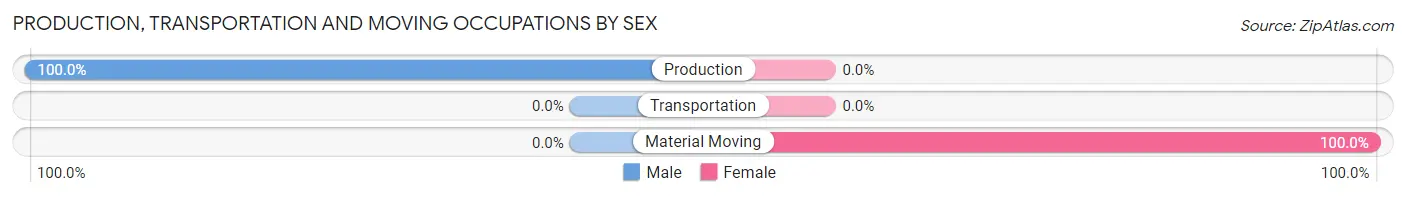
| Occupation | Male | Female |
| Production | 11 (100.0%) | 0 (0.0%) |
| Transportation | 0 (0.0%) | 0 (0.0%) |
| Material Moving | 0 (0.0%) | 18 (100.0%) |
| Total (Category) | 11 (37.9%) | 18 (62.1%) |
| Total (Overall) | 52 (43.0%) | 69 (57.0%) |
Employment Industries by Sex in Foster Center
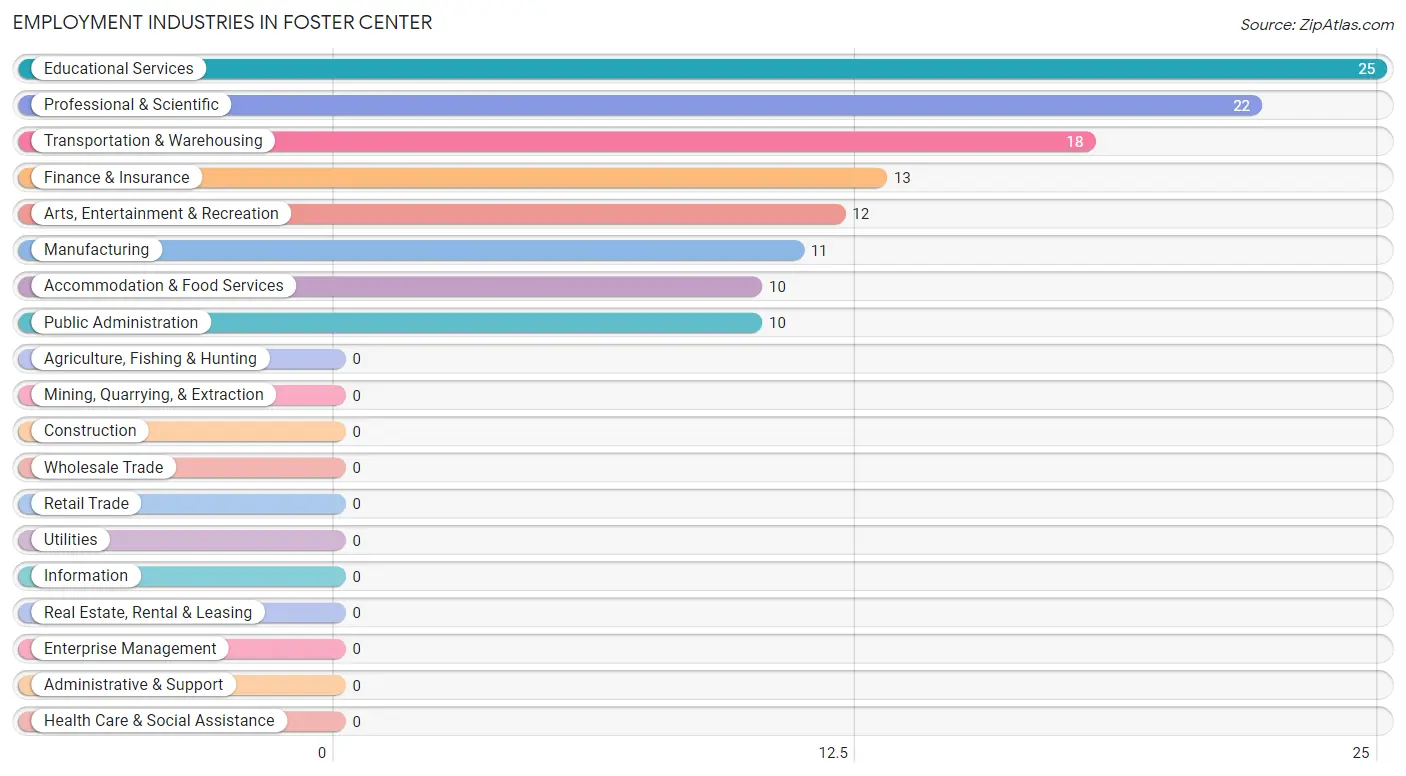
Employment Industries in Foster Center
The major employment industries in Foster Center include Educational Services (25 | 20.7%), Professional & Scientific (22 | 18.2%), Transportation & Warehousing (18 | 14.9%), Finance & Insurance (13 | 10.7%), and Arts, Entertainment & Recreation (12 | 9.9%).
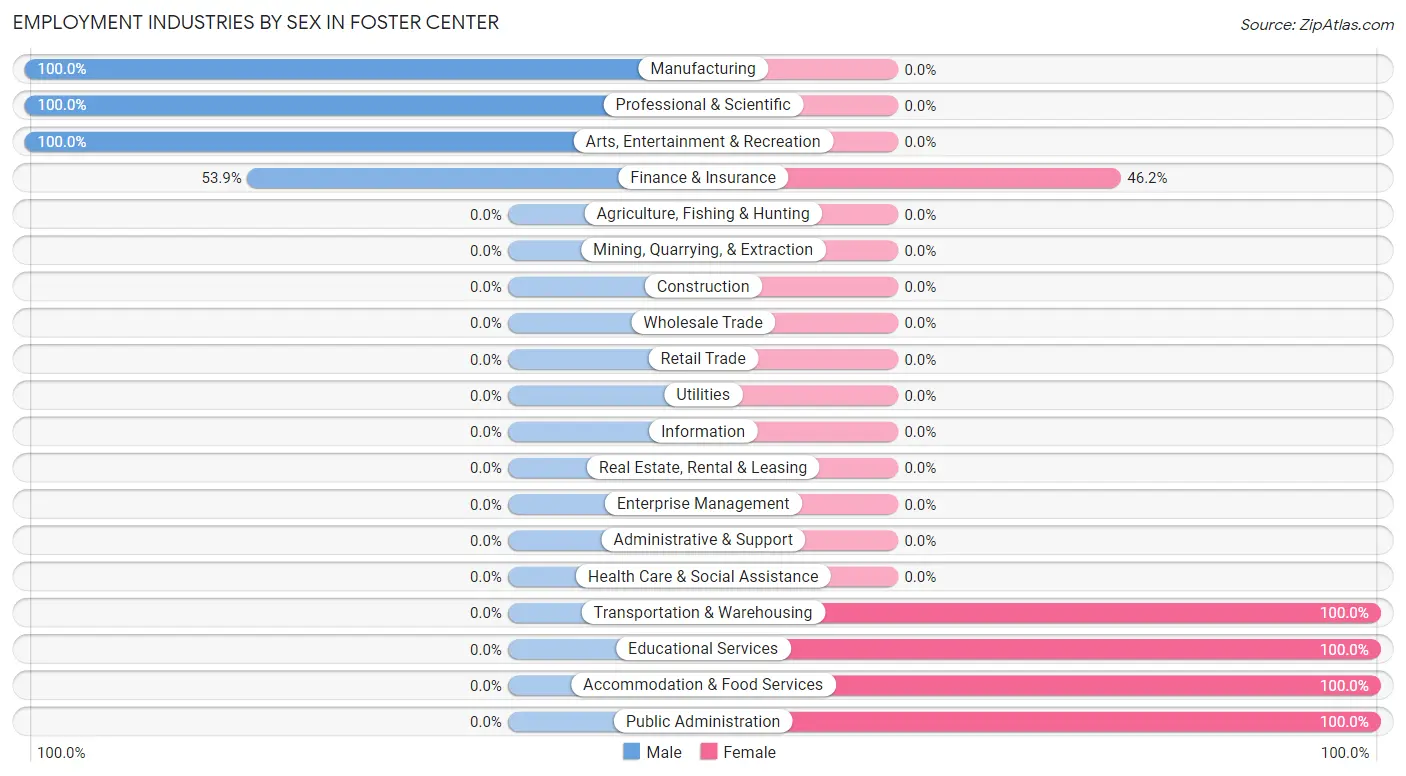
Employment Industries by Sex in Foster Center
The Foster Center industries that see more men than women are Manufacturing (100.0%), Professional & Scientific (100.0%), and Arts, Entertainment & Recreation (100.0%), whereas the industries that tend to have a higher number of women are Transportation & Warehousing (100.0%), Educational Services (100.0%), and Accommodation & Food Services (100.0%).
| Industry | Male | Female |
| Agriculture, Fishing & Hunting | 0 (0.0%) | 0 (0.0%) |
| Mining, Quarrying, & Extraction | 0 (0.0%) | 0 (0.0%) |
| Construction | 0 (0.0%) | 0 (0.0%) |
| Manufacturing | 11 (100.0%) | 0 (0.0%) |
| Wholesale Trade | 0 (0.0%) | 0 (0.0%) |
| Retail Trade | 0 (0.0%) | 0 (0.0%) |
| Transportation & Warehousing | 0 (0.0%) | 18 (100.0%) |
| Utilities | 0 (0.0%) | 0 (0.0%) |
| Information | 0 (0.0%) | 0 (0.0%) |
| Finance & Insurance | 7 (53.8%) | 6 (46.2%) |
| Real Estate, Rental & Leasing | 0 (0.0%) | 0 (0.0%) |
| Professional & Scientific | 22 (100.0%) | 0 (0.0%) |
| Enterprise Management | 0 (0.0%) | 0 (0.0%) |
| Administrative & Support | 0 (0.0%) | 0 (0.0%) |
| Educational Services | 0 (0.0%) | 25 (100.0%) |
| Health Care & Social Assistance | 0 (0.0%) | 0 (0.0%) |
| Arts, Entertainment & Recreation | 12 (100.0%) | 0 (0.0%) |
| Accommodation & Food Services | 0 (0.0%) | 10 (100.0%) |
| Public Administration | 0 (0.0%) | 10 (100.0%) |
| Total | 52 (43.0%) | 69 (57.0%) |
Education in Foster Center
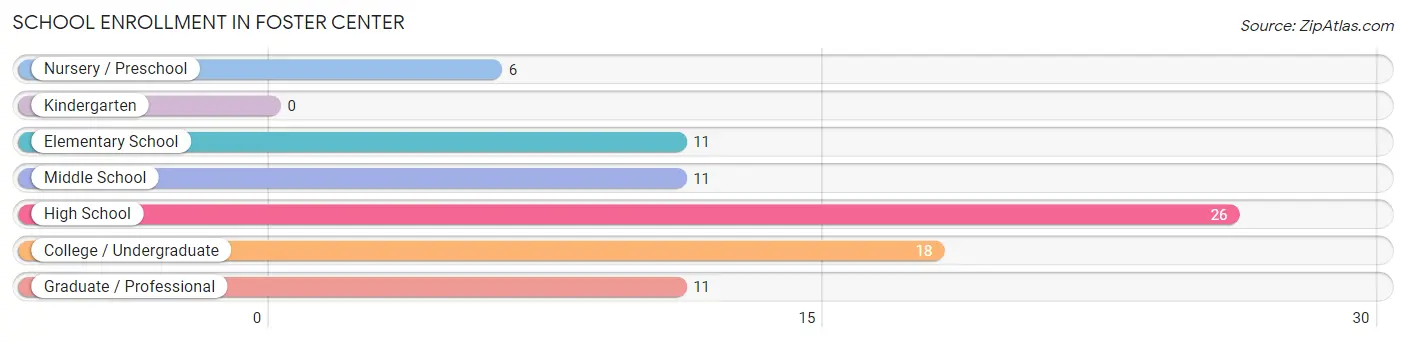
School Enrollment in Foster Center
The most common levels of schooling among the 83 students in Foster Center are high school (26 | 31.3%), college / undergraduate (18 | 21.7%), and elementary school (11 | 13.3%).
| School Level | # Students | % Students |
| Nursery / Preschool | 6 | 7.2% |
| Kindergarten | 0 | 0.0% |
| Elementary School | 11 | 13.3% |
| Middle School | 11 | 13.3% |
| High School | 26 | 31.3% |
| College / Undergraduate | 18 | 21.7% |
| Graduate / Professional | 11 | 13.3% |
| Total | 83 | 100.0% |
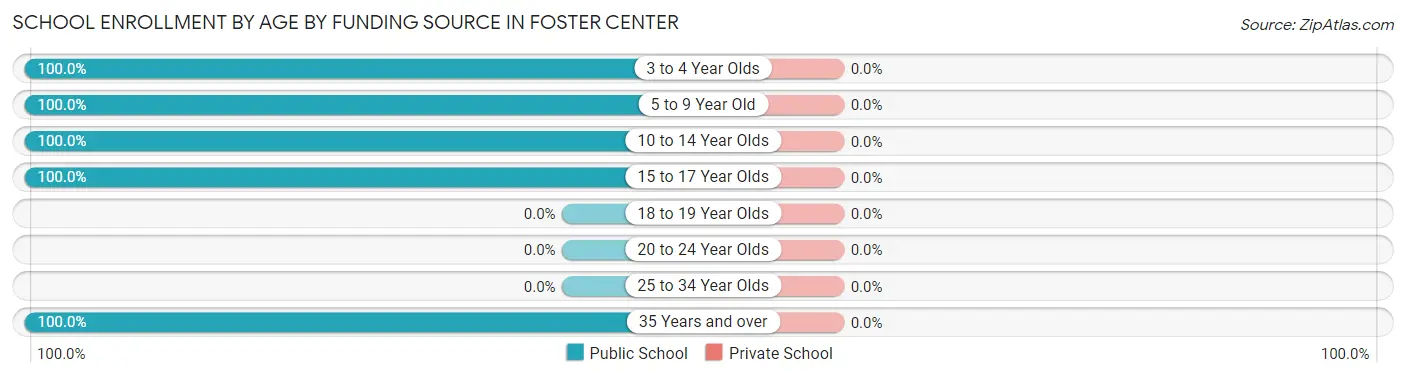
School Enrollment by Age by Funding Source in Foster Center
| Age Bracket | Public School | Private School |
| 3 to 4 Year Olds | 6 (100.0%) | 0 (0.0%) |
| 5 to 9 Year Old | 11 (100.0%) | 0 (0.0%) |
| 10 to 14 Year Olds | 30 (100.0%) | 0 (0.0%) |
| 15 to 17 Year Olds | 7 (100.0%) | 0 (0.0%) |
| 18 to 19 Year Olds | 0 (0.0%) | 0 (0.0%) |
| 20 to 24 Year Olds | 0 (0.0%) | 0 (0.0%) |
| 25 to 34 Year Olds | 0 (0.0%) | 0 (0.0%) |
| 35 Years and over | 29 (100.0%) | 0 (0.0%) |
| Total | 83 (100.0%) | 0 (0.0%) |
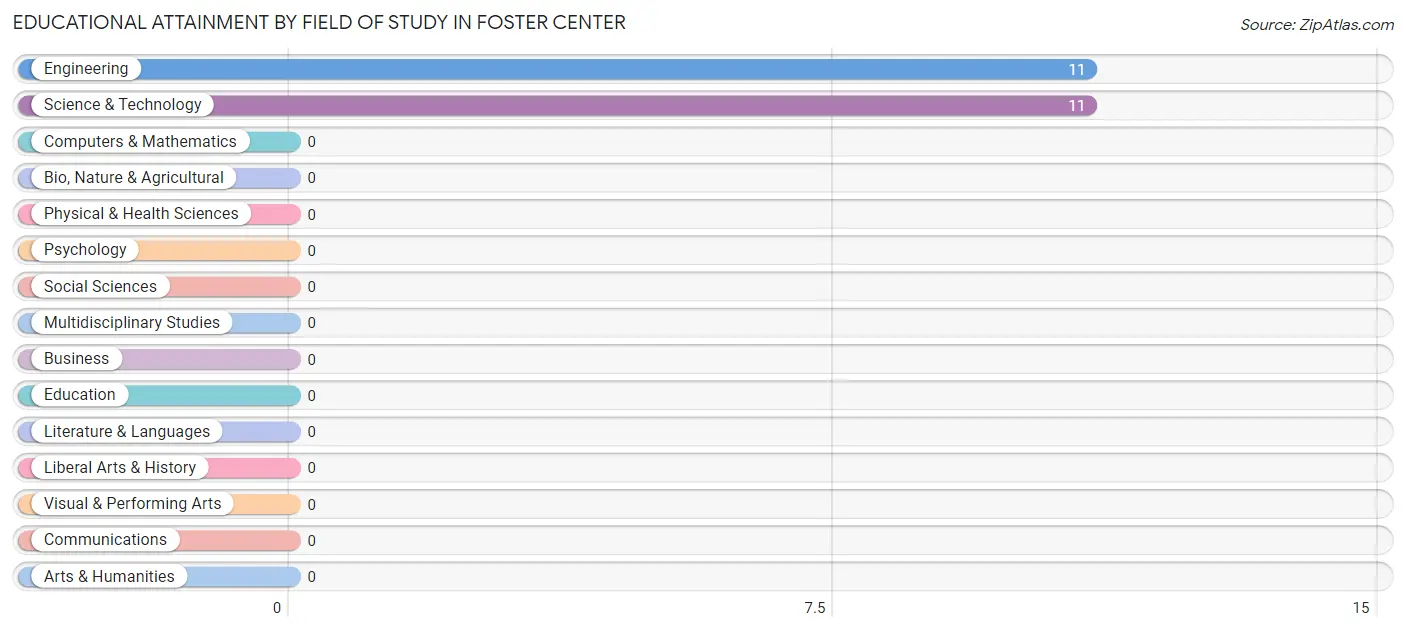
Educational Attainment by Field of Study in Foster Center
Engineering (11 | 50.0%), and science & technology (11 | 50.0%) are the most common fields of study among 22 individuals in Foster Center who have obtained a bachelor's degree or higher.
| Field of Study | # Graduates | % Graduates |
| Computers & Mathematics | 0 | 0.0% |
| Bio, Nature & Agricultural | 0 | 0.0% |
| Physical & Health Sciences | 0 | 0.0% |
| Psychology | 0 | 0.0% |
| Social Sciences | 0 | 0.0% |
| Engineering | 11 | 50.0% |
| Multidisciplinary Studies | 0 | 0.0% |
| Science & Technology | 11 | 50.0% |
| Business | 0 | 0.0% |
| Education | 0 | 0.0% |
| Literature & Languages | 0 | 0.0% |
| Liberal Arts & History | 0 | 0.0% |
| Visual & Performing Arts | 0 | 0.0% |
| Communications | 0 | 0.0% |
| Arts & Humanities | 0 | 0.0% |
| Total | 22 | 100.0% |
Transportation & Commute in Foster Center
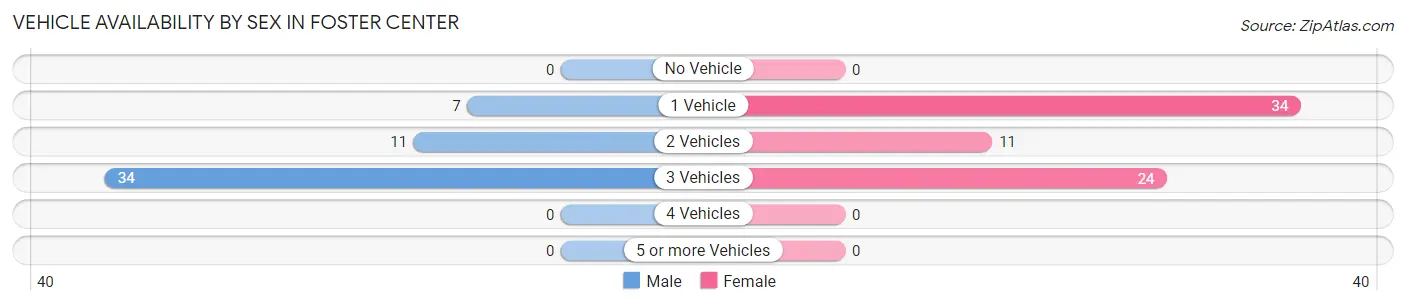
Vehicle Availability by Sex in Foster Center
The most prevalent vehicle ownership categories in Foster Center are males with 3 vehicles (34, accounting for 65.4%) and females with 3 vehicles (24, making up 49.3%).
| Vehicles Available | Male | Female |
| No Vehicle | 0 (0.0%) | 0 (0.0%) |
| 1 Vehicle | 7 (13.5%) | 34 (49.3%) |
| 2 Vehicles | 11 (21.1%) | 11 (15.9%) |
| 3 Vehicles | 34 (65.4%) | 24 (34.8%) |
| 4 Vehicles | 0 (0.0%) | 0 (0.0%) |
| 5 or more Vehicles | 0 (0.0%) | 0 (0.0%) |
| Total | 52 (100.0%) | 69 (100.0%) |
Commute Time in Foster Center
The most frequently occuring commute durations in Foster Center are 30 to 34 minutes (51 commuters, 46.4%), 90 or more minutes (22 commuters, 20.0%), and 20 to 24 minutes (21 commuters, 19.1%).
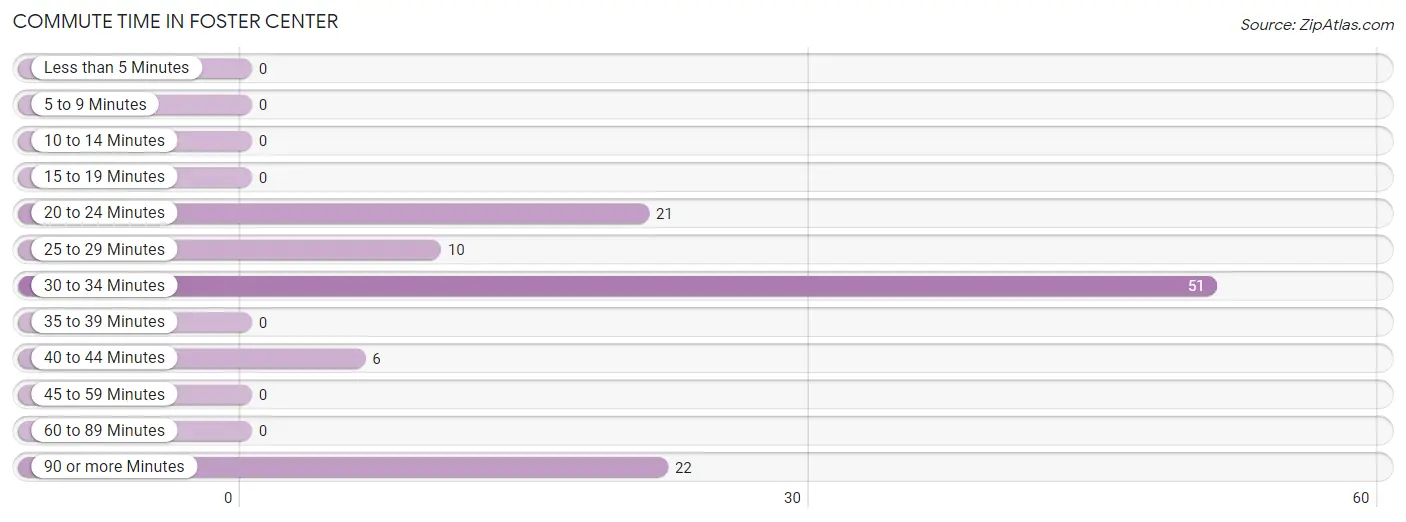
| Commute Time | # Commuters | % Commuters |
| Less than 5 Minutes | 0 | 0.0% |
| 5 to 9 Minutes | 0 | 0.0% |
| 10 to 14 Minutes | 0 | 0.0% |
| 15 to 19 Minutes | 0 | 0.0% |
| 20 to 24 Minutes | 21 | 19.1% |
| 25 to 29 Minutes | 10 | 9.1% |
| 30 to 34 Minutes | 51 | 46.4% |
| 35 to 39 Minutes | 0 | 0.0% |
| 40 to 44 Minutes | 6 | 5.4% |
| 45 to 59 Minutes | 0 | 0.0% |
| 60 to 89 Minutes | 0 | 0.0% |
| 90 or more Minutes | 22 | 20.0% |
Commute Time by Sex in Foster Center
The most common commute times in Foster Center are 90 or more minutes (22 commuters, 53.7%) for males and 30 to 34 minutes (39 commuters, 56.5%) for females.
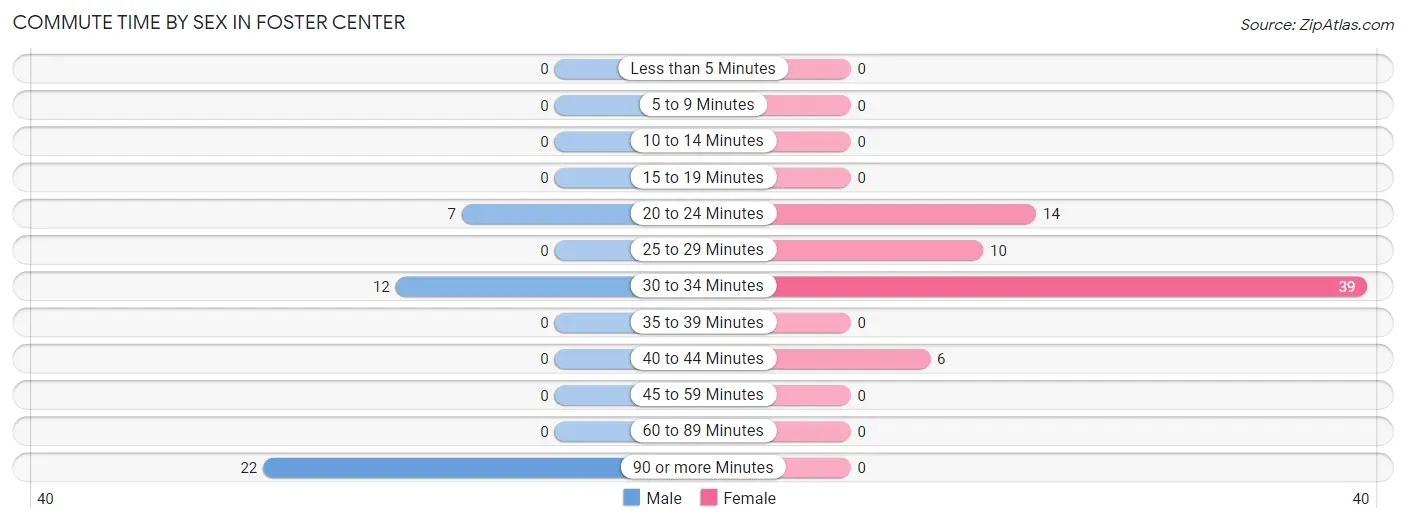
| Commute Time | Male | Female |
| Less than 5 Minutes | 0 (0.0%) | 0 (0.0%) |
| 5 to 9 Minutes | 0 (0.0%) | 0 (0.0%) |
| 10 to 14 Minutes | 0 (0.0%) | 0 (0.0%) |
| 15 to 19 Minutes | 0 (0.0%) | 0 (0.0%) |
| 20 to 24 Minutes | 7 (17.1%) | 14 (20.3%) |
| 25 to 29 Minutes | 0 (0.0%) | 10 (14.5%) |
| 30 to 34 Minutes | 12 (29.3%) | 39 (56.5%) |
| 35 to 39 Minutes | 0 (0.0%) | 0 (0.0%) |
| 40 to 44 Minutes | 0 (0.0%) | 6 (8.7%) |
| 45 to 59 Minutes | 0 (0.0%) | 0 (0.0%) |
| 60 to 89 Minutes | 0 (0.0%) | 0 (0.0%) |
| 90 or more Minutes | 22 (53.7%) | 0 (0.0%) |
Time of Departure to Work by Sex in Foster Center
The most frequent times of departure to work in Foster Center are 8:30 AM to 8:59 AM (18, 43.9%) for males and 12:00 PM to 3:59 PM (18, 26.1%) for females.
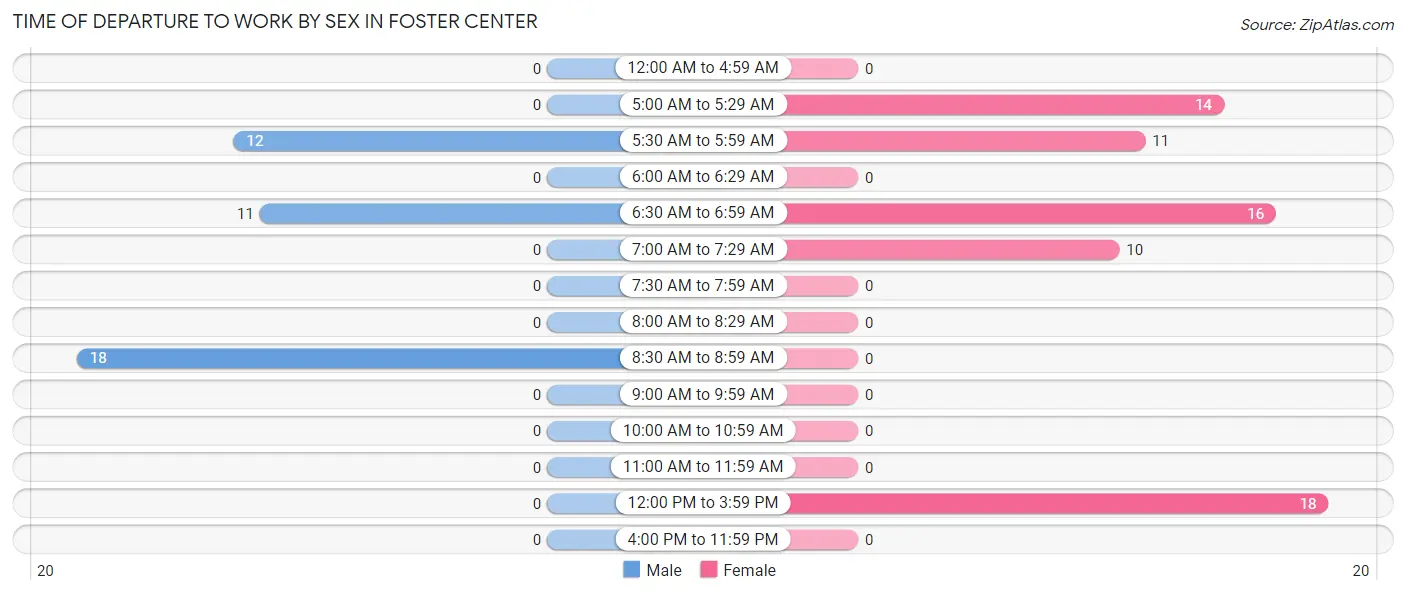
| Time of Departure | Male | Female |
| 12:00 AM to 4:59 AM | 0 (0.0%) | 0 (0.0%) |
| 5:00 AM to 5:29 AM | 0 (0.0%) | 14 (20.3%) |
| 5:30 AM to 5:59 AM | 12 (29.3%) | 11 (15.9%) |
| 6:00 AM to 6:29 AM | 0 (0.0%) | 0 (0.0%) |
| 6:30 AM to 6:59 AM | 11 (26.8%) | 16 (23.2%) |
| 7:00 AM to 7:29 AM | 0 (0.0%) | 10 (14.5%) |
| 7:30 AM to 7:59 AM | 0 (0.0%) | 0 (0.0%) |
| 8:00 AM to 8:29 AM | 0 (0.0%) | 0 (0.0%) |
| 8:30 AM to 8:59 AM | 18 (43.9%) | 0 (0.0%) |
| 9:00 AM to 9:59 AM | 0 (0.0%) | 0 (0.0%) |
| 10:00 AM to 10:59 AM | 0 (0.0%) | 0 (0.0%) |
| 11:00 AM to 11:59 AM | 0 (0.0%) | 0 (0.0%) |
| 12:00 PM to 3:59 PM | 0 (0.0%) | 18 (26.1%) |
| 4:00 PM to 11:59 PM | 0 (0.0%) | 0 (0.0%) |
| Total | 41 (100.0%) | 69 (100.0%) |
Housing Occupancy in Foster Center
Occupancy by Ownership in Foster Center
Of the total 174 dwellings in Foster Center, owner-occupied units account for 62 (35.6%), while renter-occupied units make up 112 (64.4%).
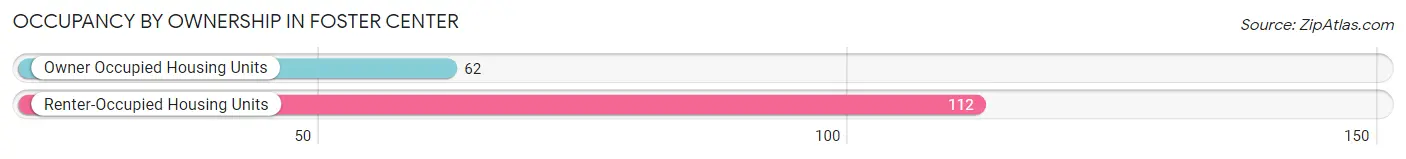
| Occupancy | # Housing Units | % Housing Units |
| Owner Occupied Housing Units | 62 | 35.6% |
| Renter-Occupied Housing Units | 112 | 64.4% |
| Total Occupied Housing Units | 174 | 100.0% |
Occupancy by Household Size in Foster Center
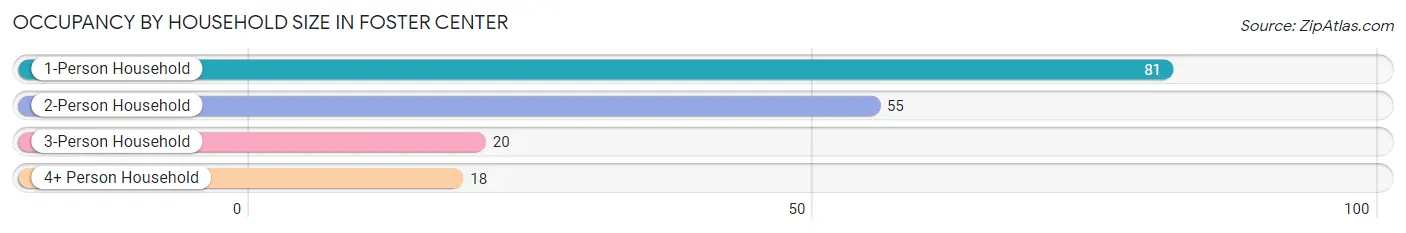
| Household Size | # Housing Units | % Housing Units |
| 1-Person Household | 81 | 46.6% |
| 2-Person Household | 55 | 31.6% |
| 3-Person Household | 20 | 11.5% |
| 4+ Person Household | 18 | 10.3% |
| Total Housing Units | 174 | 100.0% |
Occupancy by Ownership by Household Size in Foster Center
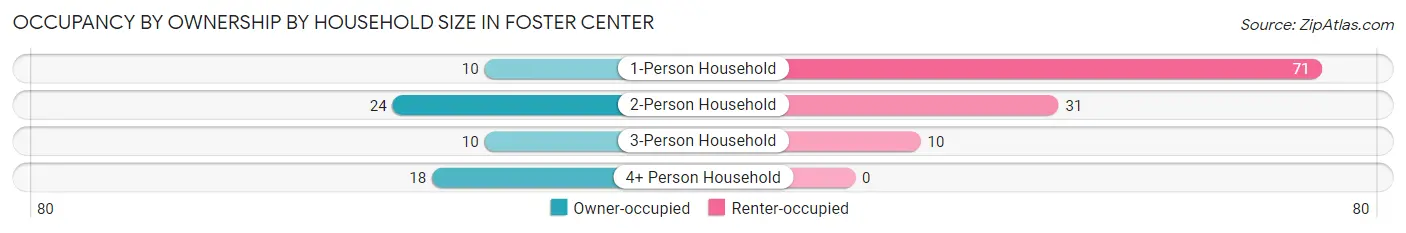
| Household Size | Owner-occupied | Renter-occupied |
| 1-Person Household | 10 (12.3%) | 71 (87.6%) |
| 2-Person Household | 24 (43.6%) | 31 (56.4%) |
| 3-Person Household | 10 (50.0%) | 10 (50.0%) |
| 4+ Person Household | 18 (100.0%) | 0 (0.0%) |
| Total Housing Units | 62 (35.6%) | 112 (64.4%) |
Occupancy by Educational Attainment in Foster Center
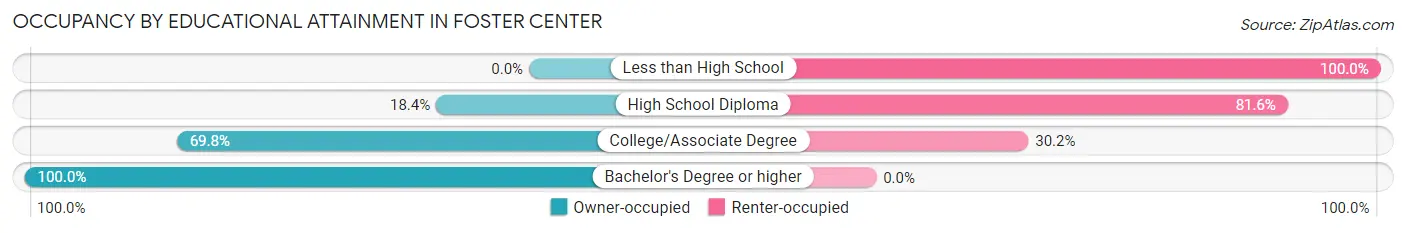
| Household Size | Owner-occupied | Renter-occupied |
| Less than High School | 0 (0.0%) | 62 (100.0%) |
| High School Diploma | 7 (18.4%) | 31 (81.6%) |
| College/Associate Degree | 44 (69.8%) | 19 (30.2%) |
| Bachelor's Degree or higher | 11 (100.0%) | 0 (0.0%) |
Occupancy by Age of Householder in Foster Center
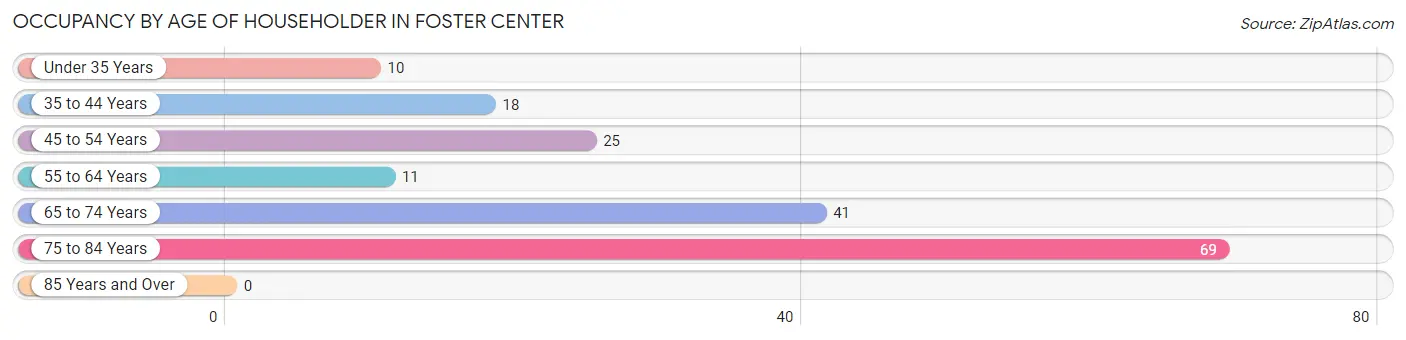
| Age Bracket | # Households | % Households |
| Under 35 Years | 10 | 5.8% |
| 35 to 44 Years | 18 | 10.3% |
| 45 to 54 Years | 25 | 14.4% |
| 55 to 64 Years | 11 | 6.3% |
| 65 to 74 Years | 41 | 23.6% |
| 75 to 84 Years | 69 | 39.7% |
| 85 Years and Over | 0 | 0.0% |
| Total | 174 | 100.0% |
Housing Finances in Foster Center
Median Income by Occupancy in Foster Center
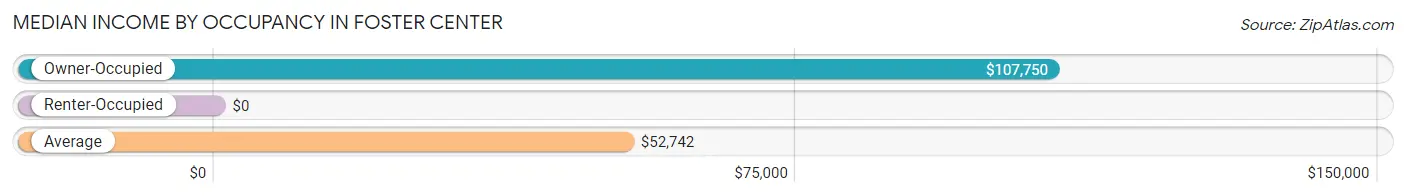
| Occupancy Type | # Households | Median Income |
| Owner-Occupied | 62 (35.6%) | $107,750 |
| Renter-Occupied | 112 (64.4%) | $0 |
| Average | 174 (100.0%) | $52,742 |
Occupancy by Householder Income Bracket in Foster Center
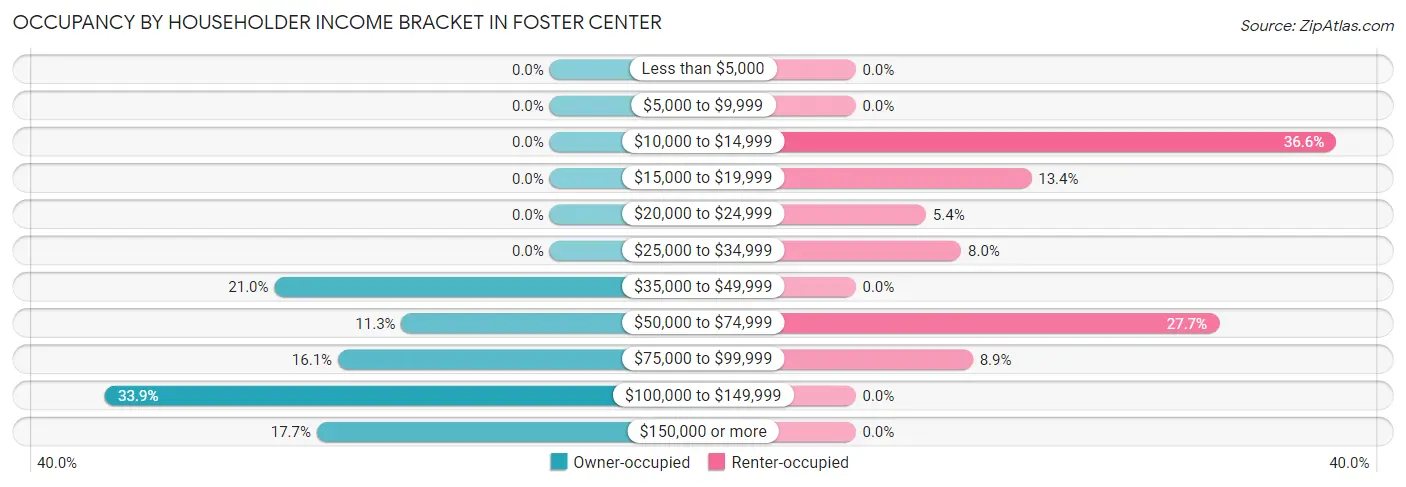
| Income Bracket | Owner-occupied | Renter-occupied |
| Less than $5,000 | 0 (0.0%) | 0 (0.0%) |
| $5,000 to $9,999 | 0 (0.0%) | 0 (0.0%) |
| $10,000 to $14,999 | 0 (0.0%) | 41 (36.6%) |
| $15,000 to $19,999 | 0 (0.0%) | 15 (13.4%) |
| $20,000 to $24,999 | 0 (0.0%) | 6 (5.4%) |
| $25,000 to $34,999 | 0 (0.0%) | 9 (8.0%) |
| $35,000 to $49,999 | 13 (21.0%) | 0 (0.0%) |
| $50,000 to $74,999 | 7 (11.3%) | 31 (27.7%) |
| $75,000 to $99,999 | 10 (16.1%) | 10 (8.9%) |
| $100,000 to $149,999 | 21 (33.9%) | 0 (0.0%) |
| $150,000 or more | 11 (17.7%) | 0 (0.0%) |
| Total | 62 (100.0%) | 112 (100.0%) |
Monthly Housing Cost Tiers in Foster Center
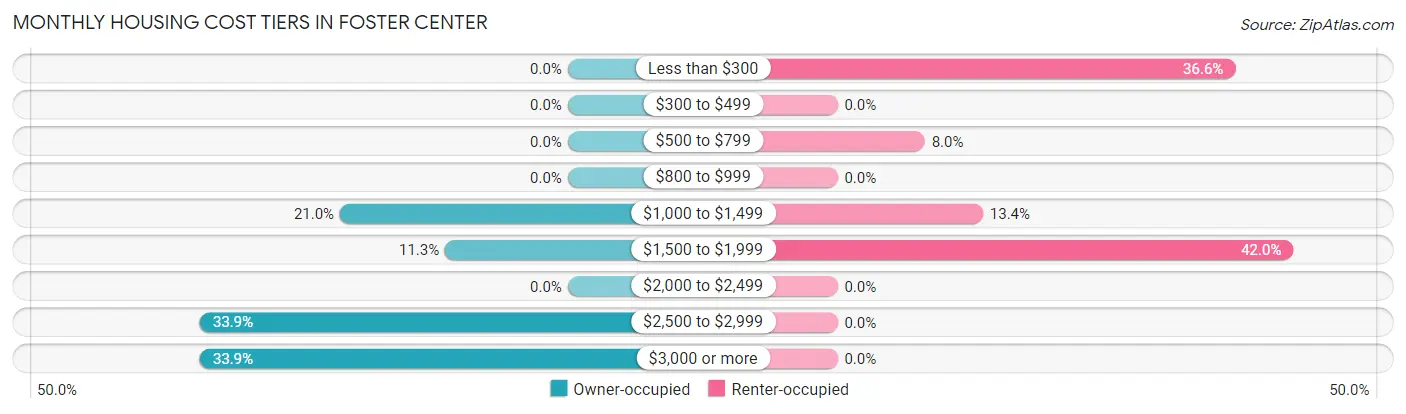
| Monthly Cost | Owner-occupied | Renter-occupied |
| Less than $300 | 0 (0.0%) | 41 (36.6%) |
| $300 to $499 | 0 (0.0%) | 0 (0.0%) |
| $500 to $799 | 0 (0.0%) | 9 (8.0%) |
| $800 to $999 | 0 (0.0%) | 0 (0.0%) |
| $1,000 to $1,499 | 13 (21.0%) | 15 (13.4%) |
| $1,500 to $1,999 | 7 (11.3%) | 47 (42.0%) |
| $2,000 to $2,499 | 0 (0.0%) | 0 (0.0%) |
| $2,500 to $2,999 | 21 (33.9%) | 0 (0.0%) |
| $3,000 or more | 21 (33.9%) | 0 (0.0%) |
| Total | 62 (100.0%) | 112 (100.0%) |
Physical Housing Characteristics in Foster Center
Housing Structures in Foster Center
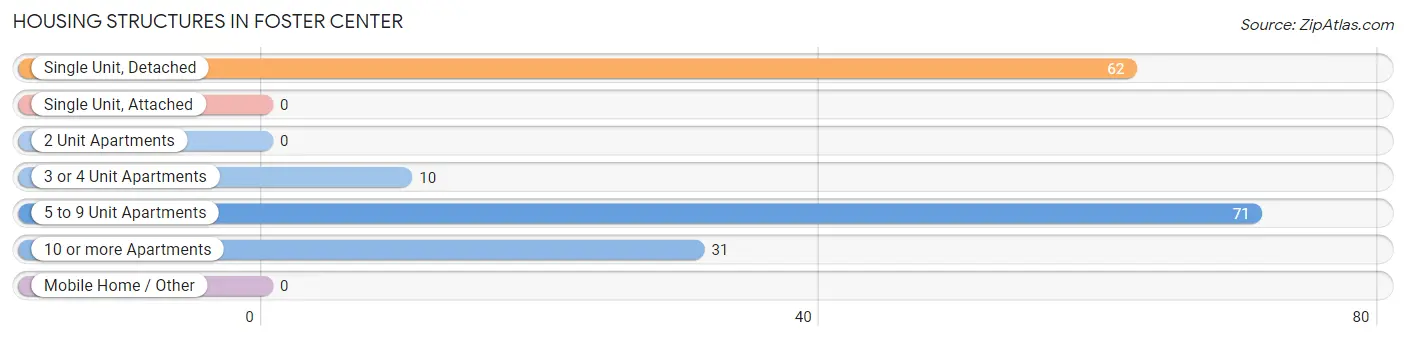
| Structure Type | # Housing Units | % Housing Units |
| Single Unit, Detached | 62 | 35.6% |
| Single Unit, Attached | 0 | 0.0% |
| 2 Unit Apartments | 0 | 0.0% |
| 3 or 4 Unit Apartments | 10 | 5.8% |
| 5 to 9 Unit Apartments | 71 | 40.8% |
| 10 or more Apartments | 31 | 17.8% |
| Mobile Home / Other | 0 | 0.0% |
| Total | 174 | 100.0% |
Housing Structures by Occupancy in Foster Center
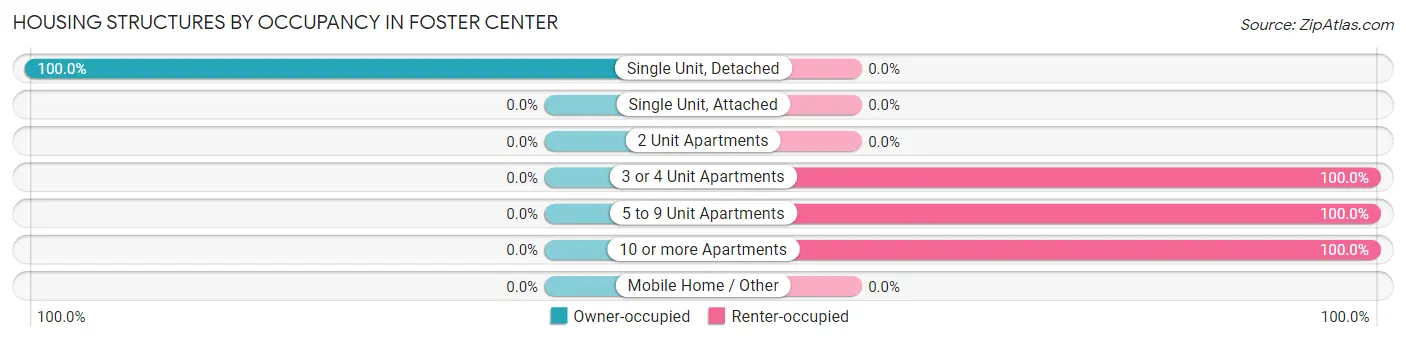
| Structure Type | Owner-occupied | Renter-occupied |
| Single Unit, Detached | 62 (100.0%) | 0 (0.0%) |
| Single Unit, Attached | 0 (0.0%) | 0 (0.0%) |
| 2 Unit Apartments | 0 (0.0%) | 0 (0.0%) |
| 3 or 4 Unit Apartments | 0 (0.0%) | 10 (100.0%) |
| 5 to 9 Unit Apartments | 0 (0.0%) | 71 (100.0%) |
| 10 or more Apartments | 0 (0.0%) | 31 (100.0%) |
| Mobile Home / Other | 0 (0.0%) | 0 (0.0%) |
| Total | 62 (35.6%) | 112 (64.4%) |
Housing Structures by Number of Rooms in Foster Center
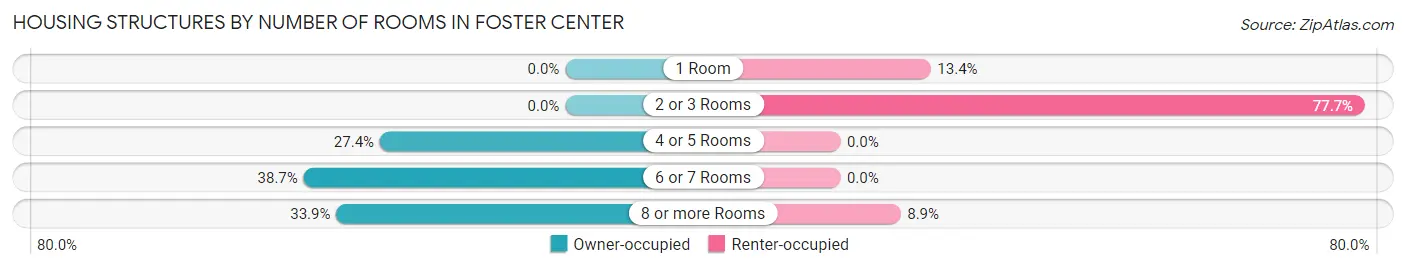
| Number of Rooms | Owner-occupied | Renter-occupied |
| 1 Room | 0 (0.0%) | 15 (13.4%) |
| 2 or 3 Rooms | 0 (0.0%) | 87 (77.7%) |
| 4 or 5 Rooms | 17 (27.4%) | 0 (0.0%) |
| 6 or 7 Rooms | 24 (38.7%) | 0 (0.0%) |
| 8 or more Rooms | 21 (33.9%) | 10 (8.9%) |
| Total | 62 (100.0%) | 112 (100.0%) |
Housing Structure by Heating Type in Foster Center
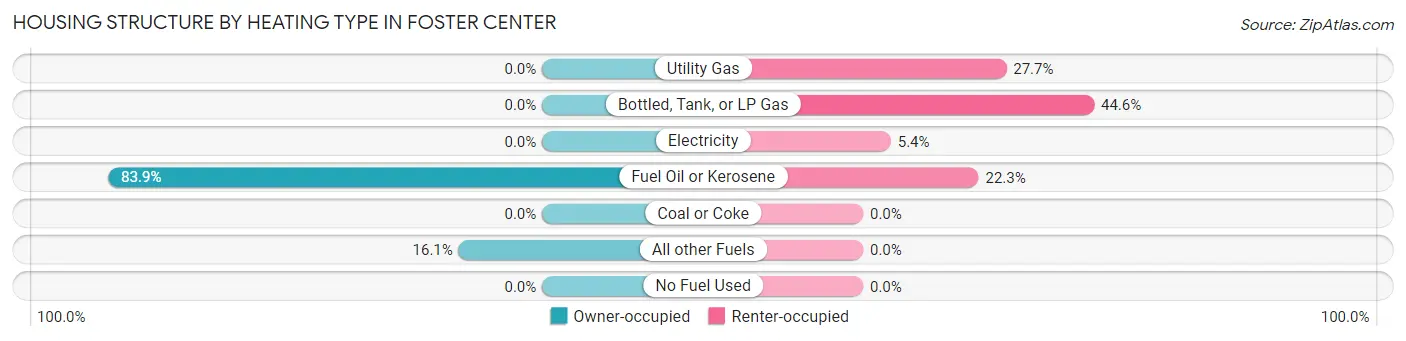
| Heating Type | Owner-occupied | Renter-occupied |
| Utility Gas | 0 (0.0%) | 31 (27.7%) |
| Bottled, Tank, or LP Gas | 0 (0.0%) | 50 (44.6%) |
| Electricity | 0 (0.0%) | 6 (5.4%) |
| Fuel Oil or Kerosene | 52 (83.9%) | 25 (22.3%) |
| Coal or Coke | 0 (0.0%) | 0 (0.0%) |
| All other Fuels | 10 (16.1%) | 0 (0.0%) |
| No Fuel Used | 0 (0.0%) | 0 (0.0%) |
| Total | 62 (100.0%) | 112 (100.0%) |
Household Vehicle Usage in Foster Center
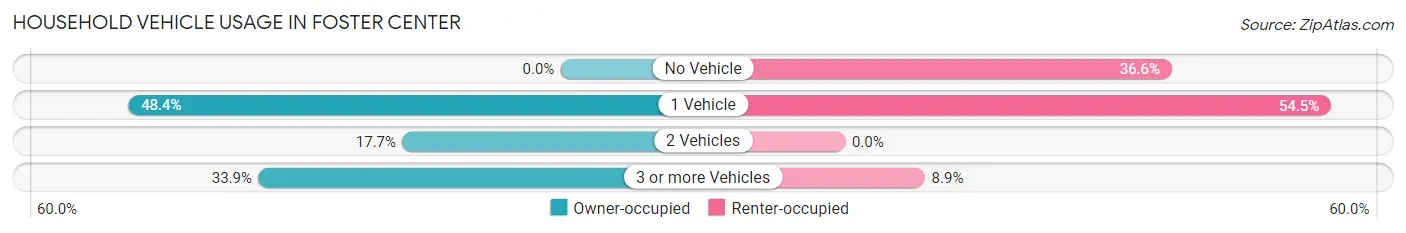
| Vehicles per Household | Owner-occupied | Renter-occupied |
| No Vehicle | 0 (0.0%) | 41 (36.6%) |
| 1 Vehicle | 30 (48.4%) | 61 (54.5%) |
| 2 Vehicles | 11 (17.7%) | 0 (0.0%) |
| 3 or more Vehicles | 21 (33.9%) | 10 (8.9%) |
| Total | 62 (100.0%) | 112 (100.0%) |
Real Estate & Mortgages in Foster Center
Real Estate and Mortgage Overview in Foster Center
| Characteristic | Without Mortgage | With Mortgage |
| Housing Units | 13 | 49 |
| Median Property Value | - | - |
| Median Household Income | - | - |
| Monthly Housing Costs | - | - |
| Real Estate Taxes | - | - |
Property Value by Mortgage Status in Foster Center
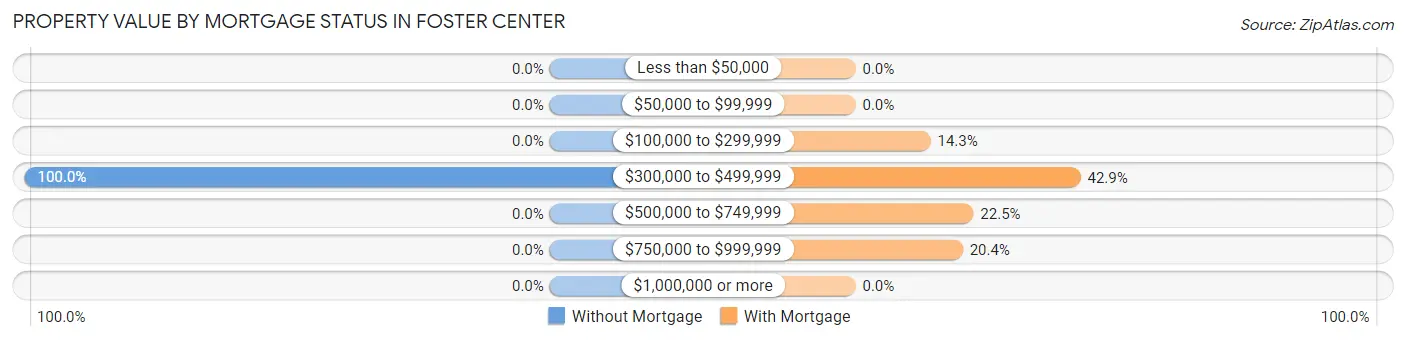
| Property Value | Without Mortgage | With Mortgage |
| Less than $50,000 | 0 (0.0%) | 0 (0.0%) |
| $50,000 to $99,999 | 0 (0.0%) | 0 (0.0%) |
| $100,000 to $299,999 | 0 (0.0%) | 7 (14.3%) |
| $300,000 to $499,999 | 13 (100.0%) | 21 (42.9%) |
| $500,000 to $749,999 | 0 (0.0%) | 11 (22.5%) |
| $750,000 to $999,999 | 0 (0.0%) | 10 (20.4%) |
| $1,000,000 or more | 0 (0.0%) | 0 (0.0%) |
| Total | 13 (100.0%) | 49 (100.0%) |
Household Income by Mortgage Status in Foster Center
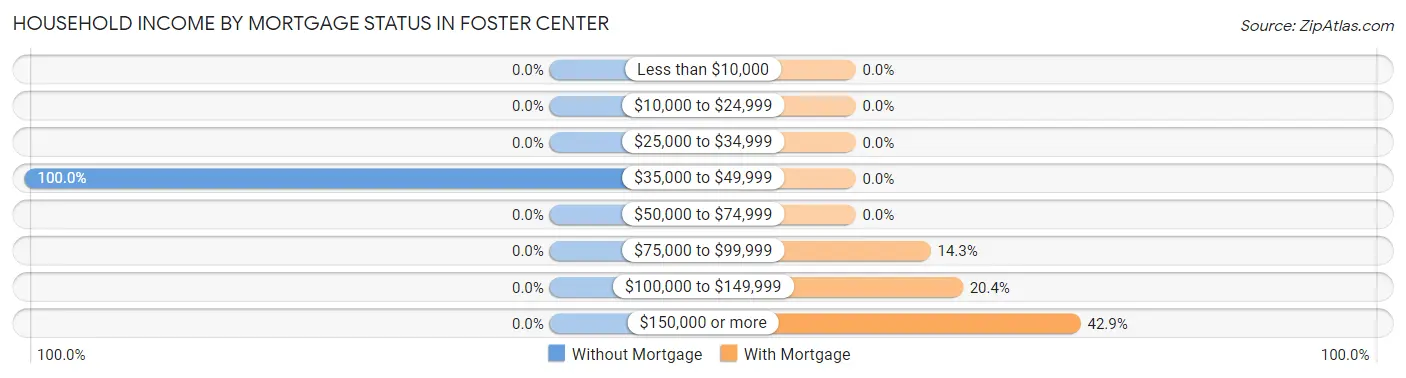
| Household Income | Without Mortgage | With Mortgage |
| Less than $10,000 | 0 (0.0%) | 0 (0.0%) |
| $10,000 to $24,999 | 0 (0.0%) | 0 (0.0%) |
| $25,000 to $34,999 | 0 (0.0%) | 0 (0.0%) |
| $35,000 to $49,999 | 13 (100.0%) | 0 (0.0%) |
| $50,000 to $74,999 | 0 (0.0%) | 0 (0.0%) |
| $75,000 to $99,999 | 0 (0.0%) | 7 (14.3%) |
| $100,000 to $149,999 | 0 (0.0%) | 10 (20.4%) |
| $150,000 or more | 0 (0.0%) | 21 (42.9%) |
| Total | 13 (100.0%) | 49 (100.0%) |
Property Value to Household Income Ratio in Foster Center
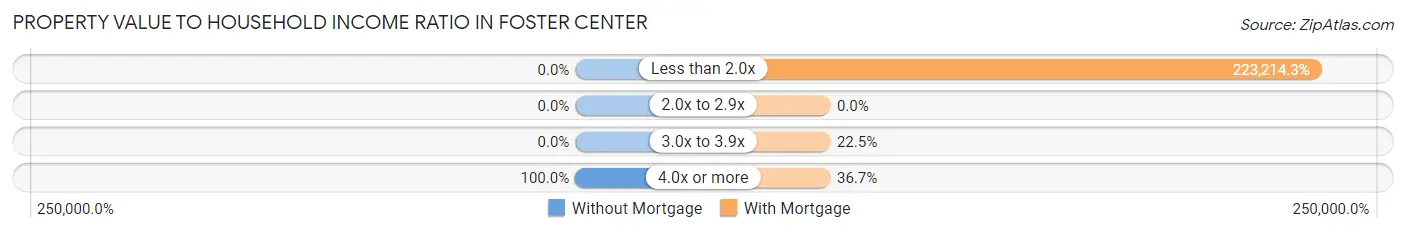
| Value-to-Income Ratio | Without Mortgage | With Mortgage |
| Less than 2.0x | 0 (0.0%) | 109,375 (223,214.3%) |
| 2.0x to 2.9x | 0 (0.0%) | 0 (0.0%) |
| 3.0x to 3.9x | 0 (0.0%) | 11 (22.5%) |
| 4.0x or more | 13 (100.0%) | 18 (36.7%) |
| Total | 13 (100.0%) | 49 (100.0%) |
Real Estate Taxes by Mortgage Status in Foster Center
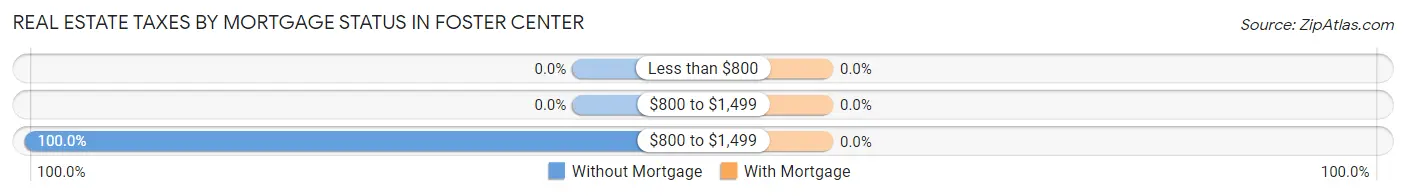
| Property Taxes | Without Mortgage | With Mortgage |
| Less than $800 | 0 (0.0%) | 0 (0.0%) |
| $800 to $1,499 | 0 (0.0%) | 0 (0.0%) |
| $800 to $1,499 | 13 (100.0%) | 0 (0.0%) |
| Total | 13 (100.0%) | 49 (100.0%) |
Health & Disability in Foster Center
Health Insurance Coverage by Age in Foster Center
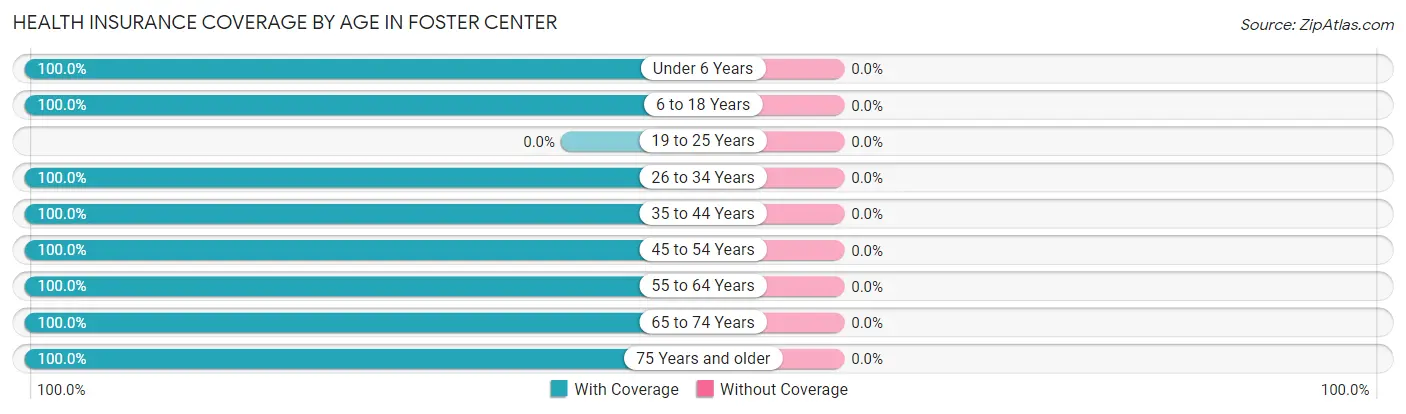
| Age Bracket | With Coverage | Without Coverage |
| Under 6 Years | 6 (100.0%) | 0 (0.0%) |
| 6 to 18 Years | 48 (100.0%) | 0 (0.0%) |
| 19 to 25 Years | 0 (0.0%) | 0 (0.0%) |
| 26 to 34 Years | 47 (100.0%) | 0 (0.0%) |
| 35 to 44 Years | 29 (100.0%) | 0 (0.0%) |
| 45 to 54 Years | 31 (100.0%) | 0 (0.0%) |
| 55 to 64 Years | 42 (100.0%) | 0 (0.0%) |
| 65 to 74 Years | 71 (100.0%) | 0 (0.0%) |
| 75 Years and older | 69 (100.0%) | 0 (0.0%) |
| Total | 343 (100.0%) | 0 (0.0%) |
Health Insurance Coverage by Citizenship Status in Foster Center
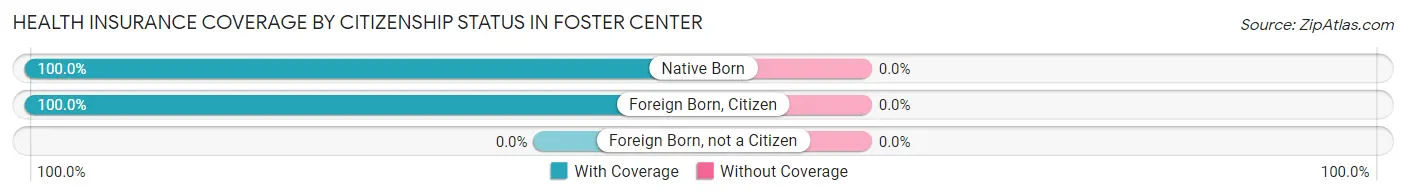
| Citizenship Status | With Coverage | Without Coverage |
| Native Born | 6 (100.0%) | 0 (0.0%) |
| Foreign Born, Citizen | 48 (100.0%) | 0 (0.0%) |
| Foreign Born, not a Citizen | 0 (0.0%) | 0 (0.0%) |
Health Insurance Coverage by Household Income in Foster Center
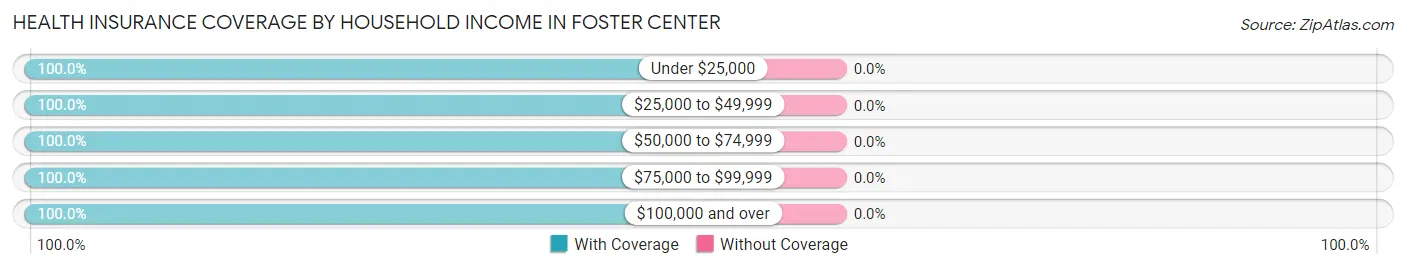
| Household Income | With Coverage | Without Coverage |
| Under $25,000 | 62 (100.0%) | 0 (0.0%) |
| $25,000 to $49,999 | 40 (100.0%) | 0 (0.0%) |
| $50,000 to $74,999 | 87 (100.0%) | 0 (0.0%) |
| $75,000 to $99,999 | 65 (100.0%) | 0 (0.0%) |
| $100,000 and over | 89 (100.0%) | 0 (0.0%) |
Public vs Private Health Insurance Coverage by Age in Foster Center
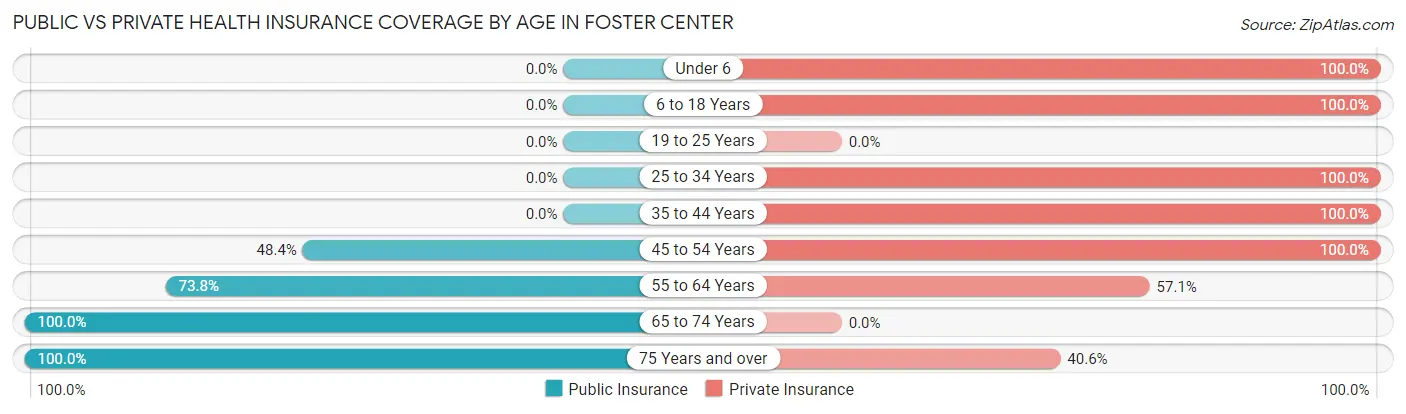
| Age Bracket | Public Insurance | Private Insurance |
| Under 6 | 0 (0.0%) | 6 (100.0%) |
| 6 to 18 Years | 0 (0.0%) | 48 (100.0%) |
| 19 to 25 Years | 0 (0.0%) | 0 (0.0%) |
| 25 to 34 Years | 0 (0.0%) | 47 (100.0%) |
| 35 to 44 Years | 0 (0.0%) | 29 (100.0%) |
| 45 to 54 Years | 15 (48.4%) | 31 (100.0%) |
| 55 to 64 Years | 31 (73.8%) | 24 (57.1%) |
| 65 to 74 Years | 71 (100.0%) | 0 (0.0%) |
| 75 Years and over | 69 (100.0%) | 28 (40.6%) |
| Total | 186 (54.2%) | 213 (62.1%) |
Disability Status by Sex by Age in Foster Center
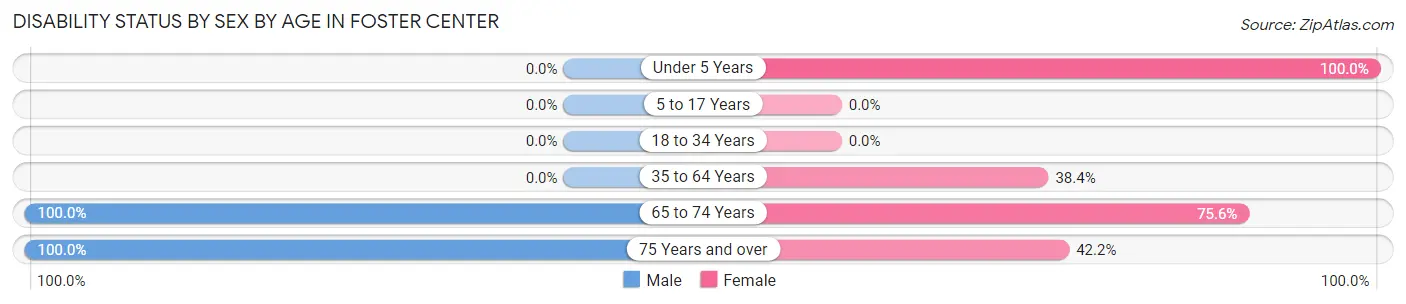
| Age Bracket | Male | Female |
| Under 5 Years | 0 (0.0%) | 6 (100.0%) |
| 5 to 17 Years | 0 (0.0%) | 0 (0.0%) |
| 18 to 34 Years | 0 (0.0%) | 0 (0.0%) |
| 35 to 64 Years | 0 (0.0%) | 28 (38.4%) |
| 65 to 74 Years | 30 (100.0%) | 31 (75.6%) |
| 75 Years and over | 24 (100.0%) | 19 (42.2%) |
Disability Class by Sex by Age in Foster Center
Disability Class: Hearing Difficulty
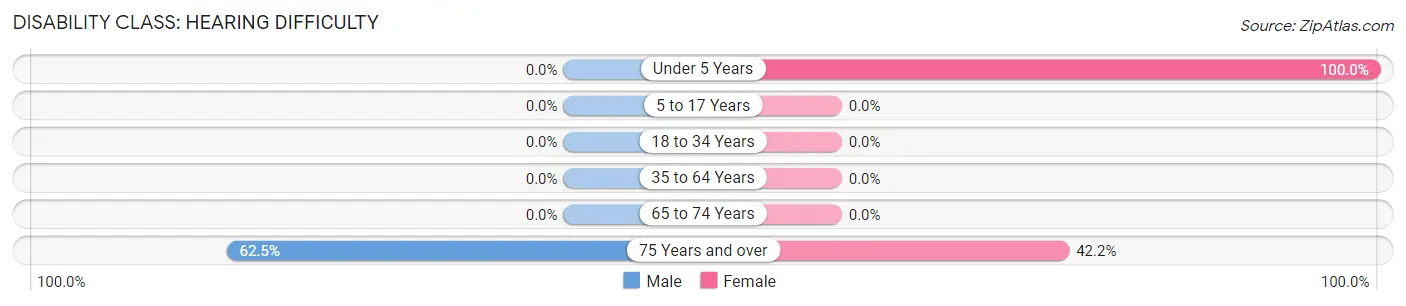
| Age Bracket | Male | Female |
| Under 5 Years | 0 (0.0%) | 6 (100.0%) |
| 5 to 17 Years | 0 (0.0%) | 0 (0.0%) |
| 18 to 34 Years | 0 (0.0%) | 0 (0.0%) |
| 35 to 64 Years | 0 (0.0%) | 0 (0.0%) |
| 65 to 74 Years | 0 (0.0%) | 0 (0.0%) |
| 75 Years and over | 15 (62.5%) | 19 (42.2%) |
Disability Class: Vision Difficulty
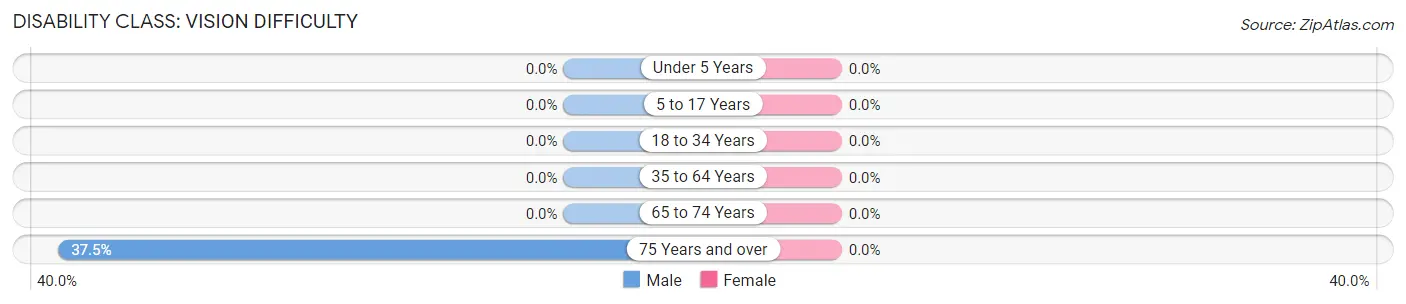
| Age Bracket | Male | Female |
| Under 5 Years | 0 (0.0%) | 0 (0.0%) |
| 5 to 17 Years | 0 (0.0%) | 0 (0.0%) |
| 18 to 34 Years | 0 (0.0%) | 0 (0.0%) |
| 35 to 64 Years | 0 (0.0%) | 0 (0.0%) |
| 65 to 74 Years | 0 (0.0%) | 0 (0.0%) |
| 75 Years and over | 9 (37.5%) | 0 (0.0%) |
Disability Class: Cognitive Difficulty
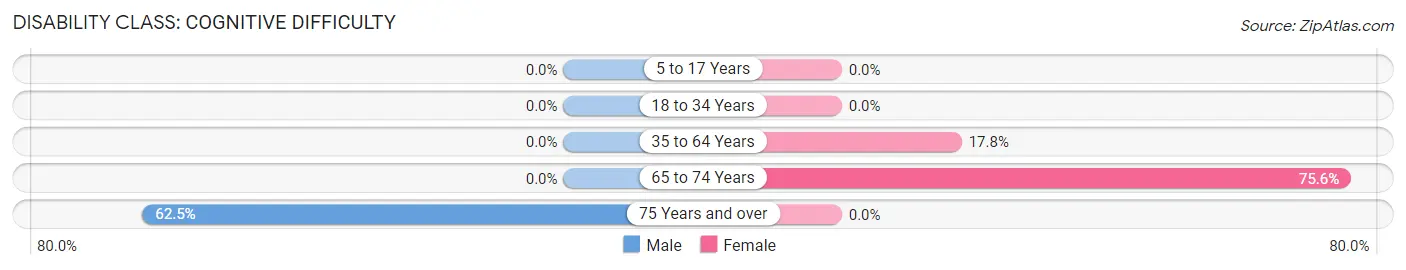
| Age Bracket | Male | Female |
| 5 to 17 Years | 0 (0.0%) | 0 (0.0%) |
| 18 to 34 Years | 0 (0.0%) | 0 (0.0%) |
| 35 to 64 Years | 0 (0.0%) | 13 (17.8%) |
| 65 to 74 Years | 0 (0.0%) | 31 (75.6%) |
| 75 Years and over | 15 (62.5%) | 0 (0.0%) |
Disability Class: Ambulatory Difficulty
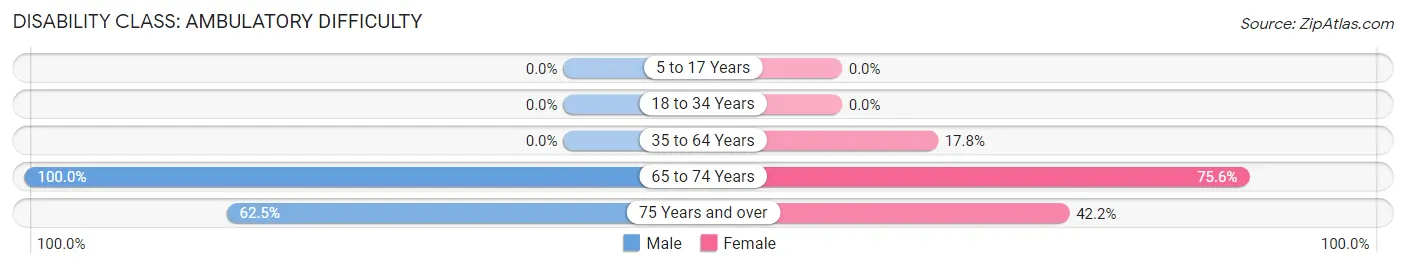
| Age Bracket | Male | Female |
| 5 to 17 Years | 0 (0.0%) | 0 (0.0%) |
| 18 to 34 Years | 0 (0.0%) | 0 (0.0%) |
| 35 to 64 Years | 0 (0.0%) | 13 (17.8%) |
| 65 to 74 Years | 30 (100.0%) | 31 (75.6%) |
| 75 Years and over | 15 (62.5%) | 19 (42.2%) |
Disability Class: Self-Care Difficulty
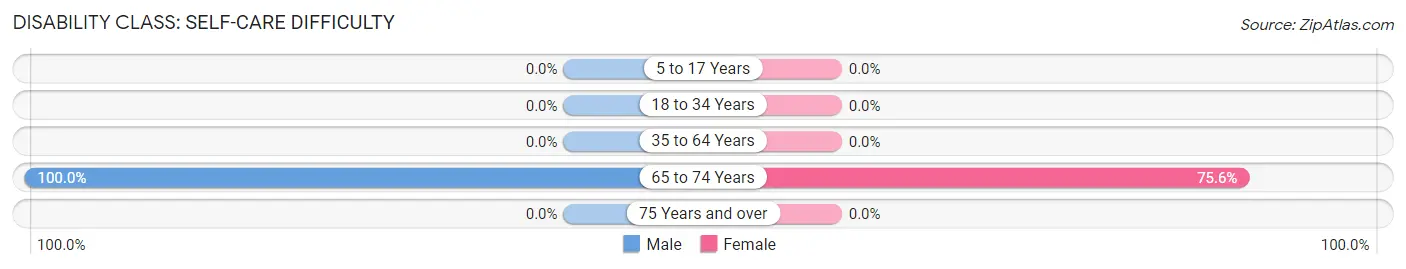
| Age Bracket | Male | Female |
| 5 to 17 Years | 0 (0.0%) | 0 (0.0%) |
| 18 to 34 Years | 0 (0.0%) | 0 (0.0%) |
| 35 to 64 Years | 0 (0.0%) | 0 (0.0%) |
| 65 to 74 Years | 30 (100.0%) | 31 (75.6%) |
| 75 Years and over | 0 (0.0%) | 0 (0.0%) |
Technology Access in Foster Center
Computing Device Access in Foster Center
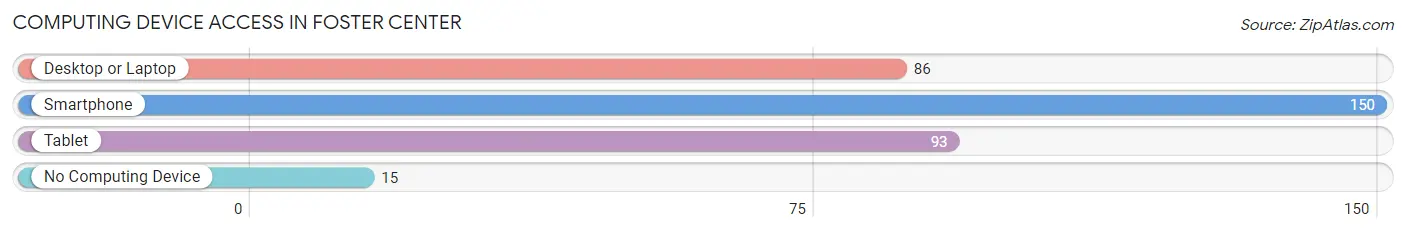
| Device Type | # Households | % Households |
| Desktop or Laptop | 86 | 49.4% |
| Smartphone | 150 | 86.2% |
| Tablet | 93 | 53.4% |
| No Computing Device | 15 | 8.6% |
| Total | 174 | 100.0% |
Internet Access in Foster Center
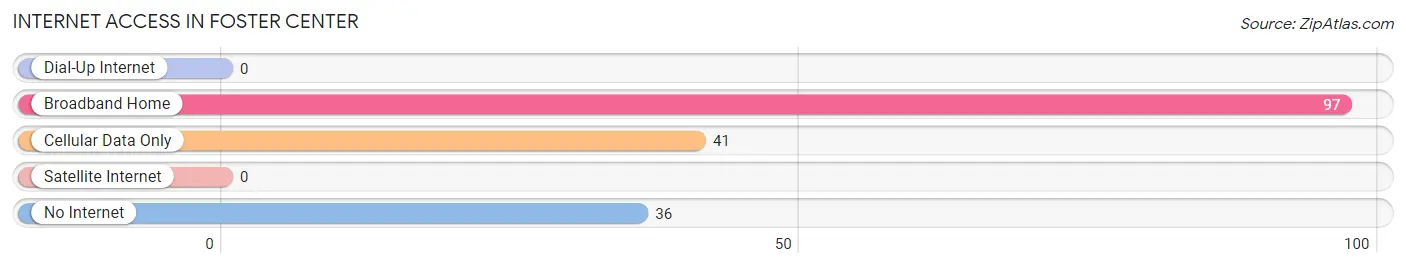
| Internet Type | # Households | % Households |
| Dial-Up Internet | 0 | 0.0% |
| Broadband Home | 97 | 55.7% |
| Cellular Data Only | 41 | 23.6% |
| Satellite Internet | 0 | 0.0% |
| No Internet | 36 | 20.7% |
| Total | 174 | 100.0% |
Foster Center Summary
The Foster Center is a small town located in the state of Rhode Island. It is situated in the northern part of the state, in the town of Foster, and is part of the Providence metropolitan area. The town has a population of approximately 4,000 people, and is known for its rural charm and small-town atmosphere.
Geography
Foster Center is located in the northern part of Rhode Island, in the town of Foster. It is situated in the Providence metropolitan area, and is bordered by the towns of Scituate, Glocester, and Smithfield. The town is located on the banks of the Blackstone River, and is surrounded by rolling hills and forests. The town is home to several small lakes, including the Foster Reservoir, which is a popular spot for fishing and boating.
Economy
Foster Center is a small, rural town, and its economy is largely based on agriculture and tourism. The town is home to several small farms, which produce a variety of fruits and vegetables. The town is also home to several small businesses, including a few restaurants, a grocery store, and a few small shops. Tourism is also an important part of the local economy, as the town is home to several popular attractions, including the Foster Reservoir, the Blackstone River, and the Foster Center State Park.
Demographics
As of the 2010 census, the population of Foster Center was 4,000 people. The town is predominantly white, with a small minority population. The median household income is $50,000, and the median home value is $200,000. The town has a high rate of homeownership, with over 80% of the population owning their own homes.
Education
Foster Center is served by the Foster Center School District, which includes two elementary schools, one middle school, and one high school. The town is also home to several private schools, including the Foster Center Academy and the Foster Center Christian Academy.
Conclusion
Foster Center is a small, rural town located in the northern part of Rhode Island. It is situated in the Providence metropolitan area, and is known for its rural charm and small-town atmosphere. The town has a population of approximately 4,000 people, and its economy is largely based on agriculture and tourism. The town is served by the Foster Center School District, and is home to several private schools. The town is predominantly white, with a small minority population, and has a high rate of homeownership.
Common Questions
What is Per Capita Income in Foster Center?
Per Capita income in Foster Center is $31,717.
What is the Median Family Income in Foster Center?
Median Family Income in Foster Center is $78,875.
What is the Median Household income in Foster Center?
Median Household Income in Foster Center is $52,742.
What is Inequality or Gini Index in Foster Center?
Inequality or Gini Index in Foster Center is 0.47.
What is the Total Population of Foster Center?
Total Population of Foster Center is 343.
What is the Total Male Population of Foster Center?
Total Male Population of Foster Center is 154.
What is the Total Female Population of Foster Center?
Total Female Population of Foster Center is 189.
What is the Ratio of Males per 100 Females in Foster Center?
There are 81.48 Males per 100 Females in Foster Center.
What is the Ratio of Females per 100 Males in Foster Center?
There are 122.73 Females per 100 Males in Foster Center.
What is the Median Population Age in Foster Center?
Median Population Age in Foster Center is 55.8 Years.
What is the Average Family Size in Foster Center
Average Family Size in Foster Center is 3.5 People.
What is the Average Household Size in Foster Center
Average Household Size in Foster Center is 2.0 People.
How Large is the Labor Force in Foster Center?
There are 121 People in the Labor Forcein in Foster Center.
What is the Percentage of People in the Labor Force in Foster Center?
41.9% of People are in the Labor Force in Foster Center.