Zip Codes with the Highest Percentage of Population Employed in Sales & Related in Chambersburg, PA
RELATED REPORTS & OPTIONS
Sales & Related
Chambersburg
Compare Zip Codes
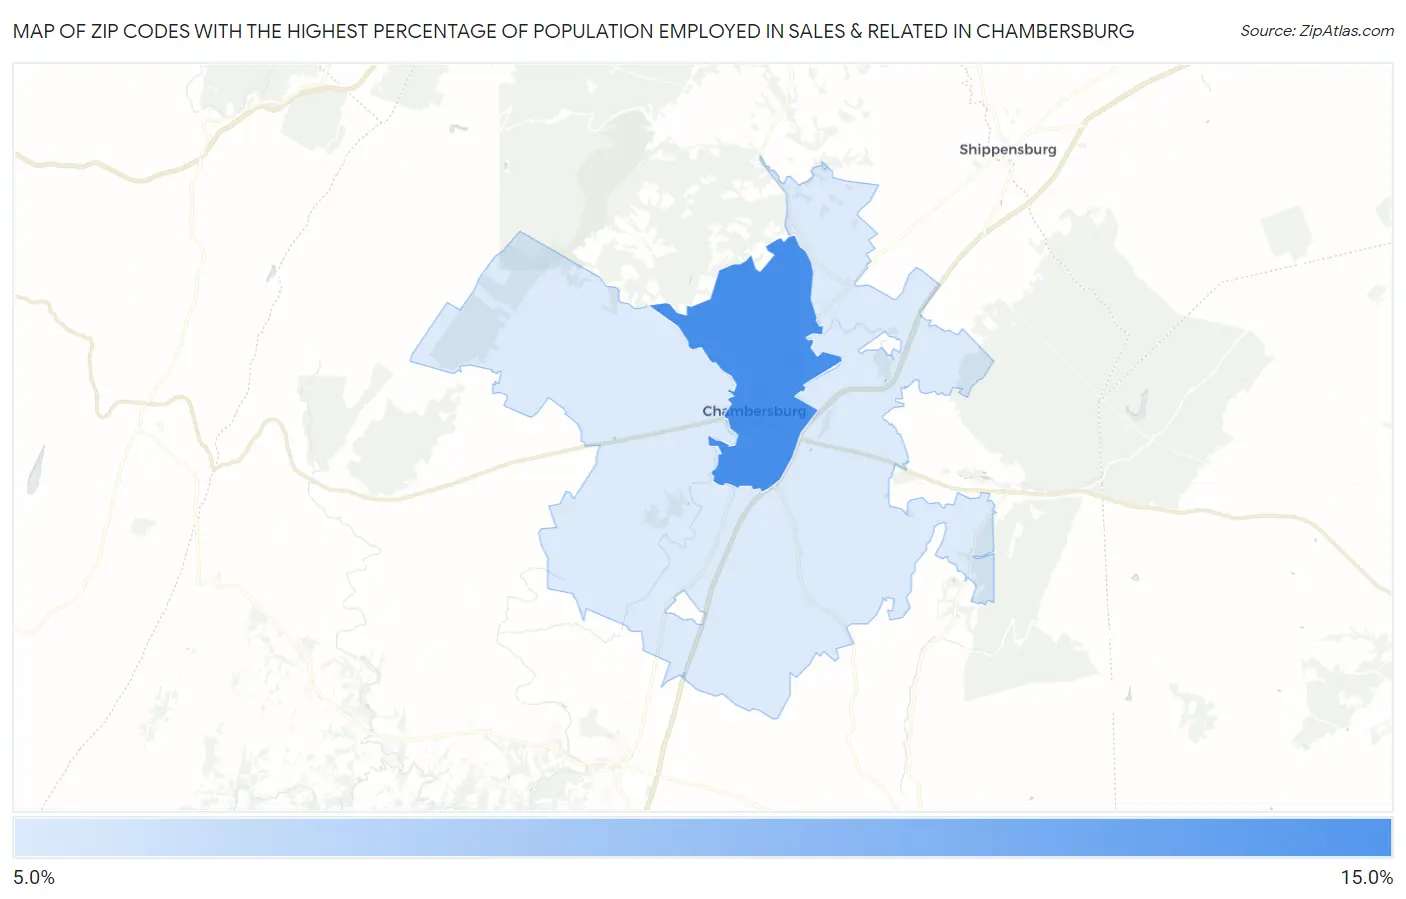
Map of Zip Codes with the Highest Percentage of Population Employed in Sales & Related in Chambersburg
9.9%
10.2%
Zip Codes with the Highest Percentage of Population Employed in Sales & Related in Chambersburg, PA
| Zip Code | % Employed | vs State | vs National | |
| 1. | 17201 | 10.2% | 9.1%(+1.07)#488 | 9.6%(+0.611)#10,404 |
| 2. | 17202 | 9.9% | 9.1%(+0.806)#538 | 9.6%(+0.351)#11,182 |
1
Common Questions
What are the Top Zip Codes with the Highest Percentage of Population Employed in Sales & Related in Chambersburg, PA?
Top Zip Codes with the Highest Percentage of Population Employed in Sales & Related in Chambersburg, PA are:
What zip code has the Highest Percentage of Population Employed in Sales & Related in Chambersburg, PA?
17201 has the Highest Percentage of Population Employed in Sales & Related in Chambersburg, PA with 10.2%.
What is the Percentage of Population Employed in Sales & Related in Pennsylvania?
Percentage of Population Employed in Sales & Related in Pennsylvania is 9.1%.
What is the Percentage of Population Employed in Sales & Related in the United States?
Percentage of Population Employed in Sales & Related in the United States is 9.6%.