Zip Codes with the Highest Percentage of Population Employed in Health Diagnosing & Treating in Chambersburg, PA
RELATED REPORTS & OPTIONS
Health Diagnosing & Treating
Chambersburg
Compare Zip Codes
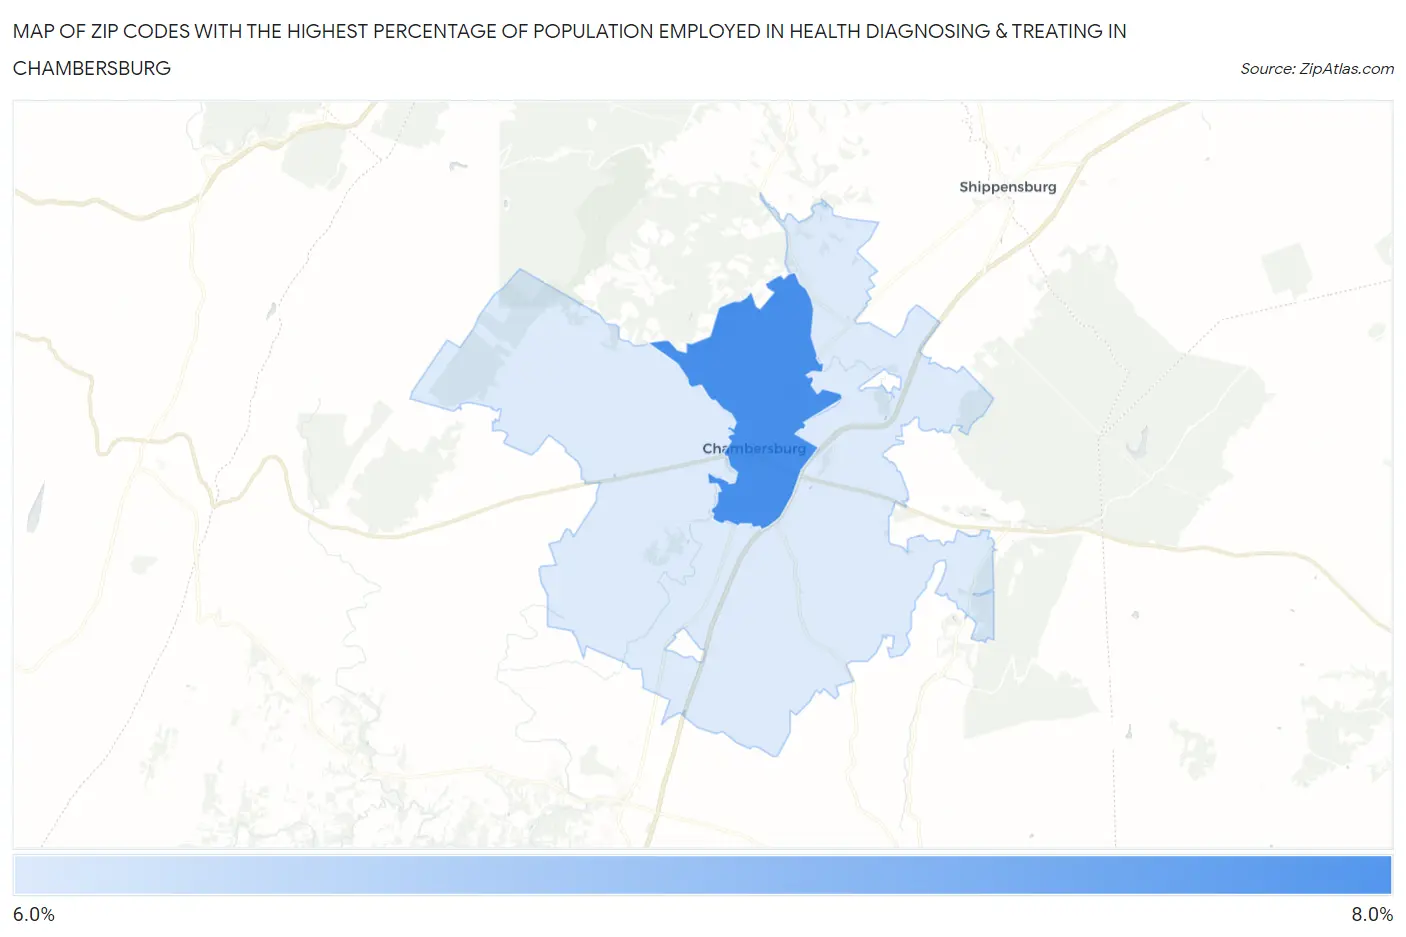
Map of Zip Codes with the Highest Percentage of Population Employed in Health Diagnosing & Treating in Chambersburg
6.5%
6.9%
Zip Codes with the Highest Percentage of Population Employed in Health Diagnosing & Treating in Chambersburg, PA
| Zip Code | % Employed | vs State | vs National | |
| 1. | 17201 | 6.9% | 7.4%(-0.421)#746 | 6.2%(+0.685)#10,588 |
| 2. | 17202 | 6.5% | 7.4%(-0.822)#843 | 6.2%(+0.284)#11,922 |
1
Common Questions
What are the Top Zip Codes with the Highest Percentage of Population Employed in Health Diagnosing & Treating in Chambersburg, PA?
Top Zip Codes with the Highest Percentage of Population Employed in Health Diagnosing & Treating in Chambersburg, PA are:
What zip code has the Highest Percentage of Population Employed in Health Diagnosing & Treating in Chambersburg, PA?
17201 has the Highest Percentage of Population Employed in Health Diagnosing & Treating in Chambersburg, PA with 6.9%.
What is the Percentage of Population Employed in Health Diagnosing & Treating in Pennsylvania?
Percentage of Population Employed in Health Diagnosing & Treating in Pennsylvania is 7.4%.
What is the Percentage of Population Employed in Health Diagnosing & Treating in the United States?
Percentage of Population Employed in Health Diagnosing & Treating in the United States is 6.2%.