Zip Codes with the Highest Percentage of Population Employed in Architecture & Engineering in Chambersburg, PA
RELATED REPORTS & OPTIONS
Architecture & Engineering
Chambersburg
Compare Zip Codes
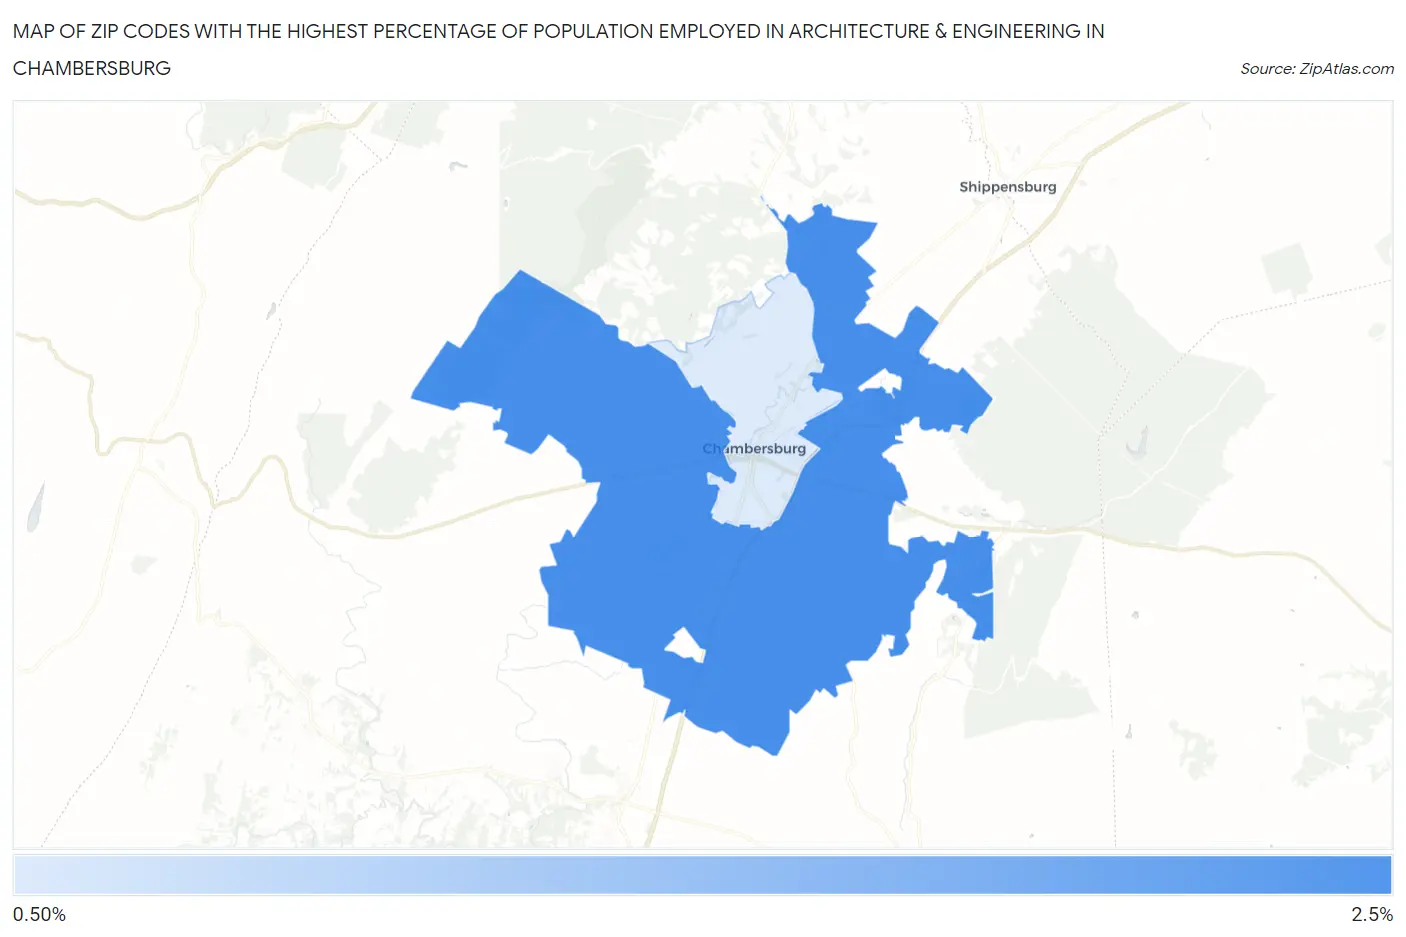
Map of Zip Codes with the Highest Percentage of Population Employed in Architecture & Engineering in Chambersburg
1.2%
2.0%
Zip Codes with the Highest Percentage of Population Employed in Architecture & Engineering in Chambersburg, PA
| Zip Code | % Employed | vs State | vs National | |
| 1. | 17202 | 2.0% | 2.0%(-0.037)#544 | 2.1%(-0.145)#9,576 |
| 2. | 17201 | 1.2% | 2.0%(-0.870)#903 | 2.1%(-0.979)#15,319 |
1
Common Questions
What are the Top Zip Codes with the Highest Percentage of Population Employed in Architecture & Engineering in Chambersburg, PA?
Top Zip Codes with the Highest Percentage of Population Employed in Architecture & Engineering in Chambersburg, PA are:
What zip code has the Highest Percentage of Population Employed in Architecture & Engineering in Chambersburg, PA?
17202 has the Highest Percentage of Population Employed in Architecture & Engineering in Chambersburg, PA with 2.0%.
What is the Percentage of Population Employed in Architecture & Engineering in Pennsylvania?
Percentage of Population Employed in Architecture & Engineering in Pennsylvania is 2.0%.
What is the Percentage of Population Employed in Architecture & Engineering in the United States?
Percentage of Population Employed in Architecture & Engineering in the United States is 2.1%.