Zip Codes with the Highest Percentage of Population Employed in Real Estate, Rental & Leasing in Chambersburg, PA
RELATED REPORTS & OPTIONS
Real Estate, Rental & Leasing
Chambersburg
Compare Zip Codes
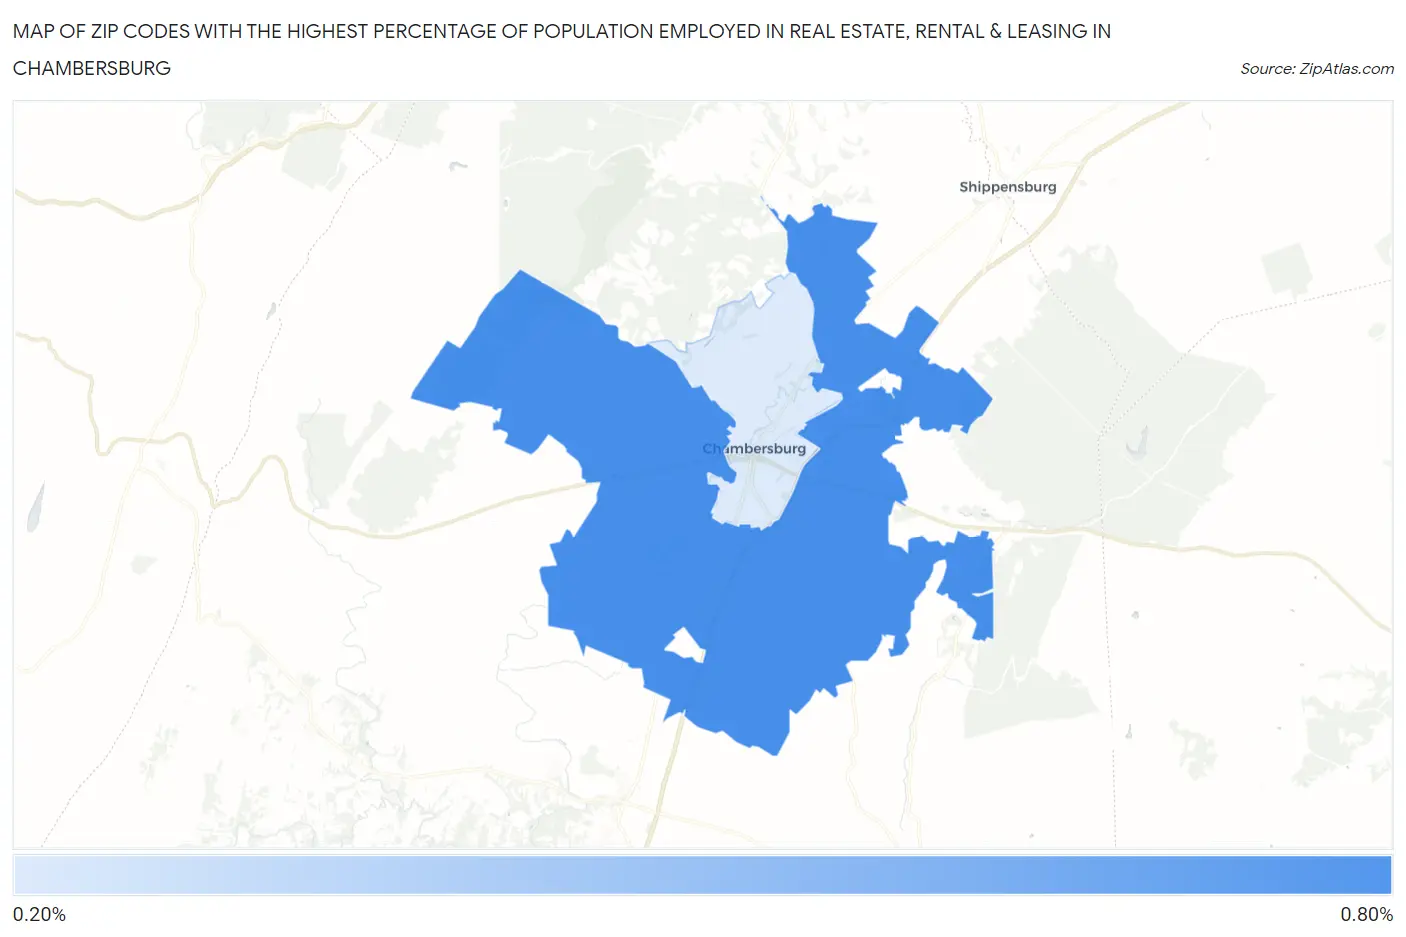
Map of Zip Codes with the Highest Percentage of Population Employed in Real Estate, Rental & Leasing in Chambersburg
0.28%
0.66%
Zip Codes with the Highest Percentage of Population Employed in Real Estate, Rental & Leasing in Chambersburg, PA
| Zip Code | % Employed | vs State | vs National | |
| 1. | 17202 | 0.66% | 1.5%(-0.831)#872 | 1.9%(-1.23)#17,778 |
| 2. | 17201 | 0.28% | 1.5%(-1.21)#1,058 | 1.9%(-1.61)#20,574 |
1
Common Questions
What are the Top Zip Codes with the Highest Percentage of Population Employed in Real Estate, Rental & Leasing in Chambersburg, PA?
Top Zip Codes with the Highest Percentage of Population Employed in Real Estate, Rental & Leasing in Chambersburg, PA are:
What zip code has the Highest Percentage of Population Employed in Real Estate, Rental & Leasing in Chambersburg, PA?
17202 has the Highest Percentage of Population Employed in Real Estate, Rental & Leasing in Chambersburg, PA with 0.66%.
What is the Percentage of Population Employed in Real Estate, Rental & Leasing in Pennsylvania?
Percentage of Population Employed in Real Estate, Rental & Leasing in Pennsylvania is 1.5%.
What is the Percentage of Population Employed in Real Estate, Rental & Leasing in the United States?
Percentage of Population Employed in Real Estate, Rental & Leasing in the United States is 1.9%.