Zip Codes with the Highest Percentage of Population Employed in Legal Services & Support in Chambersburg, PA
RELATED REPORTS & OPTIONS
Legal Services & Support
Chambersburg
Compare Zip Codes
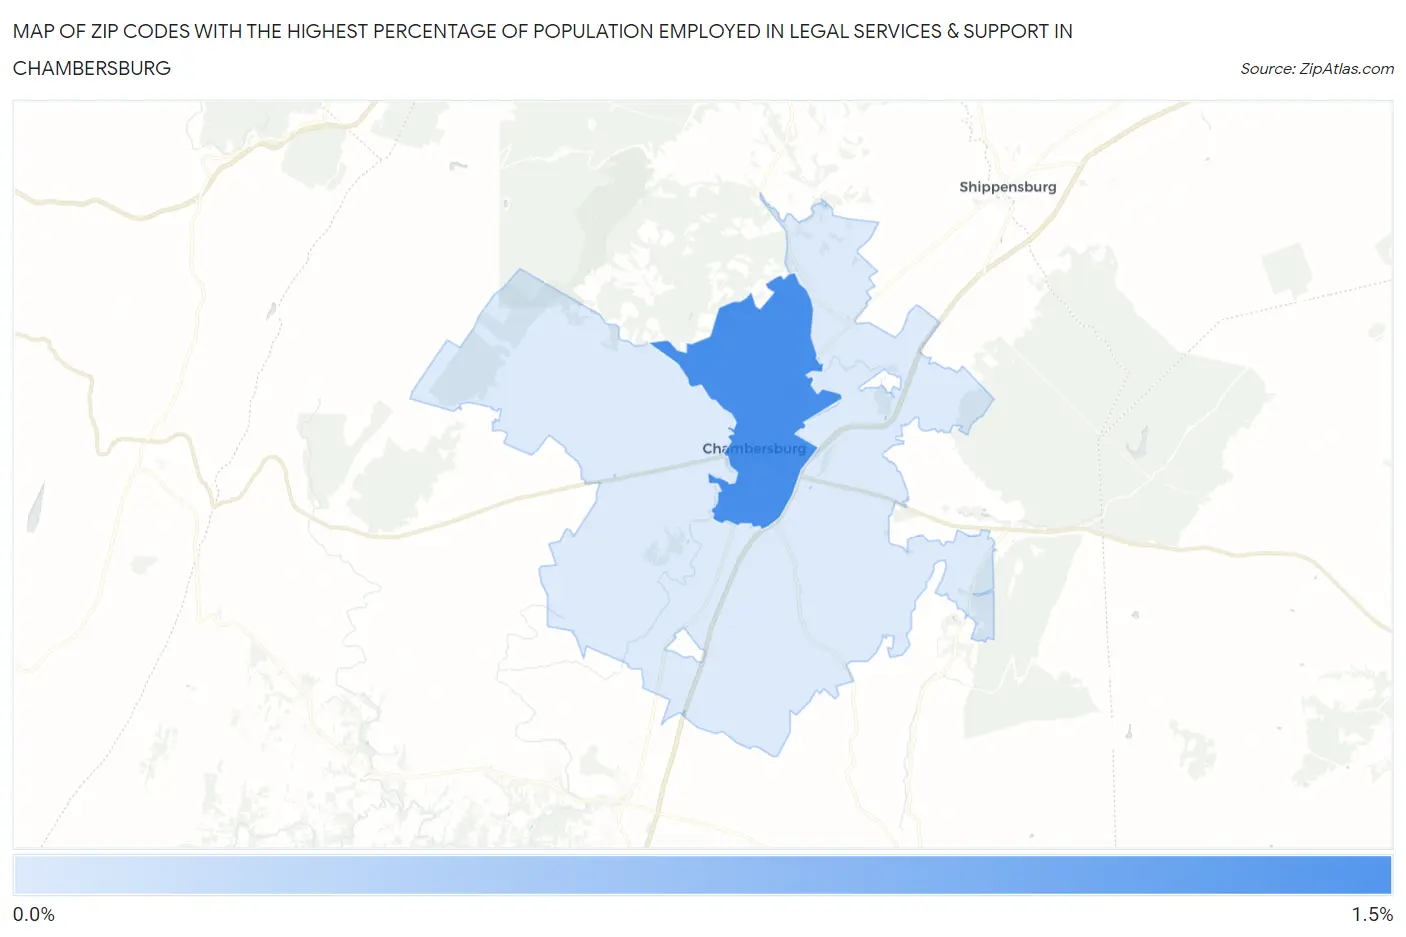
Map of Zip Codes with the Highest Percentage of Population Employed in Legal Services & Support in Chambersburg
0.36%
1.0%
Zip Codes with the Highest Percentage of Population Employed in Legal Services & Support in Chambersburg, PA
| Zip Code | % Employed | vs State | vs National | |
| 1. | 17201 | 1.0% | 1.1%(-0.134)#356 | 1.2%(-0.170)#7,731 |
| 2. | 17202 | 0.36% | 1.1%(-0.786)#716 | 1.2%(-0.823)#14,318 |
1
Common Questions
What are the Top Zip Codes with the Highest Percentage of Population Employed in Legal Services & Support in Chambersburg, PA?
Top Zip Codes with the Highest Percentage of Population Employed in Legal Services & Support in Chambersburg, PA are:
What zip code has the Highest Percentage of Population Employed in Legal Services & Support in Chambersburg, PA?
17201 has the Highest Percentage of Population Employed in Legal Services & Support in Chambersburg, PA with 1.0%.
What is the Percentage of Population Employed in Legal Services & Support in Pennsylvania?
Percentage of Population Employed in Legal Services & Support in Pennsylvania is 1.1%.
What is the Percentage of Population Employed in Legal Services & Support in the United States?
Percentage of Population Employed in Legal Services & Support in the United States is 1.2%.