Zip Codes with the Highest Percentage of Population Employed in Architecture & Engineering in Owensboro, KY
RELATED REPORTS & OPTIONS
Architecture & Engineering
Owensboro
Compare Zip Codes
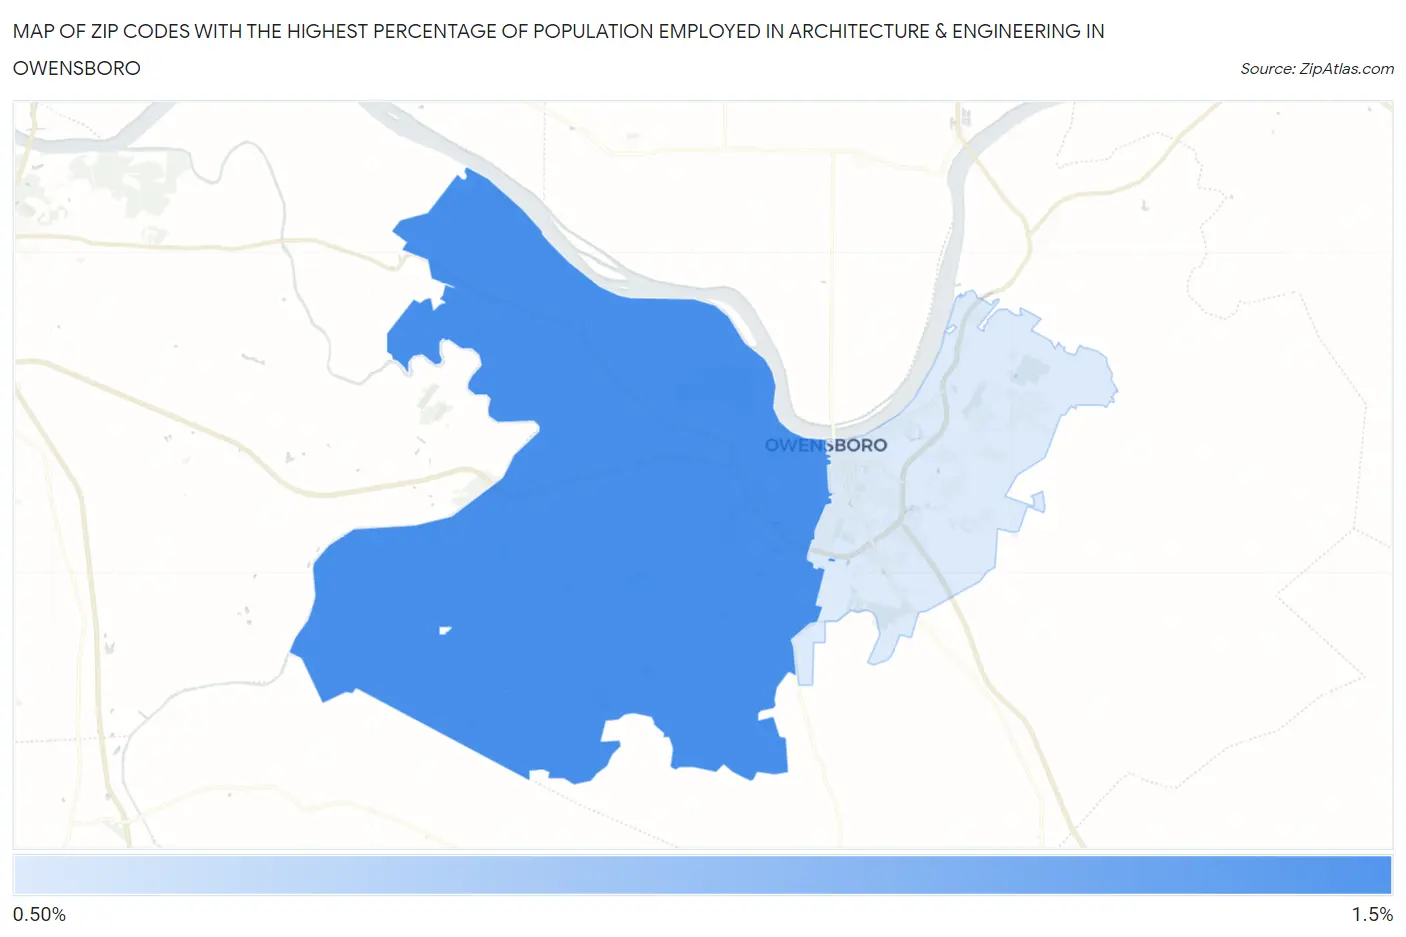
Map of Zip Codes with the Highest Percentage of Population Employed in Architecture & Engineering in Owensboro
0.79%
1.2%
Zip Codes with the Highest Percentage of Population Employed in Architecture & Engineering in Owensboro, KY
| Zip Code | % Employed | vs State | vs National | |
| 1. | 42301 | 1.2% | 1.7%(-0.492)#216 | 2.1%(-0.942)#15,018 |
| 2. | 42303 | 0.79% | 1.7%(-0.912)#279 | 2.1%(-1.36)#18,229 |
1
Common Questions
What are the Top Zip Codes with the Highest Percentage of Population Employed in Architecture & Engineering in Owensboro, KY?
Top Zip Codes with the Highest Percentage of Population Employed in Architecture & Engineering in Owensboro, KY are:
What zip code has the Highest Percentage of Population Employed in Architecture & Engineering in Owensboro, KY?
42301 has the Highest Percentage of Population Employed in Architecture & Engineering in Owensboro, KY with 1.2%.
What is the Percentage of Population Employed in Architecture & Engineering in Owensboro, KY?
Percentage of Population Employed in Architecture & Engineering in Owensboro is 0.62%.
What is the Percentage of Population Employed in Architecture & Engineering in Kentucky?
Percentage of Population Employed in Architecture & Engineering in Kentucky is 1.7%.
What is the Percentage of Population Employed in Architecture & Engineering in the United States?
Percentage of Population Employed in Architecture & Engineering in the United States is 2.1%.