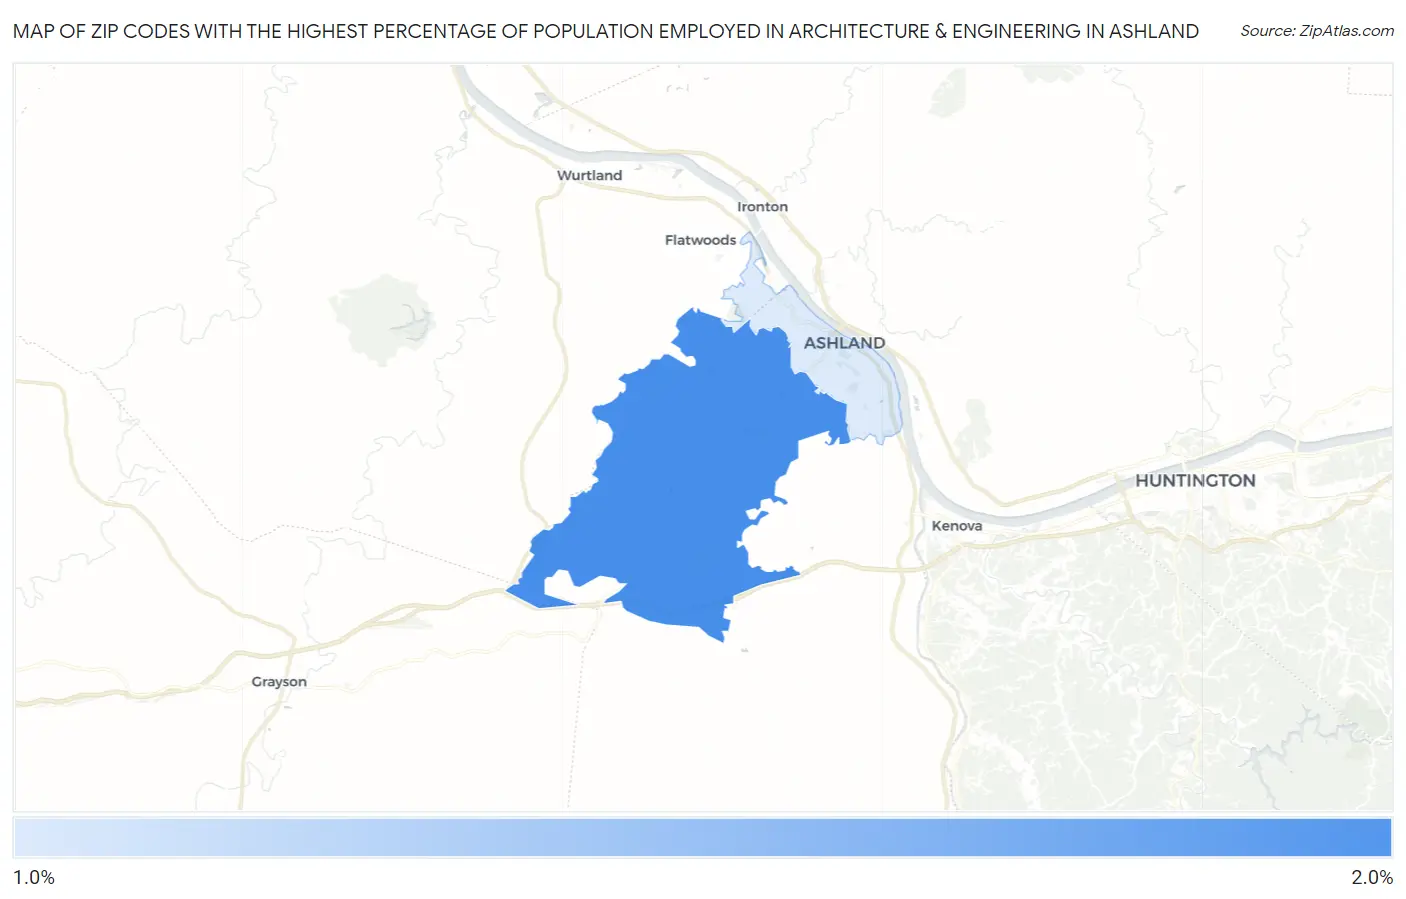
Zip Codes with the Highest Percentage of Population Employed in Architecture & Engineering in Ashland, KY
RELATED REPORTS & OPTIONS
Architecture & Engineering
Ashland
Compare Zip Codes
Map of Zip Codes with the Highest Percentage of Population Employed in Architecture & Engineering in Ashland
1.7%
1.8%
Zip Codes with the Highest Percentage of Population Employed in Architecture & Engineering in Ashland, KY
| Zip Code | % Employed | vs State | vs National | |
| 1. | 41102 | 1.8% | 1.7%(+0.098)#150 | 2.1%(-0.352)#10,836 |
| 2. | 41101 | 1.7% | 1.7%(+0.003)#161 | 2.1%(-0.447)#11,480 |
1
Common Questions
What are the Top Zip Codes with the Highest Percentage of Population Employed in Architecture & Engineering in Ashland, KY?
Top Zip Codes with the Highest Percentage of Population Employed in Architecture & Engineering in Ashland, KY are:
What zip code has the Highest Percentage of Population Employed in Architecture & Engineering in Ashland, KY?
41102 has the Highest Percentage of Population Employed in Architecture & Engineering in Ashland, KY with 1.8%.
What is the Percentage of Population Employed in Architecture & Engineering in Ashland, KY?
Percentage of Population Employed in Architecture & Engineering in Ashland is 1.4%.
What is the Percentage of Population Employed in Architecture & Engineering in Kentucky?
Percentage of Population Employed in Architecture & Engineering in Kentucky is 1.7%.
What is the Percentage of Population Employed in Architecture & Engineering in the United States?
Percentage of Population Employed in Architecture & Engineering in the United States is 2.1%.