Immigrants from West Indies vs Immigrants from Sudan Married-couple Households
COMPARE
Immigrants from West Indies
Immigrants from Sudan
Married-couple Households
Married-couple Households Comparison
Immigrants from West Indies
Immigrants from Sudan
39.0%
MARRIED-COUPLE HOUSEHOLDS
0.0/ 100
METRIC RATING
333rd/ 347
METRIC RANK
41.9%
MARRIED-COUPLE HOUSEHOLDS
0.0/ 100
METRIC RATING
296th/ 347
METRIC RANK
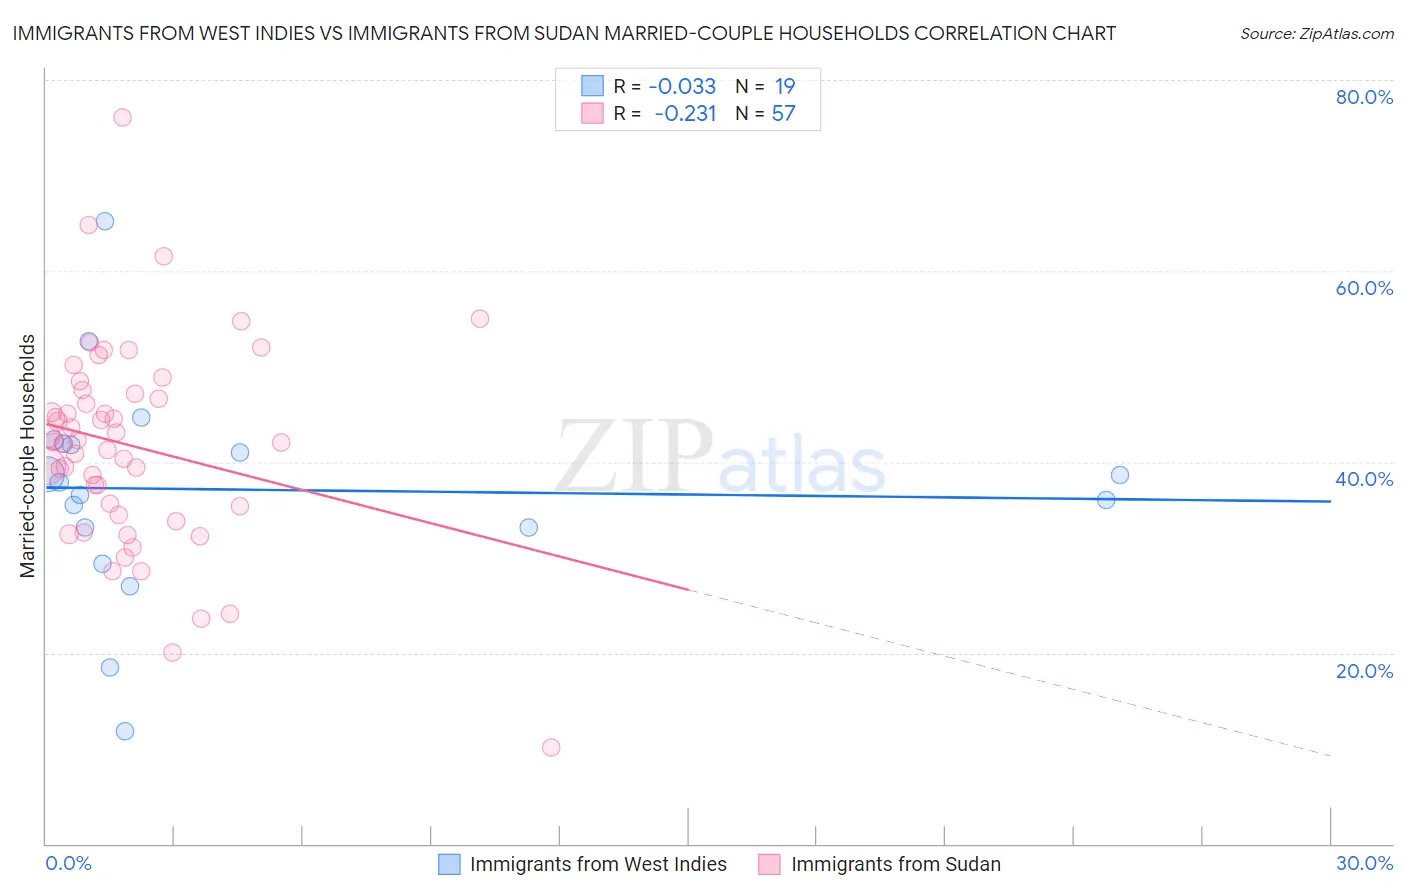
Immigrants from West Indies vs Immigrants from Sudan Married-couple Households Correlation Chart
The statistical analysis conducted on geographies consisting of 72,454,628 people shows no correlation between the proportion of Immigrants from West Indies and percentage of married-couple family households in the United States with a correlation coefficient (R) of -0.033 and weighted average of 39.0%. Similarly, the statistical analysis conducted on geographies consisting of 118,946,439 people shows a weak negative correlation between the proportion of Immigrants from Sudan and percentage of married-couple family households in the United States with a correlation coefficient (R) of -0.231 and weighted average of 41.9%, a difference of 7.6%.
Married-couple Households Correlation Summary
| Measurement | Immigrants from West Indies | Immigrants from Sudan |
| Minimum | 11.8% | 10.0% |
| Maximum | 65.1% | 76.0% |
| Range | 53.3% | 66.0% |
| Mean | 37.1% | 41.7% |
| Median | 37.9% | 42.1% |
| Interquartile 25% (IQ1) | 33.1% | 34.9% |
| Interquartile 75% (IQ3) | 41.9% | 47.3% |
| Interquartile Range (IQR) | 8.8% | 12.4% |
| Standard Deviation (Sample) | 11.5% | 10.9% |
| Standard Deviation (Population) | 11.1% | 10.8% |
Similar Demographics by Married-couple Households
Demographics Similar to Immigrants from West Indies by Married-couple Households
In terms of married-couple households, the demographic groups most similar to Immigrants from West Indies are Somali (39.0%, a difference of 0.030%), Immigrants from Congo (39.0%, a difference of 0.12%), Immigrants from Barbados (39.2%, a difference of 0.56%), Immigrants from St. Vincent and the Grenadines (38.7%, a difference of 0.78%), and Immigrants from Dominica (39.4%, a difference of 1.0%).
| Demographics | Rating | Rank | Married-couple Households |
| U.S. Virgin Islanders | 0.0 /100 | #326 | Tragic 39.8% |
| Lumbee | 0.0 /100 | #327 | Tragic 39.6% |
| Barbadians | 0.0 /100 | #328 | Tragic 39.4% |
| Immigrants | Dominica | 0.0 /100 | #329 | Tragic 39.4% |
| Immigrants | Barbados | 0.0 /100 | #330 | Tragic 39.2% |
| Immigrants | Congo | 0.0 /100 | #331 | Tragic 39.0% |
| Somalis | 0.0 /100 | #332 | Tragic 39.0% |
| Immigrants | West Indies | 0.0 /100 | #333 | Tragic 39.0% |
| Immigrants | St. Vincent and the Grenadines | 0.0 /100 | #334 | Tragic 38.7% |
| Senegalese | 0.0 /100 | #335 | Tragic 38.6% |
| Blacks/African Americans | 0.0 /100 | #336 | Tragic 38.5% |
| Immigrants | Somalia | 0.0 /100 | #337 | Tragic 38.4% |
| Immigrants | Senegal | 0.0 /100 | #338 | Tragic 38.4% |
| British West Indians | 0.0 /100 | #339 | Tragic 38.3% |
| Dominicans | 0.0 /100 | #340 | Tragic 38.2% |
Demographics Similar to Immigrants from Sudan by Married-couple Households
In terms of married-couple households, the demographic groups most similar to Immigrants from Sudan are Menominee (42.0%, a difference of 0.11%), Immigrants from Yemen (42.0%, a difference of 0.11%), Kiowa (42.0%, a difference of 0.11%), Indonesian (42.0%, a difference of 0.22%), and Paiute (42.1%, a difference of 0.27%).
| Demographics | Rating | Rank | Married-couple Households |
| Sudanese | 0.0 /100 | #289 | Tragic 42.1% |
| Hondurans | 0.0 /100 | #290 | Tragic 42.1% |
| Paiute | 0.0 /100 | #291 | Tragic 42.1% |
| Indonesians | 0.0 /100 | #292 | Tragic 42.0% |
| Menominee | 0.0 /100 | #293 | Tragic 42.0% |
| Immigrants | Yemen | 0.0 /100 | #294 | Tragic 42.0% |
| Kiowa | 0.0 /100 | #295 | Tragic 42.0% |
| Immigrants | Sudan | 0.0 /100 | #296 | Tragic 41.9% |
| Arapaho | 0.0 /100 | #297 | Tragic 41.8% |
| Immigrants | Middle Africa | 0.0 /100 | #298 | Tragic 41.8% |
| Immigrants | Ghana | 0.0 /100 | #299 | Tragic 41.8% |
| Immigrants | Belize | 0.0 /100 | #300 | Tragic 41.8% |
| Immigrants | Bahamas | 0.0 /100 | #301 | Tragic 41.7% |
| Immigrants | Honduras | 0.0 /100 | #302 | Tragic 41.6% |
| Sub-Saharan Africans | 0.0 /100 | #303 | Tragic 41.6% |