Immigrants from Kenya vs Guatemalan Married-couple Households
COMPARE
Immigrants from Kenya
Guatemalan
Married-couple Households
Married-couple Households Comparison
Immigrants from Kenya
Guatemalans
44.1%
MARRIED-COUPLE HOUSEHOLDS
0.4/ 100
METRIC RATING
249th/ 347
METRIC RANK
43.3%
MARRIED-COUPLE HOUSEHOLDS
0.1/ 100
METRIC RATING
271st/ 347
METRIC RANK
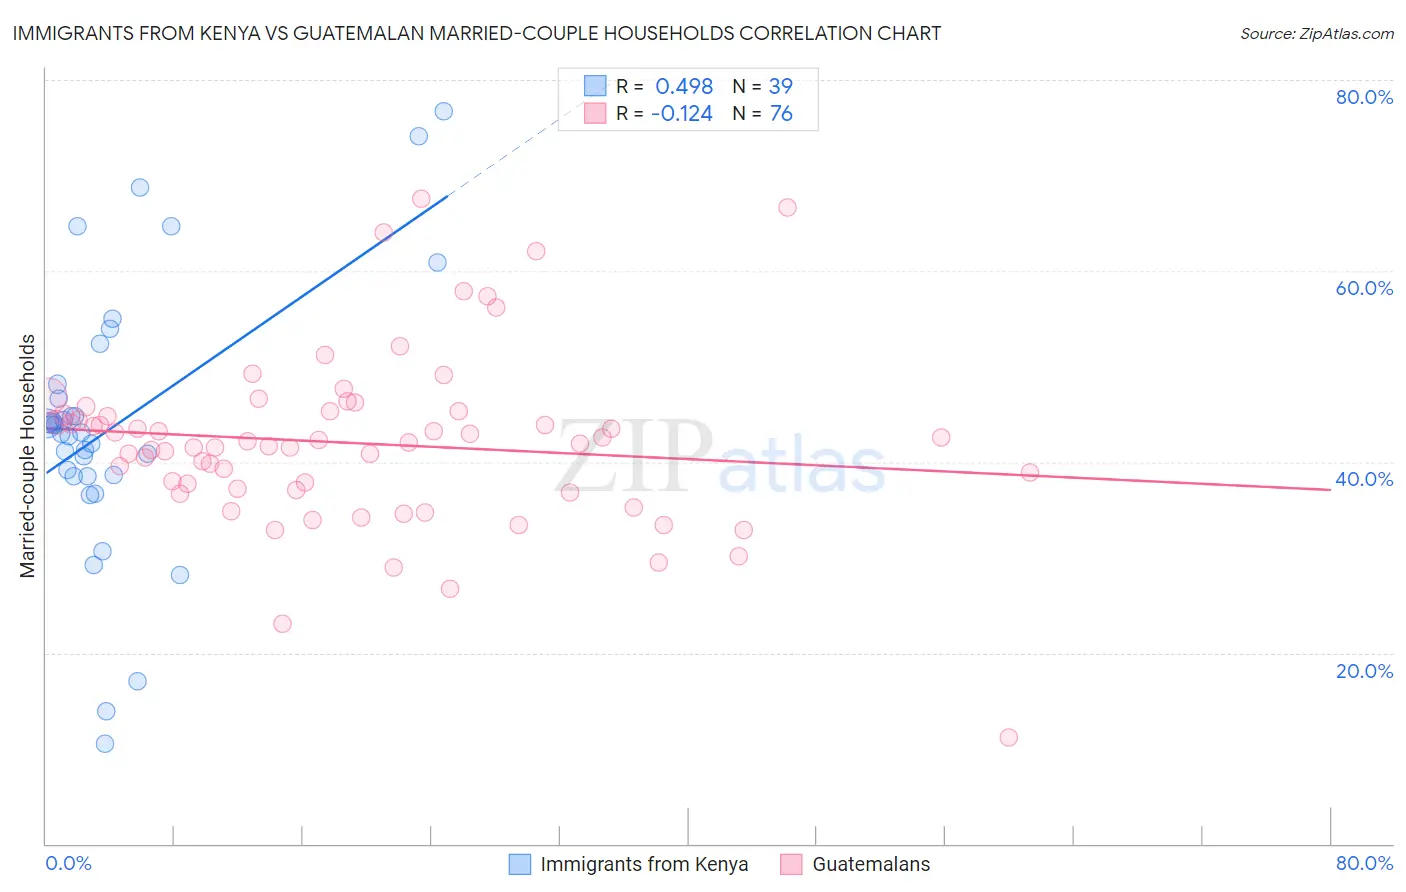
Immigrants from Kenya vs Guatemalan Married-couple Households Correlation Chart
The statistical analysis conducted on geographies consisting of 217,996,178 people shows a moderate positive correlation between the proportion of Immigrants from Kenya and percentage of married-couple family households in the United States with a correlation coefficient (R) of 0.498 and weighted average of 44.1%. Similarly, the statistical analysis conducted on geographies consisting of 409,284,876 people shows a poor negative correlation between the proportion of Guatemalans and percentage of married-couple family households in the United States with a correlation coefficient (R) of -0.124 and weighted average of 43.3%, a difference of 1.9%.
Married-couple Households Correlation Summary
| Measurement | Immigrants from Kenya | Guatemalan |
| Minimum | 10.5% | 11.2% |
| Maximum | 76.7% | 67.5% |
| Range | 66.2% | 56.3% |
| Mean | 43.9% | 42.0% |
| Median | 43.1% | 41.9% |
| Interquartile 25% (IQ1) | 38.5% | 37.1% |
| Interquartile 75% (IQ3) | 48.1% | 45.1% |
| Interquartile Range (IQR) | 9.6% | 8.0% |
| Standard Deviation (Sample) | 14.3% | 9.1% |
| Standard Deviation (Population) | 14.1% | 9.0% |
Similar Demographics by Married-couple Households
Demographics Similar to Immigrants from Kenya by Married-couple Households
In terms of married-couple households, the demographic groups most similar to Immigrants from Kenya are French American Indian (44.1%, a difference of 0.010%), Yup'ik (44.1%, a difference of 0.050%), German Russian (44.0%, a difference of 0.090%), Seminole (44.0%, a difference of 0.16%), and Central American (43.9%, a difference of 0.28%).
| Demographics | Rating | Rank | Married-couple Households |
| Immigrants | Albania | 1.0 /100 | #242 | Tragic 44.4% |
| Immigrants | Saudi Arabia | 0.9 /100 | #243 | Tragic 44.4% |
| Immigrants | Armenia | 0.7 /100 | #244 | Tragic 44.3% |
| Immigrants | El Salvador | 0.7 /100 | #245 | Tragic 44.3% |
| Immigrants | Cuba | 0.6 /100 | #246 | Tragic 44.2% |
| Immigrants | Morocco | 0.6 /100 | #247 | Tragic 44.2% |
| Yup'ik | 0.4 /100 | #248 | Tragic 44.1% |
| Immigrants | Kenya | 0.4 /100 | #249 | Tragic 44.1% |
| French American Indians | 0.4 /100 | #250 | Tragic 44.1% |
| German Russians | 0.4 /100 | #251 | Tragic 44.0% |
| Seminole | 0.4 /100 | #252 | Tragic 44.0% |
| Central Americans | 0.3 /100 | #253 | Tragic 43.9% |
| Apache | 0.3 /100 | #254 | Tragic 43.9% |
| Shoshone | 0.3 /100 | #255 | Tragic 43.9% |
| Ugandans | 0.3 /100 | #256 | Tragic 43.8% |
Demographics Similar to Guatemalans by Married-couple Households
In terms of married-couple households, the demographic groups most similar to Guatemalans are Yuman (43.3%, a difference of 0.11%), Immigrants from Nigeria (43.2%, a difference of 0.11%), Immigrants from Sierra Leone (43.3%, a difference of 0.15%), Ethiopian (43.2%, a difference of 0.20%), and Nigerian (43.2%, a difference of 0.21%).
| Demographics | Rating | Rank | Married-couple Households |
| Bangladeshis | 0.1 /100 | #264 | Tragic 43.5% |
| Moroccans | 0.1 /100 | #265 | Tragic 43.5% |
| Ecuadorians | 0.1 /100 | #266 | Tragic 43.5% |
| Natives/Alaskans | 0.1 /100 | #267 | Tragic 43.5% |
| Immigrants | Burma/Myanmar | 0.1 /100 | #268 | Tragic 43.4% |
| Immigrants | Sierra Leone | 0.1 /100 | #269 | Tragic 43.3% |
| Yuman | 0.1 /100 | #270 | Tragic 43.3% |
| Guatemalans | 0.1 /100 | #271 | Tragic 43.3% |
| Immigrants | Nigeria | 0.1 /100 | #272 | Tragic 43.2% |
| Ethiopians | 0.1 /100 | #273 | Tragic 43.2% |
| Nigerians | 0.1 /100 | #274 | Tragic 43.2% |
| Immigrants | Bangladesh | 0.0 /100 | #275 | Tragic 43.1% |
| Immigrants | Ethiopia | 0.0 /100 | #276 | Tragic 43.1% |
| Immigrants | Eastern Africa | 0.0 /100 | #277 | Tragic 42.9% |
| Immigrants | Africa | 0.0 /100 | #278 | Tragic 42.9% |