Navajo vs Danish Disability Age Under 5
COMPARE
Navajo
Danish
Disability Age Under 5
Disability Age Under 5 Comparison
Navajo
Danes
1.6%
DISABILITY AGE UNDER 5
0.0/ 100
METRIC RATING
308th/ 347
METRIC RANK
1.5%
DISABILITY AGE UNDER 5
0.0/ 100
METRIC RATING
279th/ 347
METRIC RANK
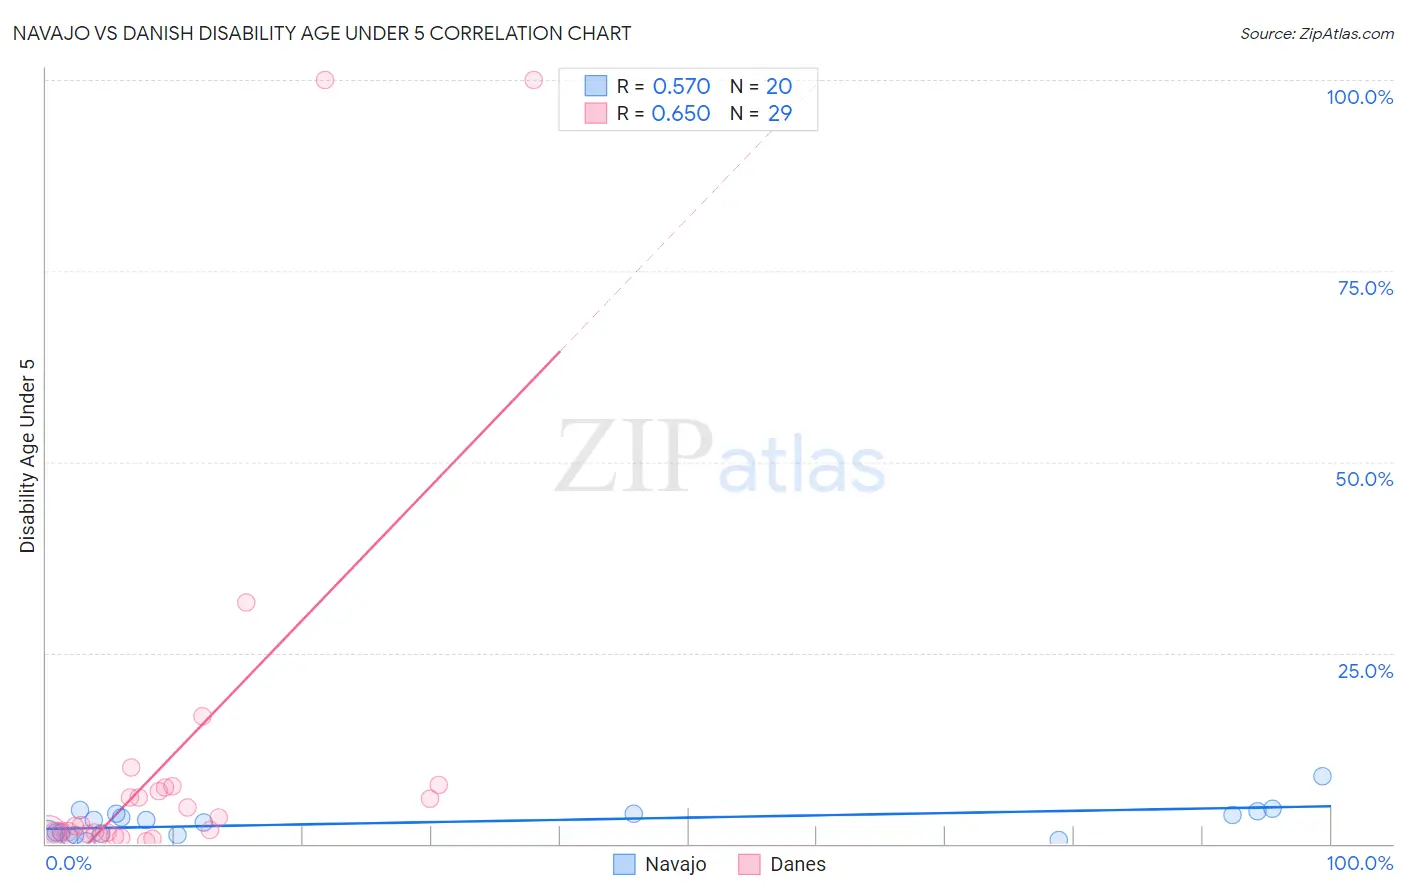
Navajo vs Danish Disability Age Under 5 Correlation Chart
The statistical analysis conducted on geographies consisting of 151,471,391 people shows a substantial positive correlation between the proportion of Navajo and percentage of population with a disability under the age of 5 in the United States with a correlation coefficient (R) of 0.570 and weighted average of 1.6%. Similarly, the statistical analysis conducted on geographies consisting of 235,175,011 people shows a significant positive correlation between the proportion of Danes and percentage of population with a disability under the age of 5 in the United States with a correlation coefficient (R) of 0.650 and weighted average of 1.5%, a difference of 11.7%.
Disability Age Under 5 Correlation Summary
| Measurement | Navajo | Danish |
| Minimum | 0.40% | 0.30% |
| Maximum | 8.9% | 100.0% |
| Range | 8.5% | 99.7% |
| Mean | 2.8% | 11.5% |
| Median | 3.0% | 2.5% |
| Interquartile 25% (IQ1) | 1.1% | 1.4% |
| Interquartile 75% (IQ3) | 3.9% | 7.4% |
| Interquartile Range (IQR) | 2.8% | 6.0% |
| Standard Deviation (Sample) | 2.0% | 25.3% |
| Standard Deviation (Population) | 2.0% | 24.8% |
Similar Demographics by Disability Age Under 5
Demographics Similar to Navajo by Disability Age Under 5
In terms of disability age under 5, the demographic groups most similar to Navajo are Scottish (1.6%, a difference of 0.14%), Creek (1.6%, a difference of 0.21%), Blackfeet (1.6%, a difference of 0.25%), Seminole (1.6%, a difference of 0.40%), and Cape Verdean (1.7%, a difference of 0.63%).
| Demographics | Rating | Rank | Disability Age Under 5 |
| German Russians | 0.0 /100 | #301 | Tragic 1.6% |
| Welsh | 0.0 /100 | #302 | Tragic 1.6% |
| Swiss | 0.0 /100 | #303 | Tragic 1.6% |
| Seminole | 0.0 /100 | #304 | Tragic 1.6% |
| Blackfeet | 0.0 /100 | #305 | Tragic 1.6% |
| Creek | 0.0 /100 | #306 | Tragic 1.6% |
| Scottish | 0.0 /100 | #307 | Tragic 1.6% |
| Navajo | 0.0 /100 | #308 | Tragic 1.6% |
| Cape Verdeans | 0.0 /100 | #309 | Tragic 1.7% |
| Whites/Caucasians | 0.0 /100 | #310 | Tragic 1.7% |
| English | 0.0 /100 | #311 | Tragic 1.7% |
| Puerto Ricans | 0.0 /100 | #312 | Tragic 1.7% |
| Celtics | 0.0 /100 | #313 | Tragic 1.7% |
| Norwegians | 0.0 /100 | #314 | Tragic 1.7% |
| Dutch | 0.0 /100 | #315 | Tragic 1.7% |
Demographics Similar to Danes by Disability Age Under 5
In terms of disability age under 5, the demographic groups most similar to Danes are Kiowa (1.5%, a difference of 0.010%), Canadian (1.5%, a difference of 0.090%), British (1.5%, a difference of 0.76%), Greek (1.5%, a difference of 0.79%), and Brazilian (1.5%, a difference of 1.4%).
| Demographics | Rating | Rank | Disability Age Under 5 |
| Blacks/African Americans | 0.1 /100 | #272 | Tragic 1.4% |
| Alaskan Athabascans | 0.1 /100 | #273 | Tragic 1.5% |
| Iroquois | 0.0 /100 | #274 | Tragic 1.5% |
| Brazilians | 0.0 /100 | #275 | Tragic 1.5% |
| Greeks | 0.0 /100 | #276 | Tragic 1.5% |
| Canadians | 0.0 /100 | #277 | Tragic 1.5% |
| Kiowa | 0.0 /100 | #278 | Tragic 1.5% |
| Danes | 0.0 /100 | #279 | Tragic 1.5% |
| British | 0.0 /100 | #280 | Tragic 1.5% |
| Czechoslovakians | 0.0 /100 | #281 | Tragic 1.5% |
| Cheyenne | 0.0 /100 | #282 | Tragic 1.5% |
| Delaware | 0.0 /100 | #283 | Tragic 1.5% |
| Europeans | 0.0 /100 | #284 | Tragic 1.5% |
| Croatians | 0.0 /100 | #285 | Tragic 1.5% |
| Tlingit-Haida | 0.0 /100 | #286 | Tragic 1.5% |