Celtic vs Comanche Disability Age Under 5
COMPARE
Celtic
Comanche
Disability Age Under 5
Disability Age Under 5 Comparison
Celtics
Comanche
1.7%
DISABILITY AGE UNDER 5
0.0/ 100
METRIC RATING
313th/ 347
METRIC RANK
1.2%
DISABILITY AGE UNDER 5
47.5/ 100
METRIC RATING
177th/ 347
METRIC RANK
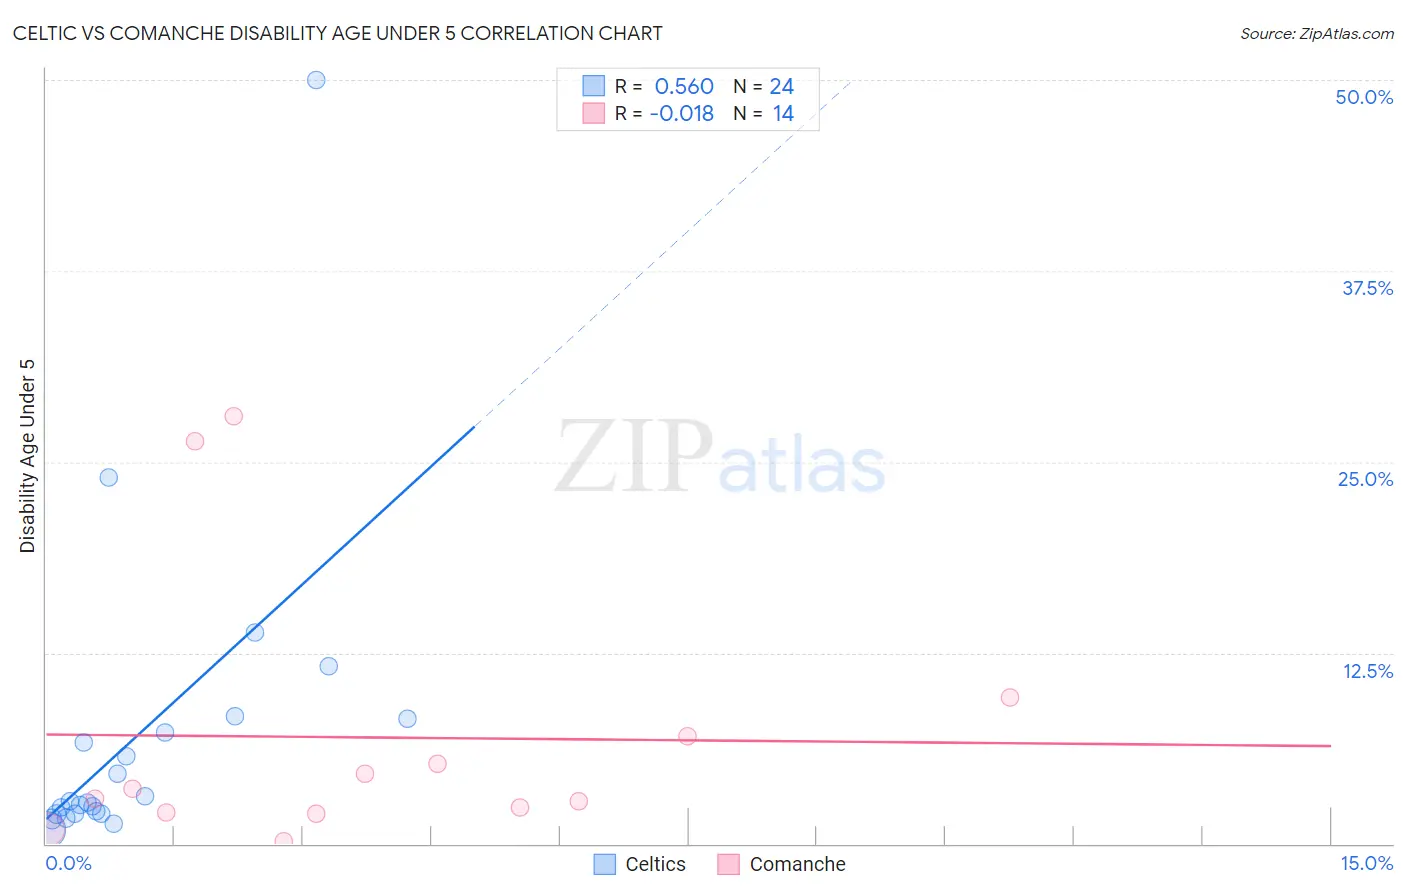
Celtic vs Comanche Disability Age Under 5 Correlation Chart
The statistical analysis conducted on geographies consisting of 116,047,957 people shows a substantial positive correlation between the proportion of Celtics and percentage of population with a disability under the age of 5 in the United States with a correlation coefficient (R) of 0.560 and weighted average of 1.7%. Similarly, the statistical analysis conducted on geographies consisting of 83,999,768 people shows no correlation between the proportion of Comanche and percentage of population with a disability under the age of 5 in the United States with a correlation coefficient (R) of -0.018 and weighted average of 1.2%, a difference of 34.7%.
Disability Age Under 5 Correlation Summary
| Measurement | Celtic | Comanche |
| Minimum | 0.88% | 0.20% |
| Maximum | 50.0% | 28.0% |
| Range | 49.1% | 27.8% |
| Mean | 7.1% | 7.0% |
| Median | 2.8% | 3.3% |
| Interquartile 25% (IQ1) | 2.0% | 2.0% |
| Interquartile 75% (IQ3) | 7.7% | 7.0% |
| Interquartile Range (IQR) | 5.7% | 5.0% |
| Standard Deviation (Sample) | 10.5% | 8.9% |
| Standard Deviation (Population) | 10.3% | 8.6% |
Similar Demographics by Disability Age Under 5
Demographics Similar to Celtics by Disability Age Under 5
In terms of disability age under 5, the demographic groups most similar to Celtics are Puerto Rican (1.7%, a difference of 0.16%), Norwegian (1.7%, a difference of 0.16%), English (1.7%, a difference of 0.20%), Dutch (1.7%, a difference of 0.42%), and Immigrants from Cabo Verde (1.7%, a difference of 0.60%).
| Demographics | Rating | Rank | Disability Age Under 5 |
| Creek | 0.0 /100 | #306 | Tragic 1.6% |
| Scottish | 0.0 /100 | #307 | Tragic 1.6% |
| Navajo | 0.0 /100 | #308 | Tragic 1.6% |
| Cape Verdeans | 0.0 /100 | #309 | Tragic 1.7% |
| Whites/Caucasians | 0.0 /100 | #310 | Tragic 1.7% |
| English | 0.0 /100 | #311 | Tragic 1.7% |
| Puerto Ricans | 0.0 /100 | #312 | Tragic 1.7% |
| Celtics | 0.0 /100 | #313 | Tragic 1.7% |
| Norwegians | 0.0 /100 | #314 | Tragic 1.7% |
| Dutch | 0.0 /100 | #315 | Tragic 1.7% |
| Immigrants | Cabo Verde | 0.0 /100 | #316 | Tragic 1.7% |
| French | 0.0 /100 | #317 | Tragic 1.7% |
| Irish | 0.0 /100 | #318 | Tragic 1.7% |
| Slovaks | 0.0 /100 | #319 | Tragic 1.7% |
| Scotch-Irish | 0.0 /100 | #320 | Tragic 1.7% |
Demographics Similar to Comanche by Disability Age Under 5
In terms of disability age under 5, the demographic groups most similar to Comanche are Venezuelan (1.2%, a difference of 0.040%), Immigrants from Kenya (1.2%, a difference of 0.090%), Immigrants from Bahamas (1.2%, a difference of 0.21%), Immigrants from Latvia (1.2%, a difference of 0.22%), and Immigrants from Nigeria (1.2%, a difference of 0.22%).
| Demographics | Rating | Rank | Disability Age Under 5 |
| Immigrants | Jamaica | 58.8 /100 | #170 | Average 1.2% |
| Guamanians/Chamorros | 57.8 /100 | #171 | Average 1.2% |
| Crow | 51.0 /100 | #172 | Average 1.2% |
| Immigrants | Ireland | 50.3 /100 | #173 | Average 1.2% |
| Immigrants | Latvia | 50.0 /100 | #174 | Average 1.2% |
| Immigrants | Nigeria | 50.0 /100 | #175 | Average 1.2% |
| Immigrants | Kenya | 48.6 /100 | #176 | Average 1.2% |
| Comanche | 47.5 /100 | #177 | Average 1.2% |
| Venezuelans | 47.1 /100 | #178 | Average 1.2% |
| Immigrants | Bahamas | 45.2 /100 | #179 | Average 1.2% |
| Immigrants | Mexico | 44.4 /100 | #180 | Average 1.2% |
| Immigrants | Peru | 43.7 /100 | #181 | Average 1.2% |
| Macedonians | 43.7 /100 | #181 | Average 1.2% |
| Immigrants | Saudi Arabia | 43.3 /100 | #183 | Average 1.2% |
| Palestinians | 43.0 /100 | #184 | Average 1.2% |