Celtic vs Immigrants from Zimbabwe Disability Age Under 5
COMPARE
Celtic
Immigrants from Zimbabwe
Disability Age Under 5
Disability Age Under 5 Comparison
Celtics
Immigrants from Zimbabwe
1.7%
DISABILITY AGE UNDER 5
0.0/ 100
METRIC RATING
313th/ 347
METRIC RANK
1.2%
DISABILITY AGE UNDER 5
77.9/ 100
METRIC RATING
145th/ 347
METRIC RANK
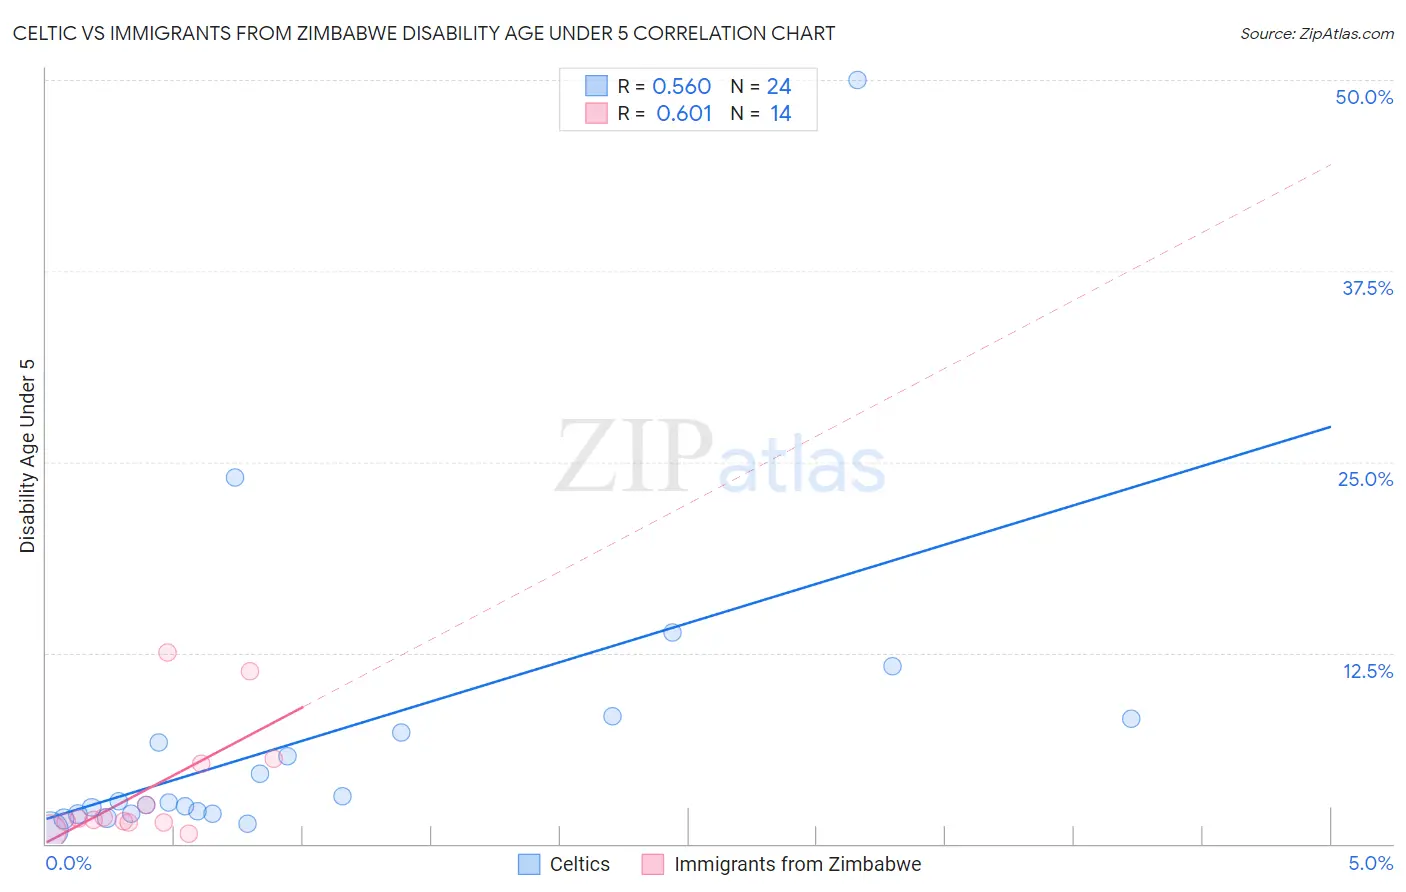
Celtic vs Immigrants from Zimbabwe Disability Age Under 5 Correlation Chart
The statistical analysis conducted on geographies consisting of 116,047,957 people shows a substantial positive correlation between the proportion of Celtics and percentage of population with a disability under the age of 5 in the United States with a correlation coefficient (R) of 0.560 and weighted average of 1.7%. Similarly, the statistical analysis conducted on geographies consisting of 89,065,062 people shows a significant positive correlation between the proportion of Immigrants from Zimbabwe and percentage of population with a disability under the age of 5 in the United States with a correlation coefficient (R) of 0.601 and weighted average of 1.2%, a difference of 39.0%.
Disability Age Under 5 Correlation Summary
| Measurement | Celtic | Immigrants from Zimbabwe |
| Minimum | 0.88% | 0.62% |
| Maximum | 50.0% | 12.5% |
| Range | 49.1% | 11.9% |
| Mean | 7.1% | 3.5% |
| Median | 2.8% | 1.6% |
| Interquartile 25% (IQ1) | 2.0% | 1.4% |
| Interquartile 75% (IQ3) | 7.7% | 5.2% |
| Interquartile Range (IQR) | 5.7% | 3.8% |
| Standard Deviation (Sample) | 10.5% | 3.9% |
| Standard Deviation (Population) | 10.3% | 3.7% |
Similar Demographics by Disability Age Under 5
Demographics Similar to Celtics by Disability Age Under 5
In terms of disability age under 5, the demographic groups most similar to Celtics are Puerto Rican (1.7%, a difference of 0.16%), Norwegian (1.7%, a difference of 0.16%), English (1.7%, a difference of 0.20%), Dutch (1.7%, a difference of 0.42%), and Immigrants from Cabo Verde (1.7%, a difference of 0.60%).
| Demographics | Rating | Rank | Disability Age Under 5 |
| Creek | 0.0 /100 | #306 | Tragic 1.6% |
| Scottish | 0.0 /100 | #307 | Tragic 1.6% |
| Navajo | 0.0 /100 | #308 | Tragic 1.6% |
| Cape Verdeans | 0.0 /100 | #309 | Tragic 1.7% |
| Whites/Caucasians | 0.0 /100 | #310 | Tragic 1.7% |
| English | 0.0 /100 | #311 | Tragic 1.7% |
| Puerto Ricans | 0.0 /100 | #312 | Tragic 1.7% |
| Celtics | 0.0 /100 | #313 | Tragic 1.7% |
| Norwegians | 0.0 /100 | #314 | Tragic 1.7% |
| Dutch | 0.0 /100 | #315 | Tragic 1.7% |
| Immigrants | Cabo Verde | 0.0 /100 | #316 | Tragic 1.7% |
| French | 0.0 /100 | #317 | Tragic 1.7% |
| Irish | 0.0 /100 | #318 | Tragic 1.7% |
| Slovaks | 0.0 /100 | #319 | Tragic 1.7% |
| Scotch-Irish | 0.0 /100 | #320 | Tragic 1.7% |
Demographics Similar to Immigrants from Zimbabwe by Disability Age Under 5
In terms of disability age under 5, the demographic groups most similar to Immigrants from Zimbabwe are Samoan (1.2%, a difference of 0.040%), Immigrants from Middle Africa (1.2%, a difference of 0.18%), Immigrants from Colombia (1.2%, a difference of 0.19%), Alsatian (1.2%, a difference of 0.19%), and Icelander (1.2%, a difference of 0.21%).
| Demographics | Rating | Rank | Disability Age Under 5 |
| Immigrants | Czechoslovakia | 82.8 /100 | #138 | Excellent 1.2% |
| New Zealanders | 81.4 /100 | #139 | Excellent 1.2% |
| Somalis | 80.8 /100 | #140 | Excellent 1.2% |
| Immigrants | Honduras | 80.4 /100 | #141 | Excellent 1.2% |
| Immigrants | Colombia | 79.3 /100 | #142 | Good 1.2% |
| Alsatians | 79.3 /100 | #143 | Good 1.2% |
| Immigrants | Middle Africa | 79.3 /100 | #144 | Good 1.2% |
| Immigrants | Zimbabwe | 77.9 /100 | #145 | Good 1.2% |
| Samoans | 77.7 /100 | #146 | Good 1.2% |
| Icelanders | 76.3 /100 | #147 | Good 1.2% |
| Ghanaians | 76.3 /100 | #148 | Good 1.2% |
| Kenyans | 75.9 /100 | #149 | Good 1.2% |
| South Americans | 75.6 /100 | #150 | Good 1.2% |
| Yaqui | 74.8 /100 | #151 | Good 1.2% |
| Hondurans | 72.5 /100 | #152 | Good 1.2% |